Proceedings Sardinia 2005, Tenth International Waste Management and Landfill Symposium S. Margherita di Pula, Cagliari, Italy; 3 - 7 October 2005
2005 by CISA, Environmental Sanitary Engineering Centre, Italy
ENVIRONMENTAL BURDENS FROM MSW
MANAGEMENT USING LIFE CYCLE
ASSESSMENT
S. XARÁ*, M.F. ALMEIDA**, M. SILVA* AND C. COSTA**
*Escola Superior de Biotecnologia -Universidade Católica Portuguesa
Rua Dr. António Bernardino de Almeida, 4200-072 Porto, Portugal
**LEPAE - Laboratório de Engenharia de Processos, Ambiente e Energia
Faculdade de Engenharia da Universidade do Porto, Portugal
SUMMARY: The environmental burdens to air and water resulting from the MSW management practices in the municipality of Porto were evaluated for 1990 and 2000 using the model developed by White et al (White et al, 1995). The operations considered in the study are collection, sorting, biological treatment, thermal treatment and landfilling. Savings from energy and recycling of recovered materials are also quantified. For each pollutant, the main source, among the operations considered, was identified. Results have shown that landfilling was the main source for air and water emissions in 1990, followed by collection. In 2000, thermal treatment was the main source for air pollutants and landfilling the main source of water pollutants, in both cases followed by collection. In 1990, collection was the main source for air emissions of particulates, CO, NOx, SOx to air, and of Organic compounds, Phenol and Fluoride to water. In 2000 it was the main source of NOx to air and TOC, phenol, total metals and fluoride to water. Biological treatment was the main source of N2O and nitrate to air in 1990 and of BOD, COD and ammonia to water in 2000.
1. INTRODUCTION
Municipal solid waste (MSW) management have been considered in Portugal one of the most important environmental issues. The main reasons for this major role include: the increase in the amount of waste produced; the need for new facilities for waste treatment and disposal which raised questions related with its locations and approval by municipalities and citizens; the continuously increasing costs of waste collection and treatment with citizens complains and disagreement or the need of municipalities to support these higher costs; and the awareness of citizens for questions related with the environment in general including the environmental burdens resulting from waste treatment and collection.
In Portugal, the MSW management is committed to municipalities that are in some cases organized in multimunicipal associations. In the city of Porto, the second largest city in Portugal, MSW is collected by municipal services also responsible for its transport to the treatment units
belonging to LIPOR, a company participated by 8 municipalities of the region that is responsible for MSW treatment and disposal.
In the last decade of the 20th century, also due to legislative pressure from the European Union, large changes were implemented in waste management collection and treatment/disposal systems in Portugal in order to achieve governmental goals but also to reduce the associated environmental burdens. In this paper, environmental burdens for air and water resulting from the MSW management practices in the municipality of Porto were evaluated for 1990 and 2000 using a model developed by White et al (White et al, 1995). The operations considered in this study are all used in the management practices and include: collection, sorting, biological treatment, thermal treatment and landfilling. Savings in energy consumption and in emissions resulting from recovered materials that replace virgin materials were also quantified. For each pollutant, the main source, among the operations considered, was identified. The pollutants included in the study are: (i) air pollutants - particulate, CO, CO2, CH4, NOx, N2O, SOx, HCl, HF, H2S, Total hydrocarbons (HC), Chlorinated hydrocarbons, Dioxins/furans, NH3, As, Cd, Cr, Cu, Pb, Hg, Ni, Zn; (ii) water pollutants – BOD, COD, Suspended solids, TOC, AOX, Chlorinated hydrocarbons, Dioxins/furans, Phenol, Ammonia, Total metals, As, Cd, Cr, Cu, Fe, Pb, Hg, Ni, Zn, Cl, F, NO3 and Sulphide.
2. PORTO: FROM 1990 TO 2000
The first step in this study was data collection for the description of the municipality in terms of population and waste production, characterization and management practices from collection to the final disposal. Personal contacts with Porto municipality environmental department (Xará, 2002) and with LIPOR (Xará, 2005), statistics (INE, 2001) and technical publications (LIPOR, 2000) were the main sources of the data. In the municipalities belonging to LIPOR, MSW are collected and transported by the municipalities to LIPOR treatment sites for further processing. From 1990 to 2000, there was a meaningful evolution concerning both the collection frequency and schemes and of the disposal and treatment units available.
2.1. Population
Porto is the second largest city of Portugal, with an area of 43 km2. In 1990, Porto had around 302 500 inhabitants and the average number of individuals per household was 2.67. In 2000 the population in Porto decreased to 263 100 and the average number of individuals per household also decreased to 2.1.
2.2. Waste production
Porto was responsible for 43% of the waste processed by LIPOR municipalities in 1990. In 2000, this value accounts only for about 30% due to the admittance of another municipality to the group. The mean MSW production was 383 kg/person.year in 1990 and 551 kg/person.year in 2000.
2.3. Waste collection
Waste collection in 1990 included kerbside collection of mixed waste and selective glass collection in glass banks. In 2000, the collection systems included: mixed waste kerbside collection, door-to-door collection of two fractions of dry recyclables - paper/cardboard and
plastic/metal packaging, and two types of voluntary bring systems - central collection sites and collection banks.
2.3.1. Mixed collection
In 1990, mixed MSW accounted for was about 115 000 ton and kerbside collection in plastic bags or community containers took place 6 times a week. It was assumed that the plastic bags for mixed waste disposal were used bags mainly from shopping and other purposes, a usual practice in Portugal. In 2000, kerbside collection of mixed waste took place 6 times a week. The mixed waste accounts for 96.4% of the total waste collected. Due to the lack of data, it was assumed that fuel consumption on collection was 30 L/1000 properties served.
2.3.2. Selective collection
In 1990, the selective collection included only glass. There were 364 glass banks in the city, where approximately 1 050 ton of glass were disposed.
The kerbside dry recyclables collection started in September 2000 and took place once a week for each fraction - paper/cardboard and plastic/metal packaging. Colored LDPE 20 g plastic bags were used for that purpose: a yellow one for plastic/metal packaging, and a blue one for paper/paperboard. The environmental burdens from bag production are also included in this study. The collection banks included containers for packages, paper/board and glass. In central collection sites, plastics, paper/paperboard and glass were accepted as well as other types of waste not considered in this study, as for example wood and bulky wastes. Only 2% of the packages and 1% of the paper were collected door to door, all the rest were collected from central sites and collection banks.
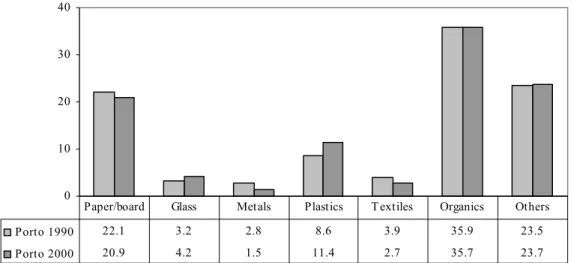
2.4. Waste characterization
Mixed waste composition (% by weight) is presented in Figure 1 for 1990 and 2000. In 1990, 93% of the metalic fraction are ferrous materials and 66% of the plastic fraction is assumed to be plastic film. In 2000, the metalic fraction includes 87% of ferrous metals and the plastic fraction includes 66% of plastic film. The total selective collection in 2000 (3,6% of the total amount collected) comprises: packages – 6,6%, paper/board – 36,8%, glass – 54,2% and plastics – 2,4%.
2.5. Waste disposal
The treatment methods available in 1990 include composting - 20% of mixed waste, landfilling - 80% of mixed waste, and glass recycling. In 2000, the mixed waste is sent to composting -19.7%, incineration - 79.2% and landfilling - 1.1%. Waste fractions separately collected were transported to a central sorting unit operated by LIPOR, where separated material was further sent to recyclers.
2.5.1. Central sorting
In this unit, the consumption of electrical energy and diesel are respectively 30.7 kWh and 2.17 L per ton of waste. The residue from this operation is transported to the incineration plant which is located 15 km from there.
0 10 20 30 40 Porto 1990 22.1 3.2 2.8 8.6 3.9 35.9 23.5 Porto 2000 20.9 4.2 1.5 11.4 2.7 35.7 23.7
Paper/board Glass Metals Plastics T extiles Organics Others
Figure 1. Mixed waste composition (% by weight) in 1990 and in 2000 in Porto municipality.
2.5.2. Composting
In 1990, 6% of ferrous metals and 17% of non-ferrous metals was recovered in the composting plant. The compost produced was totally marketed and the residual waste from sorting operations was placed in the landfill closely located (100 m). In 2000, the recovery of ferrous metals is assumed to be 100%. All the compost was marketable and the sorting residue was sent to a landfill 15 km away.
2.5.3. Incineration
The incineration plant is a mass-burn incinerator with energy recovery, producing electricity with an assumed efficiency of 20%. 90% (assumed) of the ferrous scrap is recovered from the bottom ashes. The non-hazardous waste produced by the incineration plant was sent to a landfill 15 km away. During that year, the fly ashes (hazardous waste) were transported to a landfill, of another MSW management system, located 300 km away.
2.5.4. Landfilling
The landfill gas was collected with an assumed efficiency of 40% and burned without energy recovery and 70% of the leachate was collected and treated. The fuel consumption for waste spreading operations was assumed as 0.6 L/ton of waste.
3. RESULTS AND DISCUSSION
The environmental burdens for air and water resulting from the MSW management practices in the municipality of Porto were calculated for 1990 and 2000 using the model developed by White et al (White et al, 1995). Results are presented on Figures 2 and 3. Values below zero are not represented because of the logarithmic scale used to allow for the inclusion of all the emissions in different ranges. These values are indicated in the legend of each figure. These negative values mean that the amount of pollutant avoided by energy or materials recovery is higher than the emission from the waste management operations.
Air emissions (kg) 10-7 10-6 10-5 10-4 10-3 10-2 10-1 100 101 102 103 104 105 106 107 108 109 ParticulatesN2O AmmoniaArsenic Nickel Copper Dioxins/Furans (TEQ) Mercury ChromiumCadmium Zinc LeadHF Chlor. HCHCl H2S SOxHC CO NOxCH4 CO2 1990 2000
Figure 2. Air emissions (kg) resulting from MSW management in 1990 and 2000 in Porto municipality. Emissions below zero are not represented: Particulates, N2O and Ammonia for 1990 (-1.57x10⁴; -17.7; - 4.19 kg respectively) and 2000 (-7.62x10⁴; -3.71x10³; -1.26x10² kg respectively) and also HC for 2000 (-8.98x10⁴ kg).
Water emissions (kg)
10-9 10-8 10- 7 10-6 10-5 10-4 10-3 10-2 10-1 100 101 102 103 104 105
Sulphide Dioxins/Furans (TEQ)Mercury CadmiumArsenic Copper ChromiumLead Nickel NitrateZinc Chlorinated HCsAOX Phenol FluorideIron Total Org. CompoundsTotal Metals Suspended SolidsAmmonia ChlorideBOD COD
1990 2000
Figure 3. Water emissions (kg) resulting from MSW management in 1990 and 2000 in Porto municipality. Emissions below zero are not represented: Sulphide, Nitrate, AOX, Fluoride, BOD and COD for 2000 (-11.7; -59.3; -4.63; -15.0; -2.87x10³; -3.71x10⁴ kg respectively).
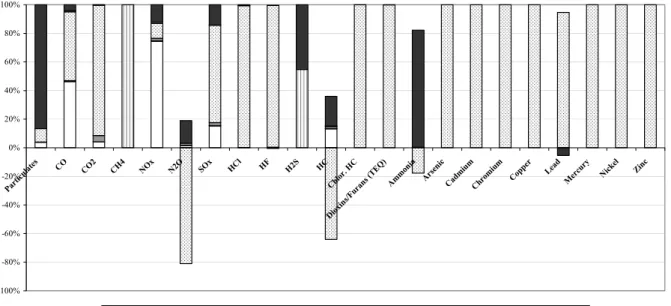
The contribution of each waste management operation to the total emissions of each pollutant was also quantified. For 1990 the operations include: collection, biological treatment, landfilling and recycling savings. For 2000, besides these, also sorting and thermal treatment were considered. Results of air emissions in 1990 are presented in Figure 4 and for water emissions in Figure 5. Figures 6 and 7 present results respectively for air and water emissions for 2000. For each pollutant the contribution of each operation is expressed as percentage of the total presented on previous figures (Figures 3 and 4). In these plots, negative values for a certain operation represent avoided emissions from energy or materials recovery except for recycling savings for which a negative value represents an increase in the emissions amount when comparing recovered with virgin materials.
Results on Figure 2 show the predominancy of CO2 emissions to air followed by CH4, NOx, CO and SOx for both years and also total hydrocarbons (HC) for 1990. For these gases, emissions in 2000 are higher than those in 1990, except for CH4 and HC. The landfilling process is the single source of CH4 emission in 1990 and in 2000 - the decrease from 1990 to 2000 is due to the lower amount of waste disposed in the landfill (see Figures 4 and 6). The HC emissions have a contribution from all the processes involved in both years. In 1990, the main sources are the landfill and the collection process. In 2000 the energy recovered from the thermal treatment and the electricity produced, avoid the emission of a meaningful amount of HC in such a way that the overall balance of HC emissions is negative. All the processes involved in the waste management system in 1990 and in 2000 are sources of the other gases referred, in different amounts.
For CO2, the contribution of the landfill in 1990 and of thermal treatment in 2000 is the most important. The collection operations were the main NOx sources in both years. Also collection is the larger contributor to CO emissions in 1990 but the thermal treatment is also an important source in 2000. For SOx the contribution of collection in 1990 is the most important whereas in 2000 the thermal treatment become the main source.
-100% -80% -60% -40% -20% 0% 20% 40% 60% 80% 100% Parti cula
tes CO CO2 CH4 NOx N2O SOx HCl HF H2S HC Chlor . HC Dioxins /Fur ans (TEQ ) Amm onia Arse nic Cadm ium Chro miu m Coppe r Lead Merc ury Nick el Zinc
COLLECTION BIOLOGICAL TREATMENT LANDFILL RECYCLING SAVINGS
Figure 4. Contribution of MSW management operations to air emissions in 1990 in Porto municipality.
Emissions of HCl, chlorinated HC, HF, Pb, Zn, Cd, Cr, Hg, Cu, Ni and As present meaningful values in 2000, varying from 61.6 kg (Cd, Hg) to 30.7 ton (HCl) but considerably lower than in 1990. For all these pollutants, thermal treatment is the most important or the only source (Cu, Ni, As) in 2000. In 1990 landfill is the major source of HCl and HF emissions with a small contribution from collection and the only source of chlorinated HC. There are no emissions of As, Ni, Cu and Cd, Cr, Hg and Zn are only emitted from the landfill. Note that the low emissions of Pb by the landfill are increased by the contribution of recycling which is the main source of Pb in 1990. This is originated in the glass recycling process that slightly increases the amount of Pb (and HF) emissions when compared with the use of virgin raw materials. From Figure 4, one can see the negative contribution of glass recycling to air emissions in 1990. H2S emissions were lower in 2000 than in 1990: they are originated by the landfilling process and the decrease in 2000 is also due to savings from paper recycling. Concerning Dioxins/furans, the landfill and the incineration processes are the sources of these emissions with the main contribution from thermal treatment in 2000, representing a total higher emission than in 1990.
Emissions of Ammonia, N2O and particulates are below zero and so, not represented in Figure 2. In 1990, ammonia is originated by the composting process. Savings from metals recovered in composting and from recycling of glass separately collected, decreased the amount of ammonia leading to a negative value. In 2000, the low ammonia emissions from sorting and biological treatment were exceeded by the avoidance produced by thermal treatment (electricity production from energy recovered from incineration of composting residual waste and from the incineration of mixed waste) as of recycling savings from: metals recovered in the composting, paper, glass and metals from selective collection and also metals from bottom ashes.
Emissions of N2O were originated in all the processes involved in the waste management system in each year. In 1990 the recycling savings from metals recovered in the composting unit and from glass from selective collection exceeded the emissions from collection and biological treatment, their main sources. In 2000, the electricity produced from energy recovered in the thermal treatment along with the recycling savings from metals recovered from the composting unit, bottom ashes and selective collection lead to a meaningful negative value.
-100% -80% -60% -40% -20% 0% 20% 40% 60% 80% 100% BOD COD Susp ende d So lids Total Org. Com pounds AO X Chlor inat ed HCs Dioxi ns/Fur ans (T EQ) Pheno l Ammon ia Toat al Me tals Arse nic Cadm ium Chro miu m Coppe r Iron Lead Merc ury Nick el Zinc Chlo ride Fluor ide Nitrat e Sulphi de
COLLECTION BIOLOGICAL TREATMENT LANDFILL RECYCLING SAVINGS
Figure 5. Contribution of MSW management operations to water emissions in 1990 in Porto municipality.
Emissions of particulates are also not represented due to the negative values for both years. Besides the contribution of all the processes involved in the waste management system, the dominance is for collection in 1990 and thermal treatment in 2000. However, the recycling savings exceeded these emissions: in 1990 the recycling of metals from the composting unit and from the glass recovered from selective collection and in 2000, the recovery of metals from composting, metals from bottom ashes and paper, metals, plastics and glass from selective collection.
Results in Figure 3 show that emissions for water are higher in 1990 than in 2000 for all pollutants except for phenol that is higher in 2000. The main water pollutants are in 2000 COD, BOD and chloride and in 1990 TOC, ammonia and suspended solids. Note that COD and BOD emissions in 2000 have negative values. The main sources of BOD emissions were the landfill in 1990 and composting in 2000, but the amount emitted from composting is similar in both years (1.03 ton in 1990 and 1.20 ton in 2000). All the waste management operations contribute to this pollutant in both years. Also COD emissions have a contribution from all the operations with the major sources being the landfill in 1990 and composting in 2000. However, in 2000, the recycling savings from recovered materials exceeded the emitted values of BOD and COD leading to negative overall values. Recovered materials contributing to the decrease in BOD emissions are ferrous metals from composting, bottom ashes and selective collection and paper from selective collection. Recovered materials contributing to the decrease in COD emissions are paper and glass from selective collection. For chloride, also landfilling was the main source followed by collection – all the operations have a small contribution, however, the recycling savings (from paper and plastic from selective collection) in 2000 decreased the total amount of this pollutant. Ammonia is originated in all operations except collection.
The main contributor to ammonia emissions is the landfill followed by composting in 1990 and composting in 2000, where thermal treatment and recycling savings (from ferrous metals from composting, bottom ashes and selective collection and paper from selective collection) reduced the total amount.
-100% -80% -60% -40% -20% 0% 20% 40% 60% 80% 100% Partic ulate s CO CO2 CH4 NOx N2O SOx HCl HF H2S HC Chlo r. HC Diox ins/Fu rans (TEQ ) Ammon ia Arse nic Cadm ium Chr omiu m Coppe r Lead Mercu ry Nick el Zinc
COLLECTION SORTING BIOLOGICAL TREATMENT THERMAL TREATMENT LANDFILL RECYCLING SAVINGS
Figure 6. Contribution of MSW management operations to air emissions in 2000 in Porto municipality.
All operations also have a contribution to suspended solids emissions: the landfill and collection are the main sources in 1990 with an increase of the contribution of collection in 2000 where recycling savings (from ferrous metals recovered from composting, bottom ashes and selective collection) and thermal treatment, decrease the overall value of this emission. Also landfilling and collection are the main sources of Total metals (that has the contribution of all the operations) with the predominance of landfilling in 1990 and of collection in 2000. Collection is the main source for TOC emissions (among all the other operations) with a meaningful contribution to its decrease from thermal treatment in 2000 and from recycling savings in both years, but higher in 2000 due to glass from selective collection and metals from composting in 1990 and from paper and glass from selective collection in 2000. All the operations except collection contribute to Fe emissions and landfilling is its main source with a small negative contribution from thermal treatment in 2000. Also for Fluoride, all the operations contributed to its emissions but collection is the main source in both years with a decrease caused by recycling savings in 1990 (metals from composting) and by thermal treatment and also recycling savings in 2000 (metals from composting, bottom ashes and selective collection and paper from selective collection), leading to a negative value in 2000. AOX is only produced in landfills and its emissions in 2000 were exceeded by the recycling savings of paper from selective collection. Landfill is also the unique source of chlorinated HC, Zn, Ni, Cr, Cu, As, Cd, Hg and Dioxins/furans in both years. Also Pb is only emitted by the landfill but this emission is exceeded by recycling savings of metals from selective collection in 2000. Nitrate emissions are originated in the composting process in 1990 but in 2000 there was also a small contribution from sorting. However, on that year, the recovery of energy from thermal treatment reduced them to a negative value. In 2000, recycling savings (from ferrous metals recovered from composting, from bottom ashes and from selective collection) have a negative contribution to nitrate emissions slightly increasing the total overall emissions. For sulphide, emissions are negative in both years: the only contribution came from recycling savings from metals recovered from composting in both years and also from bottom ashes and selective collection along with paper in 2000. -100% -80% -60% -40% -20% 0% 20% 40% 60% 80% 100% BOD COD Suspe nded Solid s Total Org. Com pounds AO X Chlor inate d HCs Dioxin s/Fur ans ( TEQ ) Phen ol Amm onia Toata l Me tals Arse nic Cadm ium Chro miu m Coppe r Iron Lead Merc ury Nicke l Zinc Chlor ide Fluo ride Nitr ate Sulphi de
COLLECTION SORTING BIOLOGICAL TREATMENT THERMAL TREATMENT LANDFILL RECYCLING SAVINGS
4. CONCLUSIONS
Along with changes in collection schemes and treatment/disposal options in the MSW management in Porto city between 1990 and 2000, also environmental burdens changed both in terms of pollutants and their amount. The most important source for each pollutant among the operations involved in the waste management system in each year is also different. The main conclusions from the study are:
• air emissions of CO2, NOx, CO, SOx, HCl, Chlorinated HC, HF, Pb, Zn, Cd, Cr, Hg, Dioxins/furans, Cu, Ni and As, were higher in 2000 than in 1990;
• all emissions to water, except phenol and total organic compounds, were higher in 1990 than in 2000
• the main pollutants to air in 1990 were CO2, CH4, NOx and CO; • the main pollutants to air in 2000 were CO2, CO, SOx, CH4 and NOx;
• the main pollutants to water in 1990 were COD, BOD, chloride and ammonia; • the main pollutants to water in 2000 were TOC, ammonia and suspended solids;
• landfilling was the main source of air and water pollutants in 1990 followed by collection;
• in 1990 landfilling was: (i) the single source of AOX, chlorinated HC, Dioxins/furans, As, Cd, Cr, Cu, Fe, Pb, Hg, Ni and Zn; (ii) the main contributor for BOD, COD, and ammonia along with a small contribution from composting and (iii) the main contributor for SS, total metals and Cl with a small contribution from collection;
• in 2000, thermal treatment was the main source of air pollutants and the landfill the main source of water pollutants;
• collection was the main source for CO, NOx and SOx in air emissions in 1990 and for NOx in 2000;
• collection was the main source for TOC, phenol and fluoride in water emissions in 1990 and for TOC, phenol, total metals and fluoride in 2000;
• biological treatment was the main source for N2O and ammonia in air emissions in 1990; • biological treatment was the only source for nitrate in water emissions in 1990 and the
main source in 2000 for BOD, COD and ammonia;
• recycling savings contribute to decrease the following emissions:
o to air in 1990: particulates, CO, NOx, N2O, SOx, HCl, HC and Ammonia,
o to water in 1990: BOD, COD, suspended solids, TOC, phenol, ammonia, Pb,
fluoride and sulphide,
o to air in 2000: particulates, CO, CO2, NOx, N2O, SOx, HCl, H2S, HC, Ammonia
and Hg,
o to water in 2000: BOD, COD, suspended solids, TOC, AOX, phenol, ammonia,
Pb, chloride, fluoride and sulphide;
• recycling savings have a negative contribution to the following emissions:
o HF and Pb to air in 1990 and in 2000, o nitrate to water in 1990 and in 2000,
• thermal treatment in 2000, due to recovery of energy, contributes to decrease the following emissions:
o to air: N2O, HC and ammonia,
o to water: BOD, COD, suspended solids, TOC, ammonia, Iron, fluoride and
ACKNOWLEDGEMENTS
The authors would like to thank Dr. Fernando Leite, Eng Susana Lopes and Dr. Nuno Barros (from LIPOR and to Eng Goreti and Mr Helder Calado from the Environmental Division of Porto Municipality, for their cooperation on data collection.
REFERENCES
INE (2001) Censos 2001. Instituto Nacional de Estatística.
LIPOR (2000) Cadernos Técnicos Lipor nº 1 – A caracterização dos resíduos sólidos. LIPOR. Xará S. (2002) Compilação de dados de caracterização do sistema de gestão de RSU no
município do Porto em 1990 e 2000 – Fonte: Câmara Municipal do Porto – Departamento de Ambiente. Personal document.
Xará S. (2005) Compilação de dados de caracterização do sistema de gestão de RSU na área de intervenção da LIPOR em 1990 e 2000 – Fonte: LIPOR – Serviço Intermunicipalizado de Tratamento de Lixos da Região do Porto. Personal document.
White P.R., Franke M., Hindle P. (1995) Integrated Solid Waste Management - A life cycle inventory, Blackie A&P, Glasgow, U.K.