UNIVERSIDADE DE LISBOA
FACULDADE DE CIÊNCIAS
DEPARTAMENTO DE BIOLOGIA ANIMAL
The consumption of seafood in Portugal – preferences,
knowledge and public perception
Catarina Pereira Fernandes
Mestrado em Ecologia e Gestão Ambiental
Dissertação orientada por:
Prof. Dr. Henrique Cabral
I
Dedication
I would like to dedicate this work to the most amazing people in the universe. An incredible women and unstoppable fighter, my mum, that even though She is with the most beautiful stars in
the sky, She is always here with me. To my role model and Super Hero, my dad, for always supporting my choices and showing me that sometimes you just have to take the risk, and to dream, and that no matter what, is ok to be wrong and to fail. And to my sister, my little one, for
always having my back and for showing me what a love for life really means. They have a special place in my heart… I am so lucky to have them.
III
Acknowledgments
To Professor Henrique Cabral, my super supervisor, thanks for all the availability, unconditional support, brainstorms, for everything that he taught me and for always believing in me. Without his support and patience any of this would be possible.
To Martim, my boyfriend, a “potatastic” thanks for never leaving my side (even though he is too far away) and for never letting me give up “the fight”. He is essential.
To my dearest friends, the biggest of all the thanks: Leitão, my lab, beer and wine partner. He is unbearable.
Mami, the best home mate and friend anyone could ask for. Unforgettable times. My Ohana. Moutas, 17 years full off awesome moments impossible to describe. She is such an amazing girl.
Tubarão, the craziest friend anyone could ask for. Hope he never loses his awesome energy and bad temper.
Luís, Paulo, David and Gustavo, my gang. My “endless nonsense”. Amazing coffee’s Trox. Mox. Fox. Carol, Ju, João, Bernardo and Laura, we had each other everyday. Good days, rainy days, sunny days, bad days, really bad days. We were like a family. Super Amazing people.
Peps of the pMare room, especially to Inês and Valter, they are amazing grown up’s and adopt me like nobody else.
And last but not least, an enormous thanks to all my family, especially to my sister Mariana and dad João (to infinity and beyond the three Musketeers), for always believing in me and for never, ever questioning my choices.
V
Resumo
Portugal é um dos maiores consumidor de alimentos de origem marinha da Europa e do Mundo. A falta de informação relativa aos hábitos e preferências de consumo, assim como do conhecimento que o consumidor tem sobre as espécies que come e quais os factores chave que influenciam as suas escolhas, desencadearam a elaboração do presente trabalho. Um inquérito por entrevista foi aplicado a duzentos consumidores, em mercados municipais e supermercados em quatro localizações - Lisboa, Sesimbra, Setúbal e Peniche. A população do estudo enumerou um total de cinquenta e nove espécies diferentes como fazendo parte da sua dieta. Uma clara preferência por alimentos de origem marinha resultantes da pesca foi revelada sendo que o carapau, a sardinha, o bacalhau e o polvo são as espécies mais consumidas pelos entrevistados. Os hábitos de consumo apresentados pelos inquiridos são teoricamente sustentáveis, com o consumo de pequenos pelágicos e com um vasto leque de espécies consumidas. No caso das espécies produzidas em aquacultura, as mais consumidas são a dourada e o salmão. Um maior consumo de alimentos de origem marinha resultantes da produção em aquacultura foi reportado por participantes mais novos e por indivíduos com níveis de escolaridade mais elevados. O consumo de alimentos de origem marinha revelou-se independente do rendimento mensal bruto do agregado familiar, com 75% dos indivíduos entrevistados a optar por estes pelo menos uma vez por semana. Em termos de conhecimento sobre as espécies consumidas, preocupantes taxas de desconhecimento foram encontradas. A origem dos alimentos de origem marinha e a sua data de captura, foram eleitas as informações fundamentais a estar presentes nas etiquetas de identificação destes produtos, uma vez que, segundo os inquiridos, permitem que o consumidor tome uma decisão consciente e ponderada. Todavia, o preço dos produtos é aparentemente o derradeiro factor de escolha, sendo o factor decisivo quando o consumidor opta por determinado produto em detrimento de outro.
Palavras-chave: Consumo de alimentos de origem marinha; Pescas; Aquacultura; Preferências do
VII
Abstract
Portugal is one of the major consumers of seafood in Europe and in the World. The lack of information about population preferences and consumption habits, as well has the knowledge the consumer has on the consumed species, and the key factors influencing consumer’s choices, triggered the present work. A survey by interview was applied to two hundred consumers at municipal markets and supermarkets in four locations - Lisbon, Sesimbra, Setúbal and Peniche. A total of fifty-nine different species were reported to be part of the diet of the studied population. A clear preference for seafood from fisheries was denoted, being that the horse mackerel, the sardine, the cod, the hake and the octopus were the most consumed species by the interviewed. The consumption habits revealed by the inquired are theoretically sustainable, with the consumption of small pelagic fish and with a wide variety of seafood species consumed. In terms of the produced species from aquaculture, the most consumed are the sea bream and the salmon. Higher consumption rates of aquaculture products were reported by younger participants and by individuals with higher education levels. The consumption of seafood has shown to be independent of the monthly household income, with 75% of the interviewed individuals reporting opting for these products at least once a week. In terms of the knowledge on the consumed species, concerning rates of lack of knowledge were denoted. The seafood products origin and capture date were elected the crucial information to be included in the identification tags of these products, since that according to the inquired, this information provides the consumer the data necessary to make a conscious and weighted choice. Nevertheless, the products price seems to be the ultimate choice criteria, being decisive when the consumers opt for one product in detriment of another.
Keywords: Seafood consumption; Fisheries; Aquaculture; Consumer’s preferences; Consumer’s
VIII
IX
Resumo alargado
Promover o envolvimento do público na temática da sustentabilidade, assim como educar os cidadãos e encorajar o consumo responsável e saudável dos recursos naturais são formas eficientes de mudar hábitos de consumo e, assim, conservar os recursos naturais. A única forma de se alcançarem tais objetivos é investindo em programas de investigação que irão permitir aos governos e empresas optimizar esforços e definir objetivos, colmatando a existente lacuna de informação. Sem esta informação é impossível esperar um consumo consciente e sustentável dos recursos naturais. É nesta procura por informação que o presente trabalho se desenvolve, uma vez que não existe muito conhecimento sobre os hábitos de consumo dos Portugueses. Dado que Portugal é o maior consumidor de peixe da União Europeia e o terceiro maior do Mundo, é importante tentar perceber hábitos e preferências de consumo desta população. Assim, este trabalho tenta dar resposta a duas perguntas fundamentais; qual o padrão de consumo de produtos alimentares de origem marinha dos Portugueses, e qual o conhecimento dos consumidores sobre estes. Para abordar os consumidores, um inquérito por entrevista foi aplicado. Os consumidores entrevistados foram convidados a responder a questões relativas aos seus hábitos de consumo, conhecimento e experiência como consumidores de produtos de mar. Foram selecionados quatro aglomerados populacionais em Portugal - Lisboa, Setúbal, Peniche, e Sesimbra. O critério para a seleção dos locais de amostragem foi a sua densidade populacional. Em cada uma das localizações as entrevistas tiveram lugar em pelo menos um mercado municipal e um supermercado. O inquérito era dividido em quatro secções: caracterização socioeconómica; hábitos de consumo de alimentos de origem marinha; conhecimento sobre as espécies consumidas e experiência como consumidor. Os dados foram recolhidos entre Novembro de 2016 e Fevereiro de 2017 e duzentos consumidores foram escolhidos aleatoriamente. A primeira secção incluiu questões como o género, idade, estado civil, se vive com crianças, nível de escolaridade máximo, situação de trabalho e rendimento mensal bruto do agregado familiar. Na segunda parte, o consumidor indicou a frequência e os locais de consumo assim como os métodos de confecção que utiliza, quando opta por consumir alimentos de origem marinha. Também nesta parte era pedido ao entrevistado para listar as espécies que consome mais frequentemente assim como a sua frequência de consumo, origem (pesca ou aquacultura), e método de conservação (fresco, congelado, salgado, seco, enlatado ou outro). A terceira parte sobre o conhecimento das espécies consumidas questionava os consumidores relativamente à biologia e ecologia das espécies mais consumidas indicadas na secção anterior. A quarta secção sobre a experiência como consumidor, questionou os inquiridos em relação a sua experiencia pessoal, incluindo qual a sua opinião sobre a informação disponível em diferentes locais de compra e em diferentes produtos, assim como que informação poderia ser adicionada às etiquetas de identificação que permitiria ao consumidor a tomada de decisões mais conscientes e ponderadas. Foi também perguntada a razão principal que faz com que o consumidor opte por produtos de pesca ou de aquacultura, assim como porque não e o que poderia mudar e que faria com que o consumidor optasse mais vezes tanto por um género de produtos como por outro.
Para perceber a distribuição geral dos inquiridos, a análise de dados incluiu estatísticas descritivas. Foram também executadas duas análises de componentes principais para realçar os principais padrões relativos ao consumo de alimentos de origem marinha e os grupos de consumidores e as suas características principais. Num primeiro caso, tendo em conta a origem dos produtos, o método de conservação dos
X
mesmos e características socioeconómicas da amostra, e no segundo caso a frequência de consumo das 7 espécies mais consumidas e características socioeconómicas da amostra, Com o objetivo de avaliar que factores influenciam o consumo das espécies mais importantes, modelos aditivos generalizados foram aplicados.
A população em estudo tinha entre 45 e 65 anos, maioritariamente mulheres, com níveis de escolaridade de secundário ou superior, empregados e com rendimento mensal bruto do agregado familiar de menos de 1500€. Os inquiridos consomem mais frequentemente alimentos de origem marinha em casa ao almoço do que ao jantar, e o mesmo verificou-se no consumo fora de casa. 82% e 61% dos participantes afirmaram consumir alimentos de origem marinha pelo menos uma vez por semana em casa ao almoço e ao jantar, respectivamente. No caso das refeições fora de casa poucos foram os consumidores a optar por estes alimentos.
Os métodos de confecção mais populares foram os grelhados e os cozidos. Já no caso dos assados, fritos, pastéis e fumados, mais de 50% da amostra afirmou consumir produtos confecionados desta forma menos de uma vez por mês.
When the consumer opts for seafood 73% of the times is from fisheries and 10% is from aquaculture. In 17% of the cases the consumer does not know the origin of the products.
Quando o consumir opta por alimentos de origem marinha, 73% das vezes estes são de pescas e 10% de aquacultura. Em 17% dos casos o consumidor não sabe a origem dos produtos que consome.
A população do estudo indicou consumir 59 espécies diferentes de alimentos de origem marinha, 59 de pesca e 9 de aquacultura (9 em comum com as obtidas de pesca), sendo que as espécies consumidas semanalmente resultantes de capturas da pesca comercial foram o carapau (16%), a sardinha (13%), o bacalhau (11%), a pescada (6%) e o polvo (6%). No caso das espécies de aquacultura, as espécies mais consumidas foram a dourada e o salmão.
O método de conservação mais popular são produtos frescos, sendo que os inquiridos optam por produtos conservados desta forma 80% das vezes. Produtos congelados foram selecionados em 9% dos casos, e outros métodos de conservação como conservas, fumados ou salgado/seco, 11% das vezes. A espécie mais consumida salgada/seca foi o bacalhau, sendo comprado desta forma 54% das vezes e fresco 38%. Foi denotada sazonalidade no consumo de sardinha com esta espécie a ser maioritariamente consumida no verão (80% dos casos).
Neste trabalho foram também registadas elevadas taxas de desconhecimento relativamente às espécies mais consumidas tanto de pescas como de aquacultura. A informação disponível em relação aos produtos de mar foi considerada insuficiente por 51% da amostra e suficiente por 32%. O consumidor indicou ter mais informação quando compra produtos embalados e cerca de 50% dos inquiridos disseram não ter mais informação quando compram produtos de mar num supermercado, em comparação com os mercados municipais ou que a informação disponível não varia de um local de compras para o outro. A origem e a data de captura foram apontadas como as informações mais importantes e que deveriam estar presentes nas etiquetas de alimentos de origem marinha, independentemente do seu método de conservação.
XI
No que diz respeito à preferência pelo consumo de alimentos de origem marinha resultantes de pescas, 16% opta por estes produtos porque eles são mais saudáveis, 31% porque que o sabor é melhor, 10% porque são mais naturais e também 10% porque são mais frescos, do que os produtos de produção em aquacultura. A principal razão pela qual 84% dos inquiridos não opta sempre por produtos de pesca é o preço, sendo que 76% disse que se o preço fosse mais baixo consumiria estes produtos mais vezes. Os inquiridos apontaram que para além dos produtos de aquacultura apresentarem pior sabor e textura podem também, devido aos métodos de cultivo, conduzir a problemas para a saúde e para o ambiente. Vinte e sete por cento dos participantes consumiriam mais vezes produtos de aquacultura se os preços fossem mais baixos, e se não houvesse produtos disponíveis de pescas. Apenas 10% demonstrou interesse em produtos de aquacultura se estes fossem mais sustentáveis e mais naturais, e 12% que é a falta de informação adequada que não os faz optar por estes produtos. No caso dos produtos de aquacultura, 65% das vezes em que estes produtos são selecionados é devido ao baixo preço que apresentam.
No caso do consumo de pescada, carapau, salmão, sardinha e dourada, relações entre elementos específicos da caracterização socioeconómica da amostra foram encontrados. No entanto não foi registada uma relação entre o rendimento mensal do agregado e os hábitos de consumo de alimentos de origem marinha.
Revela-se assim prioritária a colmatação das falhas encontradas relativamente ao desconhecimento do consumidor. Os resultados obtidos permitirão às instituições competentes optimizar esforços junto das entidades retalhistas e de venda direta de alimentos de origem marinha e assim melhorar estratégias, munindo o consumidor da informação necessária para que este faça escolhas ponderadas e conscientes.
Palavras-chave: Consumo de alimentos de origem marinha; Pescas; Aquacultura; Preferências do
XIII
Index
Acknowledgments ... III Resumo ... V Abstract ... VII Resumo alargado ... IX List of figures ... XV List of tables ... XVII 1 General introduction ... 1 References ... 32 The consumption of seafood in Portugal – preferences, knowledge and public perception………..5
2.1 Introduction ... 7 2.2 Methods ... 9 2.3 Results ... 13 2.4 Discussion ... 21 2.5 References ... 25 3 Final considerations ... 29 Appendices ... 31
XIV
XV
List of figures
Figure 2.4.1. Relative frequency of consumption of seafood, at different meals and places………. 13
Figure 2.4.2. Relative frequency of consumption of seafood, in different preparation methods...….. 14
Figure 2.4.3. Diagram of the first two axes of the principal components analysis performed to
consumption frequency of seafood, from aquaculture and fisheries relative to product’s conservation methods (Variance explained by the first two axes – Comp.1= 74.6%; Comp.2= 12.4%); Variables: FishChil= Chilled seafood from fisheries; FishFroz= Frozen seafood from fisheries; FishCan= Canned seafood from fisheries; FishDry= Soaked seafood from fisheries; AquaChil= Chilled seafood from aquaculture; AquaFroz= Frozen seafood from aquaculture.…………..…………...………... 16
Figure 2.4.4. Diagram of the first two axes of the principal components analysis performed to
consumption data of seafood, relative to the seven most consumed species, from fisheries and aquaculture. (Variance explained by the first two axes – Comp.1= 24.6%; Comp.2= 16.5%) – Variables: Horse mackerel; Sardine; Cod; Hake; Octopus; Sea bream; Salmon. ………... 17
Figure 2.4.5. A: Frequency of consumption of horse mackerel and education level – Variables: 1=
Primary or less (SD= 28.4466145); 2= from 5th to 9th grade (SD= 24.50747985); 3= High school (SD= 24.21957052); 4= Higher (SD= 16.46963536); B: Frequency of consumption of horse mackerel and age – Variables: 1= < 25 years (SD= 17.88357409); 2= 25 to 45 years (SD= 21.19304285); 3= 46 to 65 years (SD= 26.32579533); 4= > 65 years (SD= 24.15877693)...……...….……….…… 18
Figure 2.4.6. Frequency of consumption of sardine and age – Variables: 1= < 25 years (SD=
6.617821058); 2= 25 to 45 years (SD=18.37792742); 3= 46 to 65 years (SD= 22.64963783); 4= > 65 years (SD= 26.58858291)………... 19
Figure 2.4.7. A: Frequency of consumption of hake and education level – Variables: 1= Primary or less
(SD= 18.91182921); 2= from 5th to 9th grade (SD= 19.56928701); 3= High school (SD= 21.63711581); 4= Higher (SD= 19.32862012); B: Frequency of consumption of hake and marital status – Variables: 1= Single (SD= 21.79980633); 2= Married or living together (SD= 18.82434241); 3=Divorced or widower (SD= 21.23016722)………...……….. 19
Figure 2.4.8. A: Frequency of consumption of sea bream and education level – Variables: 1= Primary or
less (SD= 15.48708741); 2= from 5th to 9th grade (SD= 16.94782022); 3= High school (SD= 21.69662008); 4= Higher (SD= 19.68135045); B: Frequency of consumption of sea bream and marital status – Variables: 1= Single (SD= 14.58157132); 2= Married or living together (SD= 16.69421425);
3=Divorced or widower (SD= 19.90671997)……….. 19 Figure 2.4.9. A: Frequency of consumption of salmon and education level – Variables: 1= Primary or less
(SD= 15.44110276); 2= from 5th to 9th grade (SD= 17.72461747); 3=High school (SD= 19.43558501); 4= Higher (SD= 22.46023647); B: Frequency of consumption of salmon and age – Variables: 1= < 25 years
XVI
(SD= 14.15093244); 2= 25 to 45 years (SD= 20.26565542); 3= 46 to 65 years (SD= 20.99708313); 4= > 65 years (SD= 16.54369251)……….……... 20
XVII
List of tables
Table 2.4.1. Socio-economic characteristics of respondents………..……..……….. 13
Table 2.4.2. Main results of the GAMs fitted to each of the main species consumed, with indication of
significant variables, test statistics (F values and p-values) and percentage of total deviance explained (% Explained)……….... 18
1
1
General introduction
One billion people on the planet are officially designated as starving (FAO, 2010) and more than the double present unsuited diets (Barret, 2010). Over the last 50 years, changes in agriculture have increased world’s capability of providing food and cope with human population’s growing needs (Kearney, 2010). The most important food source in the world is cereals, although is expected that the cereals for food use will continually decline throughout the years (Alexandratos, 2006). In developed countries, meat is an important part of the daily diet, being that meat products (e.g. sausages and burgers) represent nearly 50% of all the consumed meat in these countries (Kearney, 2010). Certainly, agriculture will make the greatest input to the huge task that is and will be to feed the world’s population, but fisheries and aquaculture can also make an important and relevant contribution (Frid & Paramor, 2012).
In the 1950’s, fisheries were at a time of extreme growth all over the world, and in the following decades the catches increased, as a result of the global fishing effort and as an attempt to cope the increasing fish demand. In 1996, marine fisheries worldwide reached a production peak of 86.4 million tonnes, and since reveal a general stagnation trend (FAO, 2016b). The uncontrolled increasing number of boats and catches began to reveal real impacts in the wild stocks. For example, in 1971-72, the Peruvian anchoveta stock collapsed as the result of what seems to be the extremely negative combination of an El Niño event and overfishing. The depreciation of this event, among others, lead to fisheries management policies and models that proved to be inadequate and insufficient to maintain fisheries resources in a good status (Myers et al., 1997; Roberts et al., 2001, Watson & Pauly, 2001, Watson et al., 2011). From 1974 to 2013, the share of fish stocks within sustainable levels decreased from 90% to 69%, and of all stocks acceded in 2013, 11% were under fished and 58% were fully fished (FAO, 2011). Also, from 1974 to 2013, the percentage of stocks fished at biologically unsustainable levels increased from 10% to 31% (FAO, 2011). Regardless of this generalized overexploitation scenario of seafood resources in the last decades, a substantial increase of seafood consumption at the global level was registered, from less than 10 kg per person per year, in 1960, to more than 20 kg per person per year, in recent years (FAO, 2016b), being expected that this increasing trend will continue until 2050 (Kearney, 2010). The main responsible for this increasing availability of fish for human consumption is aquaculture, which was propelled due the stagnation of fishery production since the late 1980s. Aquaculture provisions of fish for human consumption increased 26% in 20 years, from 1974 to 1994, and 39% until 2004. In 2014, and for the first time, aquaculture represented a higher input of fish, in terms of food supply, than capture fisheries (FAO, 2016b). A group of 35 countries, including five major aquaculture producers, as China, India, Vietnam, Bangladesh and Egypt, and representing 45% of the world population, produced more farmed fish than wild-caught fish, in 2014. The major role in this growth is played by China, since it represents more than 60% of aquaculture production worldwide. The combined production of world’s aquaculture production of fish and plants represented a total of 5.6 billion USD (FAO, 2016b).
This trend in seafood consumption became widespread, although estimates are profoundly different according geographical region (FAO, 2016b). Portugal is one of the countries with the highest seafood consumption (per capita) in the world, often ranked at the third place (FAO, 2016b), with fish proteins
2
representing about 13% of the population’s diet (FAO, 2016a). From 1961 to 1964, fishery landings in Portugal increased from 502 000 tonnes to 578 000 tonnes, when they start declining, even though some peaks were documented (Bjørndal et al., 2013). In terms of country’s aquaculture, in 2015, represented a total of ca. 9 561 tonnes, with a value 54.1 million EUR, being bivalve molluscs 55% of the production (INE I. P., 2017). In Portugal, 63% of the consumed fish is from importations, 35% from domestic wild fisheries and only 2% from domestic aquaculture (WWF Mediterranean, 2017).
To promote the public engagement with sustainability issues as well as to educate citizens and to encourage a healthy and conscious consumption of natural resources are the most effective solutions to change consumption habits and so, to conserve our natural stocks. The only way to achieve such targets is to invest in research programs that will allow the governments and companies to optimize efforts and enable the outlining of objectives that will fill the existing information gaps and supress consumer’s need for information. Without this information is impossible to expect a conscious and responsible consumption of the natural resources. The design and optimization of educational programs is a critical part of environmental education, which needs to be introduced in early ages to be reflected in responsible and environmental concerned adults in the future.
The present work analysed the seafood consumption patterns and consumer’s knowledge on fisheries and aquaculture resources in order to point out the major aspects that need future research and/or management measures towards a more sustainable consumption of marine resources.
3
References
Alexandratos, N., Bruinsma J., Bödeker, G., Schmidhuber, J., Broca, S., Shetty, P. & Ottaviani, M. G. (2006). World Agriculture: towards 2030/50, Interim report. Prospects for food, nutrition, agriculture and major commodity groups. Rome: Food and Agriculture Organization of the United Nations.
Barret, C. B. (2010). Measuring food security. Science, 327, 825-828.
Bjørndal, T., Lappo, A., & Ramos, J. (2013). An Economic Analysis of the Portuguese Fisheries Sector 1960-2011. Institute for Research in Economics and Business Administration. Bergen: SNF.
FAO. (2010). The State of Food Insecurity in the World. Rome: Food and Agriculture of the United Nations.
FAO. (2011). Review of the state of world marine fishery resources. FAO Fisheries and Aquaculture Technical Paper No. 569. Rome: Food and Agriculture of the United Nations.
FAO. (2016a). Fishery and Aquaculture Statistics 2014. FAO yearbook. Rome: Food and Agriculture of the United Nations.
FAO. (2016b). The State of World Fisheries and Aquaculture 2016. Contributing to food security and nutrition for all. Rome: Food and Agriculture of the United Nations.
Frid, C. L., & Paramor, O. A. (2012). Food for Thought - Feeding the world: what role for fisheries? ICES Journal of Marine Science, 69, 145-150.
INE, I. P. (2017). Estatísticas da Pesca 2016. Lisboa, Portugal.
Kearney, J. (2010). Food consumption trends and drivers. Philosophical Transactions of the Royal Society
B, 365, 2793-2807.
Myers, R. A., Hutchings, J. A., & Barrowman, N. J. (1997). Why do fish stocks collapse? The example of cod in Atlantic Canada. Ecological Apllications, 7, 91-106.
Roberts, C. M., Bohnsack, J. A., Gell, F., Hawkins, J. P., & Goodridge, R. (2001). Effects of Marine Reserves on Adjacent Fisheries. Science, 294, 1920-1923.
Watson, R., Sumaila, R. U., & Zeller, D. (2011). How much fish is being extracted from the oceans and what is it worth? In Christensen, V & MacLean, J., Ecosystem Approaches to Fisheries: A Global Perspective (pp. 55-71). Cambridge, Cambridge: Cambridge University Press.
Watson, R., & Pauly, D. (2001). Systematic distortions in world fisheries catch trends. Nature, 414, 534-536.
WWF Mediterranean. (2017). Seafood and the Mediterranean: local tastes, global markets. Galnd, Switzerland: WWF - World Wide Fund For Nature.
5
2 The consumption of seafood in Portugal – preferences,
knowledge and public perception
6
7
2.1 Introduction
With the continuous growth of Earth’s population, we are and will be facing one of the major challenges of our time, trying to supress the increasing food needs (Davis et al., 2016). The rising demand for seafood (Delgado et al., 2003) is explained by the fact there is evidence of health benefits on the consumption of these products. The increasing supply of seafood combined with an overall increased wellness, has consequences on food and dietary preferences (FAO/WHO, 2010; Afonso et al., 2013). In 2014, the world per capita fish supply toped a new maximum of 20 kg, only possible due to an impressive growth of aquaculture (FAO, 2016; Pauly et al., 2002). In fact, in 2014, more than 50% of the fish for human consumption traded worldwide came from aquaculture (FAO, 2016; Natale et al., 2013). Since 2009, aquaculture production increased 15%, and the fisheries production less than 5%, such differences can be explained by the fact that more than 80% of fish stocks are overfished or fully fished (FAO, 2016). Some studies showed that farmed fish do not present a hazard for human consumption in fact it contains nearly all essential elements at adequate concentrations to suit the dietary reference intake (Smith et al., 2005; Mok et al., 2012). Also, several authors have expressed concern regarding the ecological quality of most of the aquatic systems where fisheries and aquaculture collect or produce organisms, and highlighted the problems relative to contamination, and often bioaccumulation and bioamplification, which contribute significantly to the dietary exposure to some chemical contaminants, reducing the health benefits and introducing some new and unknown health complications (Francesconi, 2007; Liu et al., 2017). In this context, consumer’s knowledge and choices are of extreme relevance for two different perspectives: wise selection of seafood items in order to have a healthy and safe diet and a consumption pattern that acting at a social and economic level may mitigate some of the environmental problems recognized both to fisheries and aquaculture. The understanding of consumption trends and habits is crucial to develop and implement a sustainable and efficient fish supply management program.
The factors influencing seafood consumption can be related to intrinsic characteristics of the product, such as the taste, texture, smell, presentation, conservation method, country of origin or the collection method (fisheries or aquaculture), but also with cultural and heritage factors, related to demographic and personal characteristics of the consumers. Some studies relate seafood consumption with cultural values (Garrido, 2010), and others do not, with 88% of the respondents stating not purchasing seafood for cultural or religious reasons, and electing the price as one of the most important factors when it comes to making a choice (Murray et al., 2017). Nonetheless, in a study carried out in Columbia, Canada, the factor influencing the consumer’s decision was related to attributes of the product itself, with 70% of the respondents stating eating seafood for health benefits (Murray et al., 2017). Some studies show different perceptions when comparing fishery or aquaculture products, as a study carried in Spain where participants perceived clear differences between farmed and wild fish, with the last one’s considered to be fresher, healthier and more natural (Claret et al., 2014). Other studies show evident regional differences in consumption rates and discovered a relation between household income and seafood consumption frequency, with low-income respondents reporting higher consumption of seafood (Stackelberg et al., 2017).
8
Portugal is the third biggest seafood consumer (per capita) in the world, considering all the develop countries, and one of the greatest among European countries, with an annual average of consumption of 60kg of fish, per capita (Laurenti, 2010; Vanhonacker et al., 2013a; Vardakoulias & Bernick, 2016). In Portugal, only 2% of the consumed fish is from domestic aquaculture, being that domestic wild fisheries represent 35% and importations 63%, of the consumed fish in the country (WWF Mediterranean, 2017). Portugal is part of the group of Southern European countries that expect the most information on seafood labels, and that show higher levels of knowledge about fish. Also, those countries reported higher fish consumption frequencies, with more than 70% of the Portuguese stating eating seafood more than once a week (Pieniak et al., 2013). Other studies show that the Portuguese consumers have a clear preference for wild to cultured fish, as well as fat to lean fish, and for chilled fish, over all the other conservation method (frozen, canned, smoked and soaked). The most consumed products by the Portuguese are soaked cod, canned tuna and hake (Cardoso et al., 2013). Consumption differences between men and women were also evidenced, with men preferring cephalopods and sardines and women opting for hake, redfish and pink cusk-eel. Also geographic differences were determined, with coastal populations preferring wild fish (Cardoso et al., 2013).
It is particularly important to evaluate the consumer’s patterns and knowledge on seafood in order to develop strategies to create awareness and change consumer behaviours towards a more sustainable exploitation of marine living resources. In this study, we characterised consumer’s preferences and habits on seafood from fisheries and aquaculture, assessed consumer’s knowledge on the seafood products he consumes and the main factors influencing his seafood options.
9
2.2 Methods
To approach consumers, a survey by interview was conducted (Appendix 1). Interviewed consumers were asked to answer questions regarding their consumption habits, knowledge and experience as consumers of seafood. Four locations in Portugal were chosen, Lisbon (N38°43'20.109;W9°8'21.611); Setúbal (N38°31'26.736;W8°53'33.315); Peniche (N39°21'37.185;W9°23'15.439); and Sesimbra (N38°26'40.083; W9°6'7.228). The criterion for the selection of the sampling locations was the population density, being that Lisbon and Setúbal have more than 500 people/km2, while Peniche and Sesimbra have less than 350 people/km2 (INE, 2016). In each location, the interviews took place in at least one municipal market and one supermarket.
The questionnaire was divided into four sections: socio-economic characterization; seafood consumption habits; knowledge on the consumed species; and consumer experience. The respondents were informed before starting, that completing the interview was estimated to take around ten minutes. The data were collected from the 26th of November 2016 to the 14th of February 2017, and 200 respondents were randomly selected.
The first part contained questions regarding socio-economic characteristics such as gender (“female”, “male”); age (“less than 25 years”, “25 to 45 years”, “45 to 65 years”, “more than 65 years”); marital status (“single”, “married or living together”, “divorced or widower”); living without children (“yes”, “no”); highest education level (“primary or less”, “from 5th to 9th grade”, “high school”, “higher”); working situation (“employed”, “retired”, “other”); and monthly household income (“less than 557€”, “558€ to 1500€”, “1501€ to 2500€”, “more than 2501€” “does not know/does not answer”).
The second section about seafood consumption habits was self reported on a 7-point scale and the possible answers were: “everyday”, “1 to 3 times a week”, “4 to 6 times a week”, “only at weekends/holidays”, “once every 2 weeks”, “once a month” and “more rarely/never”. The respondents were asked for frequency of consumption of seafood both home and out of home at lunch and dinnertime, as well as the confectionery methods used (“boiled”, “grilled”, “fried”, “baked”, “pastry”, “canned”, “smoked”). Also in this section, the interviewed consumers were asked to list the species they consume more often, and what is their minimum consumption frequency of those, in an open-end question. To data analysis the answers were categorized in days being: that “everyday” = 365 days; “once a week (summer)” = 13 days; “everyday (summer)” = 94 days; “once every 3 months” = 4 days; “once every 3 weeks” = 17 days; “once every 15 days (summer)” = 6 days; “once every 2 months” = 6 days and “once every 15 days (winter)” = 6 days”. Also about these species the products origin (fisheries or aquaculture) and conservation method (chilled, frozen, soaked, canned or other) was asked. In terms of the products origin and conservation method, to data analyse the following categories were established: chilled seafood from fisheries; frozen seafood from fisheries; canned seafood from fisheries; soaked seafood from fisheries; chilled seafood from aquaculture; and frozen seafood from aquaculture.
The third part about knowledge on the consumed species, queried the consumers about the biology and ecology of the most consumed species listed in the second section. The question differed depending on the products origin stated in section two. When the origin was fisheries, the questions were: if it lives in the Portuguese shore (“yes”, “no”, “do not know”); the marine area the specie habits (“river or estuary”,
10
“coastal area: up to 50 meters deep”, “continental shelf: from 50 to 200 meters deep”, “open sea”, “do not know”); the reproductive age (“1 to 3 months”, “4 to 6 months”, “7 to 12 months”, “13 to 18 months”, “2 or more years”, “do not know”); the fishing age (“1 to 3 months”, “4 to 6 months”, “7 to 12 months”, “13 to 18 months”, “2 or more years”, “do not know”); species alimentation (“other marine animals”, “seaweed”, “organic residues of the sea bed”, “do not know”) and if the natural stocks are in good condition (“yes”, “no”, “do not know”). When the origin was aquaculture, the questions were: the origin (“Portugal”, “rest of Europe”, “Asia”, “Africa”, “America”, “Oceania”, “do not know”); farming environment (“onshore”, “on estuaries”, offshore”, “do not know”); production time (“1 to 3 months”, “4 to 6 months”, “7 to 12 months”, “13 to 18 months”, “2 or more years”, “do not know”) and alimentation (“other marine animals”, “seaweed”, “fish feed”, “do not know”). The objective knowledge was rate with true, false or does not know. For this correction specific literature (WoRMS, 2017; IUCN, 2017; Froese & Pauly, 2017; Gallagher et al., 2006), as well as some MARE specialists, were consulted. When in section two, more than four species from fisheries or aquaculture were listed, a maximum of four from each origin were randomly selected to answer the questions above.
The fourth section about consumers experience, asked the interviewed about their personal experience with the following questions: if the available information on seafood is sufficient (“yes”, “sometimes”, “no”); if the available information is greater when the product is packed (“yes”, “no”, “do not know”); if seafood at supermarkets have more information that at municipal markets (“yes”, “no”, “do not know”); and, has an open question, what additional information could be added to seafood labels that would enable the consumer a more weighted choice. This open-end answer was categorized in “capture date”, “expiration date” and “other”. Also as open questions, was asked: the main reason the consumer opts for these products; why he does not; and what could change that made them consume these products more often. These questions were asked for both fisheries and aquaculture products. In the case of fisheries the open-end answers to why the consumer opt for this products were categorized in “healthier”, “fresher”, “higher quality”, “better flavour”, “better texture”, “more natural”, “lower price”, and “tradition”; why he does not the only given answer was “higher price”; and the reasons that lead them to consume more in “lower price”, “more and better information”, “wider offer”. In the case of the aquaculture products, the answers to why the consumers opt for these products were categorized in “lower price” and “offer”; why not in “alimentation used in aquaculture production”, “worse flavour” and “worse texture”; and the reasons that lead them to consume more in “lower price”, “no offer from fisheries”, “more and better information” and “eco-friendly or sustainable aquaculture production”.
To understand the overall distribution of respondents, the data analyses included descriptive statistics (as gender, age, working situation, living with children, monthly household income, education level and marital status). Two Principal Components Analysis were performed to outline the main patterns relative to seafood consumption, identifying the clusters of consumers and its main characteristics. The first analysis took into account the conservation method, product’s origin, and socio-economic characterization of the sample and on the second analysis, the dominant species and socio-economic characterization of the sample. In order to evaluate which factors influence consumption of the most important seafood items Generalized Additive Models (GAM) were performed. GAM was chosen due to lack of normality of most of the error distributions and also due to the lack of linear relationships between the response variables and predictors. All statistical analyses were performed in R (R Core Team, 2017) and a significance level of 0.05 was considered for all test procedures. The independent variables used in GAM were the gender, age,
11
marital status, living with children, highest education level and monthly household income. Qualitative variables were included in these models as dummy variables (using binary coding). GAM were fitted for the most consumed species: horse mackerel, sardines, cod, hake, octopus (from fisheries) and sea bream and salmon (from aquaculture).
13
2.3 Results
Respondents were mainly between 46 to 65 years old, mostly women, with education levels of high school or higher, employed, with monthly household income of less than 1500€ (Table 2.4.1). More than 62% of the respondents were married or living together, being that almost 70% lived without children.
Table 2.4.1. Socio-economic characteristics of the respondents.
People ate more frequently seafood at home for lunch than for dinner, and the same appended when eating out of home. Eighty-two and sixty-one per cent of the respondents reported eating seafood at home at least once a week, at lunch and dinnertime, respectively. In the case of seafood consumption out of home fewer were the consumers opting for these products, being that 60% of the respondents opt for these less than once a month at lunchtime and 74% at dinnertime (Figure 2.4.1).
Figure 2.4.1. Relative frequency of consumption of seafood, at different meals and places.
0% 10% 20% 30% 40% 50% 60% 70% 80% 90% 100% Lunch at
home Lunch out of home Dinner at home Dinner out of home
More rarely/never Once a month Once every 2 weeks Only at weekends/holidays 4 to 6 times a week 1 to 3 times a week Everyday
Characteristic Survey (%) Characteristic Survey (%)
Gender Highest education level
Female 68.8 Primary or less 22.6
Male 31.2 From 5th to 9th grade 23.6
High school 23.6
Age Higher 30.2
Less than 25 years 7.5
25 to 45 years 29.2 Working situation
46 to 65 years 40.2 Employed 51.4
More than 65 years 23.1 Retired 26.1
Other 22.5
Marital status
Single 18.6 Monthly household income
Married or living together 62.9 Less than 557€ 11.6 Divorced or widower 18.5 558€ to 1500€ 44.2
1501€ to 2500€ 20.6
More than 2501€ 16.6
14
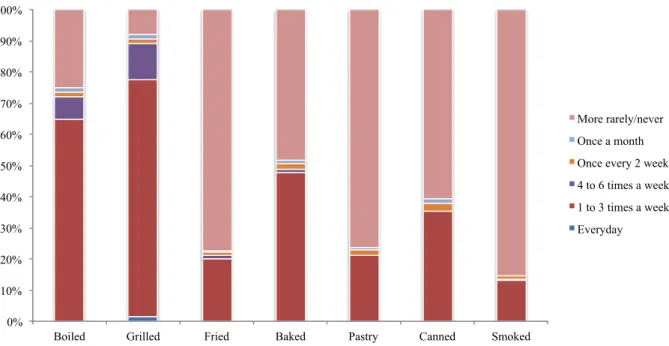
The most popular reported preparation methods of seafood were grilled and boiled, with 76% and 65% of the study population opting for this preparation methods 1 to 3 times a week, respectively. In the case of canned seafood, 49% of the sample stated opting for these products monthly of less. Baked, pastry, fried and smoked were the least common ways to cook seafood, with more than 50% of the respondents reporting opting for these less than once a month (Figure 2.4.2).
0% 10% 20% 30% 40% 50% 60% 70% 80% 90% 100%
Boiled Grilled Fried Baked Pastry Canned Smoked
More rarely/never Once a month Once every 2 weeks 4 to 6 times a week 1 to 3 times a week Everyday
Figure 2.4.2. Relative frequency of consumption of seafood, in different preparation methods.
When the consumer opts for seafood 73% of the times is from fisheries and 10% is from aquaculture. In 17% of the cases the consumer does not know the origin of the products.
The study population reported eating a total of 59 different seafood species, 59 from fisheries and 9 from aquaculture (9 in common with those obtained from fisheries) (Appendix 2). The horse mackerel, sardines, cod, hake and octopus were the most consumed species from fisheries with a weekly consumption of 16%, 13%, 11%, 6% and 6%, respectively. In the case of the seafood from aquaculture, the most consumed species were the sea bream and the salmon, being that 59% of the times when the respondents opt for aquaculture products select those two.
The most popular conservation method is chilled seafood with the study population opting for these products 80% of the times. Frozen products are selected in 9% of the cases and other conservation methods, as canned, smoked or soaked, 11%. The most consumed soaked specie is the cod, been purchased this way 54% of the times and chilled in 38% of the cases. Seasonality was denoted in the consumption of sardines with this specie being consumed at summertime in 80% of the cases.
Regarding the consumer’s knowledge of the consumed species from fisheries, 29% of the answers were right, 18% were wrong and in 53% of the times the inquired did not knew the answer. In the questions concerning species from aquaculture 20% of the given answers were right, 25% were wrong and 55% the
15
respondent did not knew the answer. The available information on seafood was considered insufficient by 51% of the consumers and sufficient by 32%. Fifty-one per cent of the respondents stated having more information when buying packed seafood than when buying chilled products. Comparing the available information at a supermarket or at a municipal market, about 50% of the respondents said that the supermarkets do not provide more information or that the quality of the presented information is no different from one shopping place to another. When asked to list important information to be added to the identification tags, 68% pointed the origin (fishing/production zone) of the products and 17% the date of capture.
In what regards consumer’s preference for seafood from fisheries, 16% opt for these products because they are healthier and 31% said they have better flavour than farmed products. Ca. 10% choose these products because they are more natural, and other 10% because they are fresher. The main reason why 84% of the respondents do not always opt for seafood from fisheries is the price, being that 76% said that if the prices were lower they would choose these products more often.
In the case of aquaculture products, the main reason inquired select these products is in 65% of the cases, the lower price they have. Is stated by 50% of the sample that aquaculture products have worse features, with 36% referring that the taste is worse and 14% that the texture is bad. The fish diet in farming facilities is the main reason why 17% of the sample does not opt for these products. It was declared by 27% of the respondents that they would eat more farmed fish if the prices were lower, and by 23% that they would eat these products if no seafood from fisheries was available. Only 10% of the inquired showed interest in farmed products if they where more eco-friendly, more sustainable and more natural, and 12% affirmed that the lack of adequate information is preventing them from opting for these products.
The results from the principal components analyses performed to all seafood items from fisheries and aquaculture, regarding the main conservation methods (Fig. 2.4.3) and to data on the main consumed species (Fig. 2.4.4.) did not show a clear pattern, neither clusters of respondents were clearly evidenced. In Figure 2.4.3, a gradient can be seen along the first axis, reflecting a more intensive consumption of seafood from fisheries, but without highlighting a clear pattern relative to social or economic characteristics of respondents. Along the second axis, some respondents were evidenced, corresponding to the ones with a higher consumption of aquaculture products.
16
Figure 2.4.3. Diagram of the first two axes of the principal components analysis performed to consumption frequency of seafood,
from aquaculture and fisheries relative to product’s conservation methods (Variance explained by the first two axes – Comp.1= 74.6%; Comp.2= 12.4%); Variables: FishChil= Chilled seafood from fisheries; FishFroz= Frozen seafood from fisheries; FishCan= Canned seafood from fisheries; FishDry= Soaked seafood from fisheries; AquaChil= Chilled seafood from aquaculture; AquaFroz= Frozen seafood from aquaculture.
The principal components analysis performed to data on the most consumed species does not put in evidence clusters of respondents. Also in this analysis, it was difficult to interpret these gradients regarding economic and social characteristics of respondents (Fig. 2.4.4).
−0.3 −0.2 −0.1 0.0 0.1 0.2 − 0.3 − 0.2 − 0.1 0.0 0.1 0.2 Comp.1 Comp .2 SM1 SM2 SM3 SM4 SM5 SM6 SM7 SM8 SM9SM10 SM11 SM12 SM13 SM14 SM15 SM16 SM17 SM18 SM19 SM20 SM21 SM22 SM23 SM24 SM25 StM1 StM2 StM3 StM4 StM5 StM6 StM7 StM8 StM9 StM10 StM11 StM12 StM13 StM14 StM15StM16 StM17 StM18 StM19 StM20 StM21 StM22 StM23 StM24 StM25 LM2 LM3 LM4 LM5 LM6 LM7 LM8 LM9 LM10 LM11 LM12 LM13 LM14 LM15 LM16 LM17 LM18 LM19 LM20 LM21LM22 LM23 LM24 LM25 StPD1 StPD2 StPD3 StPD4 StPD5 StPD6 StPD7 StPD8 StPD9 StPD10 StPD11 StPD12 StPD13 StPD14 StPD15 StPD16 StPD17 StPD18 StPD19 StPD20 StPD21 StPD22 StPD23 StPD24 StPD25 SPD1 SPD2 SPD3 SPD4 SPD5 SPD6 SPD7SPD8 SPD9 SPD10 SPD11 SPD12 SPD13 SPD14 SPD15 SPD16 SPD17 SPD18 SPD19 SPD20 SPD21 SPD22 SPD23 SPD24 SPD25 LPD1 LPD2 LPD3 LPD4 LPD5 LPD6 LPD7 LPD8 LPD9 LPD10 LPD11 LPD12 LPD13 LPD14 LPD15 LPD16 LPD17 LPD18 LPD19 LPD20 LPD21 LPD22 LPD23 LPD24 LPD25 PPD1 PPD2 PPD3 PPD4 PPD5 PPD6 PPD7 PPD8 PPD9 PPD10 PPD11 PPD12 PPD13 PPD14 PPD15 PPD16 PPD17 PPD18 PPD19 PPD20PPD21 PPD22 PPD23 PPD24PPD25 PM1 PM2 PM3 PM4 PM5 PM6 PM7 PM8 PM9 PM10 PM11 PM12 PM13 PM14 PM15 PM16 PM17 PM18 PM19 PM20 PM21 PM22 PM23 PM24 PM25 −1000 −500 0 500 1000 − 1000 − 500 0 500 1000 FishChil FishFrozFishCanFishDry
AquaChil AquaFroz
17
Figure 2.4.4. Diagram of the first two axes of the principal components analysis performed to consumption data of seafood,
relative to the seven most consumed species, from fisheries and aquaculture. (Variance explained by the first two axes – Comp.1= 24.6%; Comp.2= 16.5%) – Variables: Horse mackerel; Sardine; Cod; Hake; Octopus; Sea bream; Salmon.
According to GAM, no relation was found between the socio-economic characteristics and the consumption of cod and octopus. Although in the case of the consumption of horse mackerel, sardine, hake, sea bream and salmon relations between specific socio-economic elements and the frequency of consumption of these species were found, fitness of the models were always low (low values of percentage of explained deviance) (Table 2.4.2).
−0.3 −0.2 −0.1 0.0 0.1 − 0.3 − 0.2 − 0.1 0.0 0.1 Comp.1 Comp .2 SM1 SM2 SM3 SM4 SM5 SM6 SM7 SM8 SM9 SM10 SM11 SM12 SM13 SM14 SM15 SM16 SM17 SM18 SM19 SM20 SM21 SM22 SM23 SM24 SM25 StM1 StM2 StM3 StM4 StM5 StM6 StM7 StM8 StM9 StM10 StM11 StM12 StM13 StM14 StM15 StM16 StM17 StM18 StM19 StM20 StM21 StM22 StM23 StM24 StM25 LM2 LM3 LM4 LM5 LM6 LM7 LM8 LM9 LM10 LM11 LM12 LM13 LM14 LM15 LM16 LM17 LM18 LM19 LM20 LM21LM22 LM23 LM24 LM25 StPD1 StPD2 StPD3 StPD4 StPD5 StPD6 StPD7 StPD8 StPD9 StPD10 StPD11 StPD12 StPD13 StPD14 StPD15 StPD16 StPD17 StPD18 StPD19 StPD20 StPD21 StPD22 StPD23 StPD24 StPD25 SPD1 SPD2 SPD3 SPD4 SPD5 SPD6 SPD7 SPD8 SPD9 SPD10 SPD11 SPD12 SPD13 SPD14 SPD15 SPD16 SPD17 SPD18 SPD19 SPD20 SPD21 SPD22 SPD23 SPD24 SPD25 LPD1 LPD2 LPD3 LPD4 LPD5 LPD6 LPD7 LPD8 LPD9 LPD10 LPD11 LPD12 LPD13 LPD14 LPD15 LPD16 LPD17 LPD18 LPD19 LPD20 LPD21 LPD22 LPD23 LPD24 LPD25 PPD1 PPD2 PPD3 PPD4 PPD5 PPD6 PPD7 PPD8 PPD9 PPD10 PPD11 PPD12 PPD13 PPD14 PPD15 PPD16 PPD17 PPD18 PPD19 PPD20 PPD21 PPD22 PPD23 PPD24 PPD25 PM1 PM2 PM3 PM4 PM5 PM6 PM7 PM8 PM9 PM10 PM11 PM12 PM13 PM14 PM15 PM16 PM17 PM18 PM19 PM20 PM21 PM22 PM23 PM24 PM25 −400 −300 −200 −100 0 100 200 − 400 − 300 − 200 − 100 0 100 200 Cod Horse.mackerel Sea.bream Hake Octopus Salmon Sardine
18
Table 2.4.2. Main results of the GAMs fitted to each of the main species consumed, with indication of significant variables, test
statistics (F values and p-values) and percentage of total deviance explained (% Explained).
Species Significant variables % Explained
Education level (F=9.9503; P=0.001867) Age (F= 7.8655; P=0.005557) Sardine Age (F= 4.3185; P= 0.03903) 5.21 Cod None 3.45 Education level (F=5.0407; P=0.02590) Marital status (F=3.9849; P=0.04732) Octopus None 2.7
Education level (F=17.4131; P= 4.554e-05) Marital status (F= 4.4482; P=0.03623) Education level (F=5.0408; P=0.02590) Age (F=7.2491; P= 0.00772) Hake 7.02 Horse Mackerel 10.72 Salmon 9.68 Sea bream 10.85
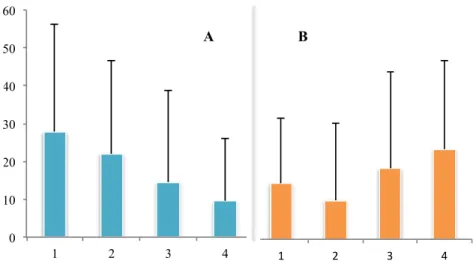
In the case of the consumption of horse mackerel, individuals with lower education degree and older people tend to consume more of this specie (2.4.5).
Figure 2.4.5. A: Frequency of consumption of horse mackerel and education level – Variables: 1= Primary or less (SD=
28.4466145); 2= from 5th to 9th grade (SD= 24.50747985); 3= High school (SD= 24.21957052); 4= Higher (SD= 16.46963536);
B: Frequency of consumption of horse mackerel and age – Variables: 1= < 25 years (SD= 17.88357409); 2= 25 to 45 years (SD=
21.19304285); 3= 46 to 65 years (SD= 26.32579533); 4= > 65 years (SD= 24.15877693).
The major consumers of sardine have more than 65 years old (2.4.6).
0 10 20 30 40 50 60 1 2 3 4 A 0 10 20 30 40 50 60 1 2 3 4 B
19
Figure 2.4.6. Frequency of consumption of sardine and age – Variables: 1= < 25 years (SD= 6.617821058); 2= 25 to 45 years
(SD= 18.37792742); 3= 46 to 65 years (SD= 22.64963783); 4= > 65 years (SD= 26.58858291).
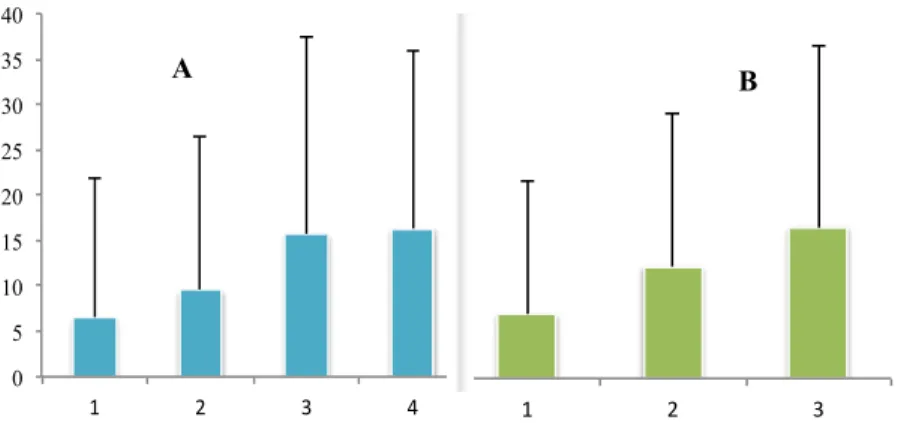
The interviewed who prefer hake, have high school studies or higher and are mostly single (2.4.7).
Figure 2.4.7. A: Frequency of consumption of hake and education level – Variables: 1= Primary or less (SD= 18.91182921); 2=
from 5th to 9th grade (SD= 19.56928701); 3= High school (SD= 21.63711581); 4= Higher (SD=19.32862012); B: Frequency of consumption of hake and marital status – Variables: 1= Single (SD= 21.79980633); 2= Married or living together (SD= 18.82434241); 3= Divorced or widower (SD= 21.23016722).
The greater consumers of sea bream are individuals with at least high school and are mostly divorced or widower (2.4.8).
Figure 2.4.8 A: Frequency of consumption of sea bream and education level – Variables: 1= Primary or less (SD= 15.48708741); 2= from 5th to 9th grade (SD= 16.94782022); 3= High school (SD= 21.69662008); 4= Higher (SD= 19.68135045); B: Frequency
0 5 10 15 20 25 30 35 40 45 1 2 3 4 0 5 10 15 20 25 30 35 40 45 1 2 3 0 5 10 15 20 25 30 35 40 45 1 2 3 4 A B 0 5 10 15 20 25 30 35 40 1 2 3 4 0 5 10 15 20 25 30 35 40 1 2 3 A B
20
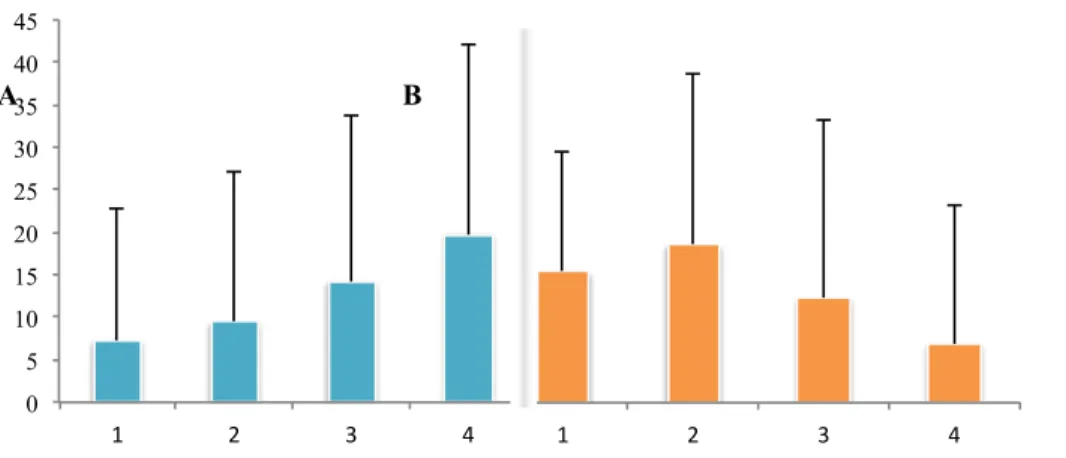
of consumption of sea bream and marital status – Variables: 1= Single (SD= 14.58157132); 2= Married or living together (SD= 16.69421425); 3= Divorced or widower (SD= 19.90671997).People with education level higher than high school and participants aged between 25 and 45 years are the one’s consuming farmed salmon more often (2.4.9).
Figure 2.4.9. A: Frequency of consumption of salmon and education level – Variables: 1= Primary or less (SD= 15.44110276); 2= from 5th to 9th grade (SD= 17.72461747); 3= High school (SD= 19.43558501); 4= Higher (SD= 22.46023647); B: Frequency of consumption of salmon and age – Variables: 1= < 25 years (SD= 14.15093244); 2= 25 to 45 years (SD= 20.26565542); 3= 46 to 65 years (SD= 20.99708313); 4= > 65 years (SD= 16.54369251). 0 5 10 15 20 25 30 35 40 45 1 2 3 4 0 5 10 15 20 25 30 35 40 45 1 2 3 4 A B
21
2.4 Discussion
The Portuguese opt for a wide range of seafood species and do not have a fair knowledge about the species they consume. Seafood is mainly consumed at home and usually grilled or boiled. The obtained results show that a significant part of the sampled population consumed seafood at home between 1 to 3 times a week at lunchtime and at dinnertime, being a really high consumption frequency, exceeding the recommended intake of two portions of fish per week (Kris-Etherton et al., 2002). Results also corroborated the findings of Vanhonacker et al. (2013a) in a studie carried in Portugal, that reported that more than 70% of the population ate seafood more than once a week. The high importance of seafood in the Portuguese food habits was already well known, being reflected on the country’s rank worldwide in terms of annual per capita consumption of seafood (Laurenti, 2010; Vanhonacker et al., 2013a; Vardakoulias & Bernick, 2016).
Portuguese mostly consume seafood at home and for lunch, which can be related to the fact that fish is a crucial part of the traditional Mediterranean diet (Vanhonacker et al., 2013a). The abstain showed by the study population about eating seafood out of home, either at lunch or dinner time, might be due to the high costs associated. Grilling and boiling were the preferred way to prepare fish, which in the first case can be related to the importance of small pelagic fish (for example the sardine) in the Portuguese fisheries, (INE, 2016), and in the second place to the convenience of cooking. In addition, the lower consumption of fried seafood might be related to the association of these products with non-healthy lifestyle (Mitterer-Daltoé et al., 2014).
Some consumers reported different frequencies of consumption when asked about the consumption of seafood at different places and meals and the used preparation methods. For example, if you report eating seafood three times a week, it is not possible stating that five times a week you opt for grilled fish. Differences between the consumption of seafood in general and of specific species were also found. This differences between the self-reported and total estimate consumption can be due to underreporting of soaked cod, once it is not usually consumed chilled in the country, requiring different preparation methods or to the fact that it is possible to have seafood as a starter or in a sandwich instead of the main course (Almeida et al., 2015). Anyway, these differences are a usual problem when estimating total consumption frequency, and are a result of individual’s own perceptions.
An outstanding feature of Portuguese seafood habits is the high diversity of consumed species. In this study, a total of fifty-nine species were listed and are probably mostly related to the high social and cultural fishing heritage of the Portuguese as well as to the country’s geographic location by the sea, that urges the multispecies nature of Portuguese fisheries (Vanhonacker et al., 2013b; Stewart et al., 2013; Moreno et al., 2013). In the case of the aquaculture the products available in the Portuguese market are essentially from other countries and the species diversity is very constrained (Fernandes & Cabral, in prep). Additionally, European Mediterranean consumers prefer what they call “local” species (WWF Mediterranean, 2017). The combination of these aspects might justify the reported differences in the variety of consumed species from aquaculture and fisheries. Nevertheless, the misassumptions the consumers have on aquaculture products are disproved by blind tastings that have been carried out. The studies included crustaceans and fish and the evaluating individuals including seafood chefs and ordinary
22
people, could not distinguish the wild from the cultured species (Stickney, 2017).
The most consumed species (horse mackerel, sardines, cod, hake and octopus) do not coincide with some of the previous studies developed in Portugal (Cardoso et al., 2013; Almeida et al 2015). These differences can be explained by the way the survey was constructed. In most of the previous studies, the survey author’s previously selected the species and in contrast, our survey gave total freedom to the respondents to list the species they habitually consume. From the aquaculture products it was expected that more people would consume sea bass and sea bream, once these species are well accepted by the costumers (Vanhonacker et al., 2013a) and are generally available in the Portuguese market (Fernandes & Cabral, in prep). In this study, this fact does not verified, once the mainly consumed species are the sea bream and the salmon. The high consumption rates of salmon reveal its growing production, intense marketing and low market prices for the advertised benefits (Whitmarsh & Palmieri, 2011).
In previous studies conducted in Portugal, chilled and frozen seafood, were reported to have similar contributions to the diet of the Portuguese population (Vanhonacker et al., 2013a). According to the results of the present study, the sampled population showed a clear preference for chilled products. This difference may be explained by the way surveys were conducted. Vanhonacker et al. (2013a) used web-based data collection, which may over represent consumers with specific characteristics, particularly clusters of younger ones, well-educated and higher income residents (Cardoso, et al., 2013; Zhang, et al., 2017). Nonetheless, is important to note that is normal that consumption traditions turn into convenience habits with the emergence of products that are easier and faster to prepare. As showed by Rodgers et al. (2008), Portuguese population shows high preference for soaked cod, with an average consumption of the Portuguese population between 2003 and 2005 of 237.852 Tonnes. Soaked cod is very important in Portugal, being part of countries tradition partly because it was accessible and cheap in the past (Garrido, 2010). To note, that improvements in food supply chains make it possible to have different types of fish available all year round, as in the case of cod.
Seasonality on the consumption of sardines was denoted being preferably consumed at summer time, fact that was already expected since the capture of this species is not allowed from December to April, since they breed throughout the rainy seasons (IPMA, 2017; Froese & Pauly, 2017).
Higher consumption rates of canned tuna were expected considering studies carried out in Portugal (Rodgers, et al., 2008). However, this fact did not verified, probably because of the sampling months. Is expectable that data collections in summer time present higher frequencies of consumption of these products, once canned tuna is mostly used as a convenient seafood product, often used on salads (Almeida et al., 2015), which are many times consumed at summertime.
Taking into account previous studies carried out in Portugal, was predicted that the knowledge about seafood would be higher (Almeida et al., 2015), fact that was disproved, with concerning rates of lack of knowledge. These differences can be explained by the way the survey was conducted, since on-line based surveys end up conditioning the sample, usually over-representing clusters of younger ones, well-educated and higher income residents (Cardoso et al., 2015; Zhang et al., 2017). Also in Almeida et al., 2015 the consumer makes a self-evaluation of his knowledge on seafood when ratting his level of agreement for eg with the sentence: “compared with the average person, I know a lot about fish and other seafood”. There is a clear difference between self-evaluation of knowledge and having the actual knowledge, which is proved