The Price of Music:
How Sonic Logos influence
the Willingness to Pay
Lorenzo Bertagnini
Dissertation written under the supervision of
Prof. Nuno Crispim
Dissertation submitted in partial fulfilment of requirements for the International
MSc in Management, at the Universidade Católica Portuguesa, June 1, 2018.
II
Title: The Price of Music: How Sonic Logos influence the Willingness to Pay Author: Lorenzo Bertagnini
ABSTRACT
Sonic logos are the acoustic equivalents of visual logos and represent a branch of the sonic branding field. As the effects of music on the listener have been explored extensively in both psychology and marketing, this dissertation applies this knowledge on sonic logos to investigate whether they can be taken advantage of in a new business perspective. This research aims to study the correlation between sonic logos and the perceived value (in terms of willingness to pay) of the brand, focusing on the mediation effect of emotional response to and personal perceptions towards the music in the sonic logo. To accomplish this objective, primary data is collected both qualitatively and quantitatively. The qualitative part is composed of in-depth interviews and the quantitative part is in form of an online survey, which includes an experimental design: respondents are randomly divided into two groups, each of which is subjected to one version of a sonic logo of a fictitious brand of coffee and is subsequently asked about their WTP, brand perceptions, emotional response to the music, and personal perceptions towards the music. Results show that sonic logos influence WTP, and that this influence is partially mediated by both emotional response to and personal perceptions towards the music in the sonic logo. Specifically, a sonic logo positively affects WTP if its music is perceived as emotional, melancholic, exciting, interesting, elegant, familiar; however, it negatively affects WTP if its music is perceived as depressing, novel, excessively noisy.
RESUMO
Os sonic logos são os acústicos equivalentes aos logotipos visuais e representam um ramo do campo do sonic branding. Como os efeitos da música no ouvinte têm sido extensivamente explorados em psicologia e marketing, esta dissertação aplica este conhecimento em sonic logos para investigar se eles podem ser aproveitados em uma nova perspectiva de negócios. Esta pesquisa visa estudar a correlação entre os sonic logos e a perceção de valor (em termos de disposição a pagar) da marca, enfocando o efeito de mediação da resposta emocional e percepções pessoais em relação à música no sonic logo. Para atingir este objetivo, os dados primários são recolhidos qualitativamente e quantitativamente. A parte qualitativa é composta de entrevistas extensivas e a parte quantitativa é em forma de uma pesquisa online, que inclui um desenho experimental: os entrevistados são divididos aleatoriamente em dois grupos, cada um dos quais é submetido a uma versão de um sonic logo de uma marca fictícia de café e, em seguida, é questionada sobre sua DDP, percepções da marca, resposta emocional à música e percepções pessoais em relação à música. Os resultados mostram que os sonic logos influenciam a DDP, e que essa influência é parcialmente mediada por respostas emocionais e percepções pessoais em relação à música no sonic logo. Especificamente, um sonic logo afeta positivamente a DDP se sua música for percebida como emocional, melancólica, excitante, interessante, elegante, familiar; no entanto, afeta negativamente a DDP se sua música for percebida como deprimente, nova, excessivamente ruidosa.
Keywords: Sonic Branding, Sonic Logo, Emotional Response to Music, Personal Perceptions
III
ACKNOWLEDGEMENTS
I would like to express my gratitude to my advisor Nuno Crispim for the essential help provided throughout the dissertation and to all faculty members for their unique contribution to my academic growth during the Master.
To Simone, Francisco, Lucas and every friend who contributed in any way to the realization of this project and to the completion of my Master degree. Sorry for being so annoying.
To Carlotta, thanks to whom I did not go crazy over this thesis, and yet drives me little crazier in life.
Un ringraziamento speciale va a tutta la mia famiglia, per l’indispensabile supporto pratico e morale, senza il quale non sarei riuscito a raggiungere questo importante obiettivo.
IV TABLE OF CONTENTS ABSTRACT ... II RESUMO ... II ACKNOWLEDGEMENTS ... III TABLE OF CONTENTS ... IV TABLE OF TABLES ... VI TABLE OF APPENDICES ... VI 1. INTRODUCTION ... 1
1.1 PROBLEM DEFINITION AND RELEVANCE ... 1
1.2 PROBLEM STATEMENT AND RESEARCH QUESTIONS ... 2
1.3 RESEARCH METHODS ... 2
1.4 DISSERTATION OUTLINE ... 3
2. LITERATURE REVIEW ... 4
2.1 SOUND AND MUSIC ... 4
2.2 SONIC BRANDING ... 4
2.3 SONIC LOGO ... 6
2.4 EMOTIONAL RESPONSE TO MUSIC ... 7
2.5 WILLINGNESS TO PAY AND PERCEIVE VALUE ... 9
2.6 SONIC LOGO AND WILLINGNESS TO PAY ... 9
3. METHODOLOGY AND DATA COLLECTION ... 11
3.1 QUALITATIVE RESEARCH METHODOLOGY AND STRUCTURE ... 11
3.2 QUANTITATIVE RESEARCH ... 12
3.2.1 SAMPLING TECHNIQUE ... 13
3.2.2 METHODOLOGY AND STRUCTURE ... 13
3.3 DATA ANALYSIS ... 16
V
4.1 QUALITATIVE MAIN FINDINGS ... 18
4.2 QUANTITATIVE RESULTS’ ANALYSIS ... 20
4.2.1 SAMPLE CHARACTERIZATION ... 20
4.2.2 SCALE RELIABILITY ... 21
4.2.3 PRODUCT CATEGORY INVOLVEMENT ... 21
4.2.4 EFFECT OF MUSIC ... 21
4.2.4.1 EFFECT OF MUSIC ON WTP ... 22
4.2.4.2 EFFECT OF MUSIC ON PURCHASE INTENTION ... 22
4.2.4.3 EFFECT OF MUSIC ON BRAND PERCEPTIONS ... 22
4.2.4.4 EFFECT OF MUSIC ON EMOTIONAL RESPONSE TO MUSIC ... 23
4.2.4.5 EFFECT OF MUSIC ON PERSONAL PERCEPTIONS TOWARDS THE MUSIC ... 24
4.2.5 EFFECT OF BRAND PERCEPTIONS ON WTP ... 25
4.2.6 EFFECT OF EMOTIONAL RESPONSE TO MUSIC ON WTP ... 25
4.2.6.1 PERCEIVED AND FELT EMOTIONS ... 26
4.2.7 EFFECT OF PERSONAL PERCEPTIONS TOWARDS THE MUSIC ON WTP ... 26
4.2.8 OVERALL EFFECT ON WTP ... 26
4.2.9 EMOTIONAL RESPONSE TO MUSIC AS MEDIATOR ... 27
4.2.10 PERSONAL PERCEPTIONS TOWARDS THE MUSIC AS MEDIATOR ... 29
5. CONCLUSIONS ... 31
5.1 MAIN FINDINGS &CONCLUSIONS ... 31
5.2 THEORETICAL AND MANAGERIAL IMPLICATIONS ... 35
5.3 LIMITATIONS AND FUTURE RESEARCH ... 37
APPENDICES ... 39
VI
TABLE OF FIGURES
FIGURE 1:MEDIATION MODEL FOR EMOTIONAL RESPONSE TO MUSIC ... 27
FIGURE 2:MEDIATION EFFECT OF EMOTIONAL RESPONSE TO MUSIC ... 29
FIGURE 3:MEDIATION EFFECT OF PERSONAL PERCEPTIONS TOWARDS MUSIC ... 30
TABLE OF TABLES TABLE 1:MUSIC TECHNICAL CHARACTERISTICS FOR INDUCING EMOTIONAL RESPONSE (BRUNER,1990) ... 8
TABLE 2:SIGNIFICANT BETWEEN-GROUPS DIFFERENCES IN BRAND PERCEPTIONS ... 23
TABLE 3:SIGNIFICANT BETWEEN-GROUPS DIFFERENCES IN EMOTIONAL RESPONSE TO MUSIC 24 TABLE 4:SIGNIFICANT BETWEEN-GROUPS DIFFERENCES IN PERSONAL PERCEPTIONS TOWARDS THE MUSIC ... 25
TABLE OF APPENDICES APPENDIX 1:IN-DEPTH INTERVIEW GUIDELINES ... 39
APPENDIX 2:ONLINE SURVEY ... 40
APPENDIX 3:SAMPLE CHARACTERIZATION... 50
APPENDIX 4:SCALE RELIABILITY ... 51
APPENDIX 5:PRODUCT CATEGORY INVOLVEMENT ... 52
APPENDIX 6:EFFECT OF MUSIC ON WTP; INDEPENDENT SAMPLES T-TEST ... 52
APPENDIX 7:EFFECT OF MUSIC ON PURCHASE INTENTION; INDEPENDENT SAMPLES T-TEST ... 52
APPENDIX 8:EFFECT OF MUSIC ON BRAND PERCEPTIONS; INDEPENDENT SAMPLES T-TEST ... 53
APPENDIX 9:EFFECT OF MUSIC ON EMOTIONAL RESPONSE TO MUSIC; INDEPENDENT SAMPLES T-TEST ... 54
APPENDIX 10:EFFECT OF MUSIC ON PERSONAL PERCEPTIONS TOWARDS MUSIC; INDEPENDENT SAMPLES T-TEST ... 55
APPENDIX 11:EFFECT OF BRAND PERCEPTIONS ON WTP; LINEAR REGRESSION MODEL ... 56
APPENDIX 12:EFFECT OF EMOTIONAL RESPONSE TO MUSIC ON WTP; LINEAR REGRESSION MODEL ... 56
VII
APPENDIX 13:PERCEIVED AND FELT EMOTIONS; PAIRED SAMPLE T-TEST ... 57
APPENDIX 14:EFFECT OF PERSONAL PERCEPTIONS TOWARDS THE MUSIC ON WTP; LINEAR REGRESSION MODEL ... 57 APPENDIX 15:OVERALL EFFECT ON WTP; LINEAR REGRESSION MODEL ... 58 APPENDIX 16:EMOTIONAL RESPONSE TO MUSIC AS MEDIATOR ... 59 APPENDIX 17:PERSONAL PERCEPTIONS TOWARDS THE MUSIC AS MEDIATOR; NON-SIGNIFICANT MEDIATORS ... 59 APPENDIX 18:PERSONAL PERCEPTIONS TOWARDS THE MUSIC AS MEDIATOR; SIGNIFICANT
1
1. INTRODUCTION
1.1 Problem Definition and Relevance
The use of sound and music in marketing has been labelled “sonic branding” (Jackson, 2003) and refers to a broad set of applications, from advertisement to in-store. The academic community has investigated various relationships between sound or music and business-related dimensions such as consumer behaviour, perceptions and attitudes. A specific and less studied area of sonic branding refers to sonic logos, which are the acoustic equivalents of visual logos. Companies have been developing sonic logos since the technology allowed so; however, their design is based mainly on intuition, rather than scientific criteria (Krishnan et al., 2012). Therefore, there is the necessity of exploring and defining objective parameters to build sonic logos judiciously, in order for brands to obtain the desired outcomes in terms of branding strategy. This study gleans knowledge from diverse academic backgrounds such as music, psychology and marketing to investigate potential criteria to be applied to sonic logos and potential effects of sonic logos on branding dimensions. After investigating existing knowledge around the topic, this study has been chosen to focus on whether and how sonic logos can influence consumers’ brand perceptions and what are the potential reasons behind it. Specifically, the research will be measuring the correlation between sonic logos and perceived value of the brand. Even though previous research has suggested the significance of this correlation (Krishnan et al., 2012), this study investigates possible reasons behind it, seeking them in the emotional response to music and in the personal perceptions towards the music. By manipulating certain characteristics of the music in order to evoke different perceived emotions in the listeners (Bruner, 1990), it analyzes the correlation between the perceived emotions induced by the sonic logo and the perceived value (in terms of willingness to pay) of the brand. Moreover, it will measure how personal perceptions towards the music play a role in the correlation. In short, this research investigates the potential effect of sonic logos on brand perceptions and specifically on willingness to pay (WTP) and explores possible explanations of this phenomenon by analyzing the emotional response to the music in the sonic logo and the personal perceptions towards the music in the sonic logo as mediators in the correlation. As mentioned before, the relevance of this study is given by the need for companies to adopt sonic branding strategies, in this case regarding sonic logos, driven by objective criteria and aimed to specific strategic outcomes.
2
1.2 Problem Statement and Research Questions
This research aims to study the correlation between sonic logo and perceived value (in terms of willingness to pay) of the brand, focusing on the mediation effect of emotional response to and personal perceptions towards the music in the sonic logo. The following research questions help structuring the research by dividing the problem statement into specific points, each of which contributes achieving the overall objective of the research.
Research Questions (RQ):
1. Does different music applied to the sonic logo affect the perceived value (willingness to pay) of the brand?
2. Does different music applied to the sonic logo affect brand perceptions?
3. Do different perceived emotions induced by the sonic logo affect the perceived value (willingness to pay) of the brand?
4. Do personal perceptions towards the music of the sonic logo affect the perceived value (willingness to pay) of the brand?
5. Is there a mediation effect of emotional response to music between the sonic logo and the perceived value (willingness to pay) of the brand?
6. Is there a mediation effect of personal perceptions towards the music between the sonic logo and the perceived value (willingness to pay) of the brand?
1.3 Research Methods
In order to answer the research questions, this study takes into account both secondary and primary data. The secondary data collection is the gathering of information from previous research regarding the diverse areas of interest. The primary data collection is composed of two parts and two complementary approaches: a qualitative approach is implemented through in-depth interviews; a quantitative approach is implemented through the development and spread of an online survey. The in-depth interviews provide initial understandings about the correlation studied and useful insights to develop the quantitative research. The online survey gives statistical significance to the results, in order to answer the research questions. The online survey includes an experimental design: respondents are randomly divided into two groups, each of which is subjected to one version of the sonic logo of a fictitious brand of coffee and is subsequently asked about their WTP, brand perceptions, emotional response to the music, and
3 personal perceptions towards the music. The music in the sonic logo represents the only difference between the two groups.
1.4 Dissertation Outline
This dissertation is structured as follows. After this (1) introduction, the next chapter presents the (2) literature review, in which previous research is explored and presented in order to acquire adequate knowledge about the topic. Subsequently, the (3) methodology and data collection chapter presents a detailed description of the research conducted. The results of the research are shown and discussed in the (4) results’ analysis chapter. In the end, the (5) conclusions chapter reports the main findings of the research, as well as its implications, limitations and possible directions for future research.
4
2. LITERATURE REVIEW
This chapter explores relevant literature regarding the main topics considered in this research. Particular attention is given to sound and music, sonic branding, sonic logos, emotional response to music and willingness to pay, gathering the theoretical and practical knowledge that is essential to move forward through the topic of interest.
2.1 Sound and Music
Sound is defined as “Vibrations that travel through the air or another medium and can be heard when they reach a person's or animal's ear” (Oxford Dictionaries). One specific kind of sound is music, which is defined as “Vocal or instrumental sounds (or both) combined in such a way as to produce beauty of form, harmony, and expression of emotion” (Oxford Dictionaries). The very definition of music underlines its ability to create in the listener a broad series of emotional responses (Fulberg, 2003), which are universally perceived (Bouhuys et al., 1995) and are not significantly impacted by individual traits such as age, gender or musical expertise (Robazza et al., 1994). Alongside the conscious interpretation of music’s emotional influence, however, lies the fact that music and sound have also the ability to powerfully influence the listener on the subconscious level (Fulberg, 2003), which can impact the person’s behaviour and decision-making process (for example, North et al., 1999). In short, sound and music have a great potential as means to communicate information (Kramer et al., 2010) that leads to both conscious and subconscious parts of the listener’s brain. The relevance of sound and music as means for communicating has been recognized by marketers, who started to apply it to brands as soon as the technology allowed so.
2.2 Sonic Branding
The use of sound as one of the major brand elements has acquired more than one label in the research during the last decade; in this study, this phenomenon will be called “sonic branding” (Jackson, 2003), as it appears to be the most used and agreed by recent literature. Krishnan et al. (2012) describe sonic branding as the practice of strategically using sound to create auditory brand identity. In recent times, sonic branding has gained strategic relevance for brands (Graakjaer and Jantzen, 2009) as it can represent a source of advantage (or disadvantage), if managed properly (Treasure, 2011). In fact, sonic branding can help develop awareness,
5 association, loyalty and preference in the consumer; moreover, appropriate sound stimuli are able to produce emotional connections with the brand (Wu et al., 2010). An appropriate use of sound is not only a great opportunity for brands; it should be considered an imperative commitment since every sound produces an effect in the consumers. According to Treasure (2011), silence itself must be considered sound as it is experienced as such by consumers; moreover, the potential effect of sound may negatively affect the brand (Wu et al., 2010). For this reason, Companies must develop sonic branding strategies in order to maximize the potential effects of sound on their brands, starting from understanding which advantages it could bring and how these effects can be produced and maximized. Financially speaking, it has been proven that in-store music can affect sales. For example, loud music in a grocery store tends to increase sales per minute, compared to soft music (Smith and Curnow, 1966), and when loud music is played in bars, clients tend to consume a larger amount of beer in less time, compared with a soft background music (Guéguen et al., 2008). Another experiment conducted in a supermarket showed that slow music increases the time spent in the store, positively affecting the overall sales volume, compared to fast music (Milliman, 1982). Accordingly, a similar result has been observed in a restaurant (Milliman, 1986). Other experiments showed how in-store music can temporarily influence food tastes (Crisinel et al., 2012) and wine preference (North et al., 1999). Therefore, it is important for the company to set the desired outcome before designing a sonic branding strategy, since music’s effects largely depend on the circumstance in which it is played (Bode, 2009). These examples of in-store music power might be seen as ethically doubtable as they show how music can coercively manipulate a person’s behaviour (Gustafsson, 2015) and present the potential short-term results of music as environmental input.
Rather than the coercive power of music on consumers, marketers should be interested in potential long-term effects of sound and music on perceptions towards the brand, which eventually lead to financial results. Indeed, as many other brand elements, sound and music have the ability to influence the product perception (Zhu and Meyers-Levy, 2005) and the perceived quality of the brand (Lindström, 2005; Jackson, 2003), eventually leading to brand preference and loyalty (Wu et al., 2010). Even though it is reasonable to imagine that music has effects on consumers, it is not as easy to assess which are the specific variables that have the greatest impact and the best outcome since different stimuli produce different effects on brand perceptions (Wu et al., 2010). Unsurprisingly, an important aspect comes from whether the music matches the audience’s preferences (Simpkins and Smith, 1974); favorable music, in
6 fact, can generate positive attitudes towards the brand (Sung and De Gregorio, 2008) and increase the credibility of the message’s source (Simpkins and Smith, 1974). Moreover, pleasant and original music more easily grabs the attention of the audience and consequently helps the reminiscence of experiences and memories (Fraedrich and King, 1998). Accordingly, Tom (1990) states that original music has a greater effect on consumer’s memory compared to existing songs or parodies. The distinctiveness of the music and its fit with the brand also play a significant role in stimulating consumer’s memory and influencing consumer’s attitudes towards the brand (Wu et al., 2010). Moreover, the perceived fit between the sound and the brand has the power to increase brand loyalty; the misfit, on the contrary, may negatively affect the perceived brand quality (Beverland et al., 2006). In short, these findings represent a starting point about the personal perceptions a sonic branding strategy should try to induce in consumers. The sound or music adopted should be pleasant, distinctive and fit the brand in order to positively affect overall brand perceptions. Existing literature also provides insights on how the sound stimuli should not be. External factors that moderate the consumer response to music and thus have to be taken into account include the consumer’s familiarity with the music (Fontaine and Schwalm, 1979; Hilliard and Tolin, 1979; Russel, 1987), the differences in personal tastes (Gorn, 1982; Wheeler, 1985), the consumer’s previous mood (Goldberg and Gorn, 1987) and the overall context in which the sound or music is listened to (Bode, 2009). There exist also factors that are in control of the company. For instance, Wu et al. (2010) demonstrate that when the sound adopted is extremely brief, noisy or it has no direct relationship with the brand, it may lead the consumer to a state of confusion about brand identity and thus negatively affect the brand image.
This paragraph gave an overall introduction to sonic branding strategic potentials, the next one considers a narrower and far less studied topic within sonic branding: the sonic logo.
2.3 Sonic Logo
A sonic logo is the acoustic equivalent of a graphic logo. The sound or music of a sonic logo can include the name of the brand, other vocal messages, both or neither of them. Even though many brands have recognized the relevance and potential of sonic logos and have developed them, there is no consistent literature on the effects of sonic logos on brand perceptions and thus their development relies mainly on intuition instead of objective and measurable parameters (Bruner, 1990; Krishnan et al., 2012). It is necessary to further assess the existence
7 and relevance of these parameters in order for brands to create more efficient and effective sonic logos. Krishnan et al. (2012) already proceeded towards this direction studying the effect of different number of tones in a sonic logo on the perceived value of the brand. They applied a three, six or nine-note music on a fictitious brand of bread and demonstrated that there is a non-linear relationship with the willingness to pay for the bread; the six-note sonic logo caused the willingness to pay to be significantly higher than the three and nine-note sonic logo. This case suggests that the use of music in sonic logos allows the development of objective parameters, since music is composed of a multitude of definite characteristics that can be manipulated in order to assess their individual effects on brand perceptions.
2.4 Emotional Response to Music
As already mentioned, music has the ability to induce emotional responses in the listener (Fulberg, 2003), to affect the listener’s mood (Husain et al., 2002), consequently altering the listener’s behaviour (Alpert and Alpert, 1990; Bruner, 1990). Furthermore, the emotional responses do not only occur on a cognitive level but also on the physical one (Husain et al., 2002), as happy music reduces the depth of breathing and sad music reduces the heart rate (Krumhansl, 1997). Neuroscientific experiments show that emotional music stimulates the same brain areas that are stimulated by sex, food and drugs (Blood and Zatorre, 2001; Menon and Levitin, 2005), emphasizing the intensity of the emotional arousal. Since music produces such a strong emotional response that may lead to certain brand perceptions and behaviour, it is crucial for companies to understand how to manage the emotional response linked to the sonic logo by analyzing which characteristic of music affect consumers the most. Even in this case, personal perceptions towards the music affect the outcome; for example, the emotional response is higher when the listener finds the music more interesting (Lewis et al., 2012). However, there are some relatively objective effects produced by certain technical characteristics of music (Bruner, 1990) that can be used to drive the emotion towards a certain direction. The effects of technical characteristics of music on listener’s emotional state can be divided into time, pitch and texture related findings (Bruner, 1990). Time-related findings overall conclusion is that fast music generally evokes happier and more pleasant emotions than slow music (Scherer and Oshinsky, 1977; Swanswick, 1973) and in general, fast tempo music causes more arousal in the listener than slow tempo music (Husain et al., 2002). Specifically, slow music arouses calm, sentimental and ceremonious feelings, whereas fast music induces more exciting and joyful emotions (Hevner, 1937). In terms of rhythm, Hevner (1936) states
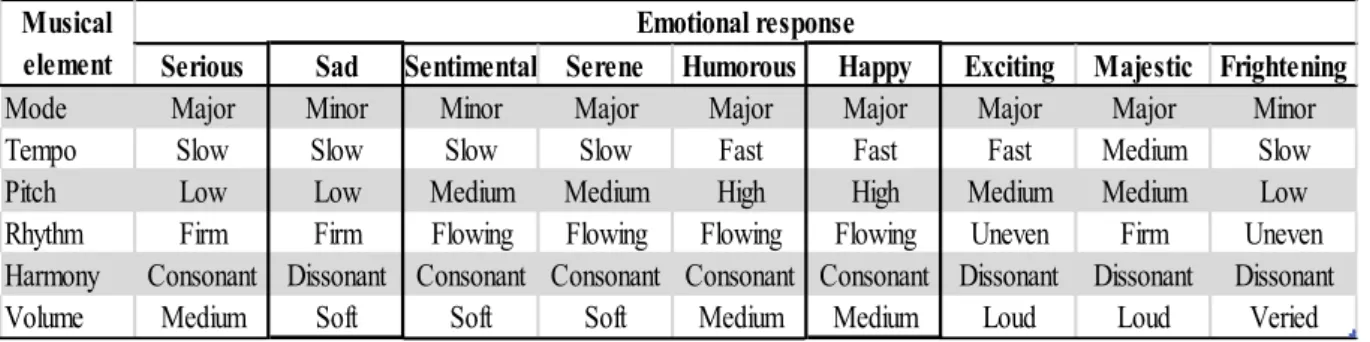
8 that firm rhythms are perceived as more serious and solemn and smooth rhythms as more happy, amusing and visionary. Finally, staccato notes are perceived as more energetic, compared with legato notes, which give more gentle and peaceful impressions (Wedin, 1972). Pitch-related findings suggest a significant relationship between pitch and perceived happiness: high-pitch music is perceived as happier and more exhilarating than low-pitch music, which is usually considered sadder (Bruner, 1990). In terms of mode, major mode evokes happier and more playful feelings than minor mode (Scherer and Oshinsky, 1977; Husain et al., 2002). The harmony of the music also plays a role, with consonant harmony inducing serenity and happiness and dissonant harmony sadness and agitation (Bruner, 1990). Texture-related findings suggest that different instruments and different volumes of the music induce different emotions in the listener (Bruner, 1990). Overall, technical characteristics that induce in the listener the emotions of happiness and sadness can be seen as opposite to each other in terms of mode, tempo, pitch, rhythm, harmony and volume: happiness is more likely to be evoked by major mode, fast tempo, high pitch, flowing rhythm, consonant harmony and medium volume; on the contrary, sadness is more easily evoked by minor mode, slow tempo, low pitch, firm rhythm, dissonant harmony and soft volume (Bruner, 1990). Other combinations of them may induce different emotional responses (Table 1).
Table 1: Music Technical characteristics for inducing emotional response (Bruner, 1990)
An important factor of emotional response to music is the difference between felt and perceived emotion. In fact, emotional response to a music stimulus usually refers to the perception of the empathetic representation of the music rather than the actual feeling of that emotion (Zentner et al., 2008). In other words, music does not make the listener experience the emotion directly, but rather imparts the emotion that is perceived but not necessarily felt by the listener. This is why sad music can still originate positive perceptions (Kallinen and Ravaja, 2006) and,
Serious Sad Sentimental Serene Humorous Happy Exciting Majestic Frightening
Mode Major Minor Minor Major Major Major Major Major Minor Tempo Slow Slow Slow Slow Fast Fast Fast Medium Slow Pitch Low Low Medium Medium High High Medium Medium Low Rhythm Firm Firm Flowing Flowing Flowing Flowing Uneven Firm Uneven Harmony Consonant Dissonant Consonant Consonant Consonant Consonant Dissonant Dissonant Dissonant Volume Medium Soft Soft Soft Medium Medium Loud Loud Veried
Emotional response Musical
9 therefore, should not be excluded a priori when designing a sonic logo, since it may still positively affect brand perceptions.
This section has presented existing knowledge that provides insights to be used when designing a sonic logo capable of inducing a certain emotional response in the consumer. The next session introduces the dependent variable in the correlation, which is the perceived value of the brand in terms of willingness to pay.
2.5 Willingness to Pay and Perceive Value
The Willingness to pay (WTP) is the maximum amount of money that an individual is disposed to spend for a certain product or service. Many studies have considered WTP as the dependent variable and demonstrated that external stimuli are able to induce variations to it (Brooker and Eastwood, 1989; Feinberg, 1986; Krishnan et al., 2012).
There exist many ways to assess consumers’ WTP, among which direct surveying seems the less appropriate in terms of reliability (Breidert et al., 2006). On a practical perspective, directly asking for WTP presents many weaknesses that can mislead the company’s pricing strategy (Nagle and Holden, 2002). However, the WTP can also be used theoretically to assess the perceived value of a product or a brand in monetary terms (Le Gall-Ely, 2009; Krishnan et al., 2012). Moreover, this research requires a relative rather than an absolute value; therefore, the actual monetary value is not as relevant as the different perceived value resulting from different independent stimuli. In order to assess the relative perceived value of a fictitious brand, Krishnan et al. (2012) suggest to use a benchmark price range, which indicates the minimum and the maximum at which existing brands are priced and to ask at which price the respondent thinks the fictitious brand is sold after receiving a specific stimulus about the brand.
2.6 Sonic Logo and Willingness to Pay
Little literature has investigated the effects of consumer’s emotional response to music on willingness to pay and brand perceptions, and none of them considers the sonic logo as the source of the music. Some studies on advertising found that sad music induces higher purchase intention than happy music (Alpert and Alpert, 1986, 1989), while a recent research on online bidding concluded that happiness positively affects willingness to pay (Yuan and Dennis, 2014). Given the scarcity and disagreement of existing knowledge, there is no obvious or highly
10 expected correlation between perceived emotion led by sonic logos and willingness to pay. If any correlation exists, it is plausible to be found by contraposing opposite emotions (such as “happiness” and “sadness”) that can be aroused by different music stimuli. Regarding the perception of emotional response in the listener, the above-mentioned findings (Bruner, 1990) allow the development of experimental sonic logos characterized by specific technical music features that should lead the emotional response towards the intended direction. Personal perceptions towards the music, such as pleasantness, distinctiveness, fit with the brand and interest previously explored must also be considered since their potential effects on the consumer’s brand perceptions. Moreover, In order to avoid as many biases as possible in the responses, the experimental sonic logo should be referring to a non-familiar or fictitious brand (Krishnan et al., 2012). Literature also suggests that the effect of music on brand perceptions is stronger for highly affective or low involvement products, compared with high cognitive involvement products (Bruner, 1990). Therefore, the emotional response should be stronger for a brand that fits this description.
11
3. METHODOLOGY AND DATA COLLECTION
This chapter describes in detail the research methodology employed in this study for acquiring primary data and thus answering the research questions.
The research methodology chosen for this study is composed of two parts and two different and complementary approaches. A qualitative approach is implemented for conducting in-depth interviews. A quantitative approach is implemented through the development and spread of an online survey. There are many reasons why the primary data collection has been conducted with the above-mentioned approaches. The most relevant one is the reliability and relevance of the results. Conducting a qualitative research before a quantitative one has many advantages in this respect. In fact, the qualitative approach allows to first acquire specific insights that help develop the quantitative part more accurately. Subsequently, the quantitative research can test these insights on a bigger sample, giving the results a statistical significance. Another important aspect is the reduction of cognitive biases in the questions formulation and data collection. Many biases might influence the researcher and the respondents during the whole process. It is important for the researcher to be aware of them and try to avoid or minimize their effects on the study. By conducting a qualitative data collection before the quantitative one, it is possible to minimize, for example, the confirmation bias (Nickerson, 1998) and the expectation bias (Jeng, 2006), which might influence the formulation of the questions in the survey. In-depth interviews also help reduce the availability bias (Tversky and Kahneman, 1973) and the hot-cold empathy gap (Loewenstein, 2000) in respondents by digging beyond first instinctive answers, which in a topic related to emotions and their effect on brand perceptions are likely to be affected by rational and conscious reasoning rather than subconscious considerations. Therefore, the qualitative research helps understand how to design the survey so that the answers are not driven by rationality but partly by subconscious factors such as the emotional response to music stimuli. In other words, interviewees’ answers to certain questions provide an important contribution on how to design the quantitative research in order to get to the subconscious part of the respondents’ brain when answering the survey. This chapter will focus in detail on the methodology adopted in each part.
3.1 Qualitative Research Methodology and Structure
Regarding the qualitative research, individual interviews were preferred to focus groups. Interviews allow exploring the topic deeper and individually, thus avoiding groupthink and
12 mutual influence among participants, other than overall superficial answers (Aaker et al., 2016). Moreover, interviews were chosen because of the nature of the topic: in order to acquire relevant insights concerning mainly subconscious behaviours, the researcher developed a structured list of open-ended questions to be used as guidelines with case-specific following directions depending on individual answers. The role of the interviewer was defined as professional and sociable, to ensure a friendly environment and a comfortable situation for the interviewees, who would be at ease with sharing their thoughts.
Eight in-depth individual interviews were conducted either face-to-face or through video chat. Each interview lasted approximately 45 minutes. Five participants are females and three are males, the age range is 23-26, and the nationality is mostly Italian apart from one Dutch. Respondents are either master students or workers recently graduated. The field of expertise is heterogeneous, ranging from Economics to Medicine, from Engineering to Architecture. No one of the respondents has a marketing, psychology or brand management background. The Italian respondents were interviewed in Italian, in order for them to focus on the content rather than the form and to express their thoughts fully and comfortably with no language barriers. All the interviews began with a short introduction regarding the purpose of their participation, which would remain confidential and anonymous. Even though each interview was subjected to a certain degree of personalization and subjectivity, the guidelines adopted can be categorized as follows. The interviews were conducted to explore in detail (1) how the respondents’ mood influences their purchase decision-making and for which product categories; (2) how their mood influences their spending habits and the perceived value of products and brands; (3) their attitudes towards music and music’s emotional power; (4) their attitudes towards sonic logos and the emotional music in them; (5) their brand perceptions depending on sonic logos (Appendix 1).
3.2 Quantitative Research
The existing literature and the qualitative research allowed the development of the quantitative part of the research, which was conducted in the form of an online survey. This choice was made for many reasons. Online surveys require a suitable amount of resources and provide quick information from hard-to-reach respondents; on the other side, online surveys increase potential sample errors and restrict the control of the researcher over the response process (Aaker et al., 2016).
13 The online survey was developed through the software Qualtrics and spread through social media and emails to reach an appropriate number of respondents. Since the sample was expected to be mainly composed of Italians, the survey was developed in two versions: the first version in English and the second one in Italian. Pre-tests were conducted to assure that the meaning of the words was the same for both languages. Moreover, the order of the questions was chosen to minimize the effect of previous questions on following ones: this choice is due to the subconscious nature of the relationships explored in this research.
3.2.1 Sampling Technique
For this study, a mix of non-probability sampling techniques was adopted. To obtain a proper amount of respondent, a convenience sampling technique was implemented alongside a snowball sampling technique. Advantages of this choice include the simplicity of data collection and time and cost efficiency. Adopting non-probability techniques, however, presents many disadvantages, among which the high risk of selection bias and sampling errors and the consequent low reliability of the results (Saunders, 2011).
3.2.2 Methodology and Structure
The survey is composed of several sections. The questionnaire begins with a short (1) introduction, immediately followed by the (2) experiment on sonic logos and WTP; afterwards, there are the sections regarding (3) purchase intention and brand perceptions, (4) involvement with the product category, (5) emotional response to music, (6) personal perceptions towards the music, (7) demographics and answers reliability. In the experiment, respondents are randomly divided into two groups, each of which is subjected to a different stimulus. The stimulus is a sonic logo of a fictitious brand of coffee composed of visual and sonic components; the sonic component represents the only difference between the two groups. The rest of the questionnaire remains the same for both groups, which are asked several questions about the fictitious brand of coffee and the music they heard in the sonic logo. Every section was developed with the intent of exploring potential reasons for the experiment’s results. Each section is discussed in detail in the next paragraphs and the complete version of the survey can be consulted in appendix 2.
14 The introductive part briefly states the reason for the survey, its expected duration and ensures the confidentiality and anonymity regarding the respondent’s answers. Finally, it expresses gratitude for responding it.
(2) Experiment on Sonic Logos and WTP
The experiment was designed considering the one conducted by Krishnan et al. (2012) to assess different willingness to pay depending on the number of tones played in a sonic logo. For this study, the researcher developed a brand new 15-second animated logo for a fictitious brand of coffee called MOOD and two different versions of the music played in it. The product category (coffee) was chosen based on the qualitative findings. Considering the effects of specific music characteristics on emotional response explored by Bruner (1990) presented in the previous chapter (Table 1), the two music stimuli were chosen with the intent of evoking the emotions of happiness and sadness in the two groups of respondents. Respondents are randomly shown one of the two versions of MOOD’s sonic logo. Subsequently, they read the following text: “Brands of coffee cost between 2 € and 5 € for a 250g coffee powder package.
2,00 € for private labels (supermarkets' brands like Pingo Doçe, Carrefour). 3,50 € for brands like Lavazza Qualità Rossa, Delta Lote Chavena.
5,00 € for premium coffee brands (Lavazza Qualità Oro, Delta Platinum)
Please indicate what you think is the price of MOOD’s 250g package of coffee powder based on the video you have watched.”
Respondents are given the prices of well-known brands of coffee and a continuous 2-to-5 € price range bar on which answer the question. In this case, the WTP represents the perceived price at which respondents think the fictitious brand is sold, and therefore the perceived monetary value of MOOD’s coffee (Krishnan et al., 2012). Even if this section represents the experiment in the strict sense, respondents answer all the following sections of the survey after it, making the whole questionnaire an experiment, in which the only difference between the two experimental groups is the music in the sonic logo.
(3) Purchase Intention and Brand Perceptions
After asking the perceived monetary value of the fictitious brand, respondents are asked the purchase intention for the brand given the price they selected in the experiment. This question adopts the third-person effect (Paul et al., 2000) by referring to the average person’s purchase
15 intention rather than the respondent’s. It is to be answered on a 1-to-5 single-item non-comparative ordinal scale from “absolutely not” to “absolutely yes”.
Regarding brand perceptions, a 5-point ordinal semantic-differential scale is implemented contraposing ten pairs of descriptive terms regarding the perceived brand personality and overall brand perceptions of the fictitious brand of coffee. The bipolar question was developed taking into account Aaker’s (1997) brand personality scale, which was adapted to the qualitative findings and to the specific purpose of this study.
(4) Involvement with the Product Category
The fictitious brand developed for the experiment is a brand of coffee because of the insights provided by the literature and the qualitative research. In fact, coffee is supposed to be a low-involvement product for which mood might have a minor effect on the purchase decision-making process. Since the involvement with the product category might influence the experiment’s results, this question is intended to measure it by adopting a 5-point Likert scale requesting respondents to indicate their level of agreement with ten statements about the product category of interest. This section aims to measure the overall agreement on price quality heuristics, habituality, essentiality, choice ease and speed, and mood dependence regarding decision-making. Once again, the third-person effect (Paul et al., 2000) was adopted, asking the level of agreement about people’s attitudes towards coffee rather than their own.
(5) Emotional Response to Music
At the beginning of this section, the same version of the sonic logo is shown again and respondents are told to pay specific attention to the music in it. This section, in fact, aims to measure the emotional response to the music played in the sonic logo. Respondents watch the sonic logo according to the previous randomization so that every respondent is always exposed to only one version of the sonic logo. Using a 5-point Likert scale, respondents are asked to indicate their level of agreement, from “strongly disagree” to “strongly agree”, with ten statements meant to measure different characteristics regarding the emotional response to the music. These characteristics include the intensity of the emotional arousal provoked by the music, the valence of the emotion, both of which were found to be relevant variables by the in-depth interviews, and the difference between perceived and felt emotions in response to the music. Since the technical characteristic of the two music stimuli are supposed to evoke happiness and sadness, the valence of the emotional response is measured by three categories
16 for positive emotions (“happy”, “joyful”, “exciting”) and three categories for negative emotions (“melancholic”, “sad”, “depressing”).
(6) Personal Perceptions towards the Music
This section is also preceded by the same sonic logo because it is meant to measure the personal perceptions towards the music in it. The literature provides many relationships between certain perceptions towards the music and brand perceptions; moreover, the qualitative research provided some additional insights in this sense. It is therefore important to test them in this specific case since they might influence the experiment’s results. Personal perceptions towards the music present in the literature such as pleasantness, distinctiveness, interest, novelty, familiarity, as well as the fit of the music with a brand of coffee come up besides personal perceptions that the qualitative research suggested to be significant such as elegance, fit of the music with the video and with the respondent’s current mood. All of them are measured with a 5-point Likert scale on fourteen statements to which respondents are asked to indicate their level of agreement.
(7) Demographics and Answers Reliability
The last section of the survey includes questions regarding respondents’ demographics, such as gender, age, nationality, country of residence and occupation. Moreover, the last question asks whether the respondent has paid attention to the questions, has answered them honestly, and therefore whether his or her responses should be included in the research. In other words, it questions the reliability of the respondent’s answers throughout the survey. This question is particularly important since the survey requires the participants to make an effort in following the instructions regarding the proper interaction with the sonic logo, and allows the researcher to exclude the negative answers from the study.
3.3 Data Analysis
The responses of the online survey are analyzed and the results are shown in the following chapter. The statistical software IBM SPSS is adopted to analyze the responses by running various statistical tests, depending on the nature of the variables and the purpose of this study. After the data preparation process, the Cronbach’s alpha is measured to test the scale reliability of the scales related to brand perceptions, emotional response to music and personal perceptions towards the music (Peterson, 1994). Regarding the involvement with the product category and
17 demographics, tests of frequency are performed. In order to assess whether the different music in the sonic logo affects the rest of the responses according to the experiment, a series of independent samples t-tests are conducted: the two groups tested are the randomized groups of the experiment and the variables studied are respectively the WTP, purchase intention, brand perceptions, emotional response to music and personal perceptions towards the music. To evaluate how the WTP is influenced by brand perceptions, emotional response to music and personal perceptions towards the music respectively, three independent linear regression models are conducted, alongside an overall linear regression model including all the scales. Moreover, a paired samples t-test is conducted to infer the difference between perceived and felt emotions evoked by the music. Finally, in order to measure the mediation effect of emotional response to music and personal perceptions towards the music on the relationship between the sonic logo and the WTP, an additional tool is adopted. PROCESS v3.0 by Andrew F. Hayes is an analytical tool for IBM SPSS (www.processmacro.org), which model 4 allows measuring the mediation effect of interest by running a bootstrap analysis (Hayes, 2017).
18
4. RESULTS’ ANALYSIS
This chapter presents the main findings from the qualitative research alongside the statistical analysis conducted on quantitative primary data, with the purpose of answering the research questions.
4.1 Qualitative Main Findings
This part summarizes the relevant findings and insights from the interviews that were taken into account to design the quantitative research.
During the introductive section, respondents were asked what they perceive to be low-involvement products, for which brand perceptions are more likely to be influenced by music (Bruner, 1990). Food and beverage, and specifically “supermarket goods”, resulted to be the most agreed industry among participants. Within food and beverage, respondents stated that their mood has a greater impact on their purchase choices for non-necessary goods (snacks, sweets and alcoholic drinks) compared with the majority of habitual and basic goods (water, fruit, vegetables, salt, sugar, milk and bread). For some products, instead, respondents were in doubt whether the mood could influence their decisions, which might depend on the specific situation (pasta, meat and coffee). Therefore, the fictitious brand designed for the survey was chosen to be a brand of coffee.
Respondents’ mood can influence their spending habits and perceived value of brands depending on product category, specific occasion and intensity of the emotional state. However, there is no unanimous agreement on whether it is happiness or sadness to be more influent and to increase the spending and the WTP: positive moods make the shopping experience more pleasant and increase the willingness to buy, while negative moods create a need for reward to be satisfied with expensive products.
“When I am happy I buy more things but I am more price sensitive; when I am sad I buy less but I care less about prices”
Angela, interviewee This is in line with previous research’s contrasting findings and uncertainty about how emotions and moods influence WTP (Yuan and Dennis, 2016; Alpert and Alpert, 1986), and underlines the importance of analyzing the two opposite emotions (happiness and sadness) in the experiment.
19 According to respondents, music has an impact on mood, but mood has an even stronger impact on the music chosen to be heard. This underlines the importance of the emotional context in which the music is heard, since the effect of music is mainly to reinforce the emotions already present in the listener. Specifically, music that communicates positive emotions seems to have a stronger impact than music communicating negative emotions; however, sad music does no induce only negative feelings. This finding seems to suggest that “happy” music might induce a stronger emotional arousal than “sad” music. Therefore, there is the need to statistically measure the intensity of such emotional arousal in response to the sonic logo, since it might play a role in the correlation studied.
It appears, according with the literature, that personal perceptions towards the music adopted in sonic branding, and specifically in sonic logos, can influence brand perceptions in many ways. The most important attribute seems to be the fit of the music with the brand, followed by pleasantness and distinctiveness.
“Pleasant music that fits the brand is for me sign of higher quality and price, while I associate distinctive and interesting music with more innovative brands”
Simone, interviewee On the contrary, respondents agree that unpleasant music would negatively influence their perception of the brand. Some respondents suggest that these characteristics may influence the perceived quality of the brand and help make the brand memorable, but the majority states that the perceived quality would not change depending on the music.
“Music does not influence my perceptions towards the brand in terms of price and quality” Chiara, interviewee Regarding personal perceptions towards the music, the interviews provide insights about the potential effect of not only previously discussed but also novel personal perceptions towards the music on the correlation. The survey analyzes all the personal perceptions found to be relevant by the interviews and by previous literature: whether the music is pleasant, distinctive, interesting, novel, easy to recognize, familiar, elegant, grabs the attention, causes surprise, fits the video, the brand and the respondent’s current mood, and whether it is too noisy. The statistical analysis will show which are statistically relevant in the correlation between sonic logos and WTP.
20 The potential effect of emotional music on brand perceptions depends on the product category and the fit of the music with the visual logo. In general, happy music is suggested to fit with a cheap and unhealthy brand of food, while sad music with a more expensive, prestigious and healthy brand.
“I associate happy music with cheap and unhealthier brands of food while I associate sad or serious music with healthier or more expensive and premium brands of food.”
Dafne, interviewee These insights underline the importance of statistically measure the relationship between sonic logos and brand perceptions, since brand perceptions seem to be influenced by the emotional response to music related to a certain product or brand. The survey includes a section regarding brand perceptions of the fictitious brand of coffee in order to assess whether they are directly influenced by the sonic logo.
Other than practical insights regarding specific questions of the survey, the qualitative research provided conceptual insights about its structure. In fact, the design of the survey should allow investigating the subconscious correlation under research; therefore, the order of the questions must be designed so that the answers are not driven by rationality but partly by subconscious factors such as the emotional response to music stimuli. In other words, interviewees’ answers were essential for the structure and design of each section and the overall sections’ sequence, in order to get to the subconscious part of the respondents’ brain when answering the survey.
4.2 Quantitative Results’ Analysis 4.2.1 Sample Characterization
The survey obtained 392 responses, 68 of which were discarded due to incompletion or unreliability, leading to the final sample of 324 valid responses. Respondents are mainly females (65.1%); the age is reasonably distributed, the majority of respondents being between 18 and 34 years old (58%). 92% of the sample is Italian, and the 82.7% currently lives in Italy. Finally, the majority is employed (50.6%), followed by students and working students (34.3% cumulatively). (Appendix 3)
21
4.2.2 Scale Reliability
In order to assess the internal consistency and reliability of the scales adopted in the survey, the Cronbach’s Alpha is measured (Peterson, 1994) for the following multi-item scales: the 10-item brand perceptions scale (α = .818); the 14-10-item personal perceptions towards the music scale (α = .837); and two 6-item emotional response to music sub-scales, one for positive emotions (α = .801) and one for negative emotions (α = .755). The scale reliability is defined to be acceptable for a Cronbach’s Alpha higher than .70 (Aaker et al., 2016). In this case, all the scales present an acceptable Cronbach’s Alpha, evidencing internal consistency and reliability. (Appendix 4)
4.2.3 Product Category Involvement
Frequencies regarding the product category involvement indicate overall tendencies about people’s attitudes towards coffee. The dimension with the highest mean is habituality (M = 4.16, SD =.71), which is agreed or strongly agreed by 90.2% of respondents, while the lowest is mood dependence (M = 2.12, SD = .84), which is disagreed or strongly disagreed by 74.4% of respondents. The items regarding price and quality relationship show how people tend to adopt such heuristics when evaluating coffee brands. Even though respondents tend to evaluate the product category highly in terms of involvement (M = 3.53, SD = .76), they also report high agreement with the essentiality of coffee (“Coffee is an essential good”: M = 3.15, SD = 1.25; “People always have coffee at home”: M = 4.10, SD = .81). (Appendix 5)
4.2.4 Effect of Music
In the next paragraphs, the effect of music on different variables is tested through a series of independent samples t-tests. Specifically, this part aims to observe whether the different music stimuli implemented in the experiment have an impact on the mean of the following variables: WTP, purchase intention, brand perceptions, emotional response to music, personal perceptions towards the music. The experimental randomization divided the respondents in almost equal groups, each of which was subjected to only one version of the sonic logo. The logos will be referred as “Sonic logo 1” (for the “happy” version) and “Sonic logo 2” (for the “sad” version). Respectively, Group 1 is composed of 165 respondents and Group 2 of 159.
22
4.2.4.1 Effect of Music on WTP
Concerning the direct relationship between different music in the sonic logo and WTP (RQ1), the independent samples t-test shows that there is a significant difference between the two groups. In fact, the WTP is significantly higher for respondents who are shown the Sonic logo 2 (M = 3.58, SD = .64), compared to respondents who are shown the Sonic logo 1 (M = 3.25, SD = .62), t (322) = -4.58, p < .001. (Appendix 6)
4.2.4.2 Effect of Music on Purchase Intention
Regarding the effect of the music on purchase intention, the independent samples t-test indicates that Group 1 has a significantly higher purchase intention (M = 3.53, SD = .63), compared to Group 2 (M = 3.36, SD = .72), t (322) = 2.32, p < .05. (Appendix 7)
4.2.4.3 Effect of Music on Brand Perceptions
This section assesses the relationship between the music in the sonic logo and each item of the brand perceptions bipolar scale (RQ2). The independent samples t-test shows that some items are significantly different between groups, while others are not (Table 2). The items for which there is no significant difference depending on the music are “Uninteresting to interesting”, “Unhealthy to healthy”, “Unreliable to reliable”, “Traditional to modern” and “Unattractive to attractive”. On the contrary, Group 1 has significantly higher values than Group 2 for “Serious to funny” (𝑀𝐺𝑟𝑜𝑢𝑝 1 = 3.37, SD = 1.00; 𝑀𝐺𝑟𝑜𝑢𝑝 2 = 2.77, SD = 1.09; t (322) = 5.16, p < .001); while Group 2 has significantly higher values than Group 1 for “Modest to prestigious” (𝑀𝐺𝑟𝑜𝑢𝑝 1 = 2.92, SD = .95; 𝑀𝐺𝑟𝑜𝑢𝑝 2 = 3.19, SD = .99; t (322) = -2.54, p < .05), “Common to uncommon” (𝑀𝐺𝑟𝑜𝑢𝑝 1 = 3.04, SD = 1.12; 𝑀𝐺𝑟𝑜𝑢𝑝 2 = 3.30, SD = 1.04; t (322) = -2.22, p < .05),“Cheap to expensive” (𝑀𝐺𝑟𝑜𝑢𝑝 1 = 2.74, SD = .92; 𝑀𝐺𝑟𝑜𝑢𝑝 2 = 3.15, SD = .97; t (322) = -3.92, p < .001), “Low quality to high quality” (𝑀𝐺𝑟𝑜𝑢𝑝 1 = 3.24, SD = .85; 𝑀𝐺𝑟𝑜𝑢𝑝 2 = 3.45, SD = .85; t (322) = -2.17, p < .05). (Appendix 8)
23 Table 2: Significant between-groups differences in brand perceptions
4.2.4.4 Effect of Music on Emotional Response to Music
Since the music stimuli were selected with the intent of evoking in the listener specific emotions, this section is to be considered a manipulation check. Results show that the mean of each item included in the emotional response scale is significantly different depending on the sonic logo (Table 3). Group 1 shows significantly higher values regarding the positive emotions items such as “The music is happy” (𝑀𝐺𝑟𝑜𝑢𝑝 1 = 4.05, SD = .72; 𝑀𝐺𝑟𝑜𝑢𝑝 2 = 2.28, SD = .89; t (322) = 19.59, p < .001), “The music is joyful” (𝑀𝐺𝑟𝑜𝑢𝑝 1 = 4.12, SD = .68; 𝑀𝐺𝑟𝑜𝑢𝑝 2 = 2.14, SD = .85; t (322) = 23.17, p < .001), “The music is exciting” (𝑀𝐺𝑟𝑜𝑢𝑝 1 = 2.76, SD = .95; 𝑀𝐺𝑟𝑜𝑢𝑝 2 = 2.11, SD = .78; t (322) = 6.66, p < .001) and “The music makes me feel happy” (𝑀𝐺𝑟𝑜𝑢𝑝 1 = 3.49, SD = .96; 𝑀𝐺𝑟𝑜𝑢𝑝 2 = 2.32, SD = .92; t (322) = 11.21, p < .001). Accordingly, Group 2 presents significantly higher values for the negative emotions items such as “The music is melancholic” (𝑀𝐺𝑟𝑜𝑢𝑝 1 = 1.67, SD = .73; 𝑀𝐺𝑟𝑜𝑢𝑝 2 = 3.92, SD = .87; t (322) = -25.37, p < .001), “The music is sad” (𝑀𝐺𝑟𝑜𝑢𝑝 1 = 1.50, SD = .67; 𝑀𝐺𝑟𝑜𝑢𝑝 2 = 3.36, SD = 1.01; t (322) = -19.57, p < .001), “The music is depressing” (𝑀𝐺𝑟𝑜𝑢𝑝 1 = 1.56, SD = .75; 𝑀𝐺𝑟𝑜𝑢𝑝 2 = 2.61, SD = 1.07; t (322) = -10.30, p < .001) and “The music makes me feel sad” (𝑀𝐺𝑟𝑜𝑢𝑝 1 = 1.78, SD = .80; 𝑀𝐺𝑟𝑜𝑢𝑝 2 = 2.94, SD = 1.05; t (322) = -11.28, p < .001). The item regarding the intensity of the emotional arousal is significantly higher for Group 2 (𝑀𝐺𝑟𝑜𝑢𝑝 1 = 3.63, SD = .89; 𝑀𝐺𝑟𝑜𝑢𝑝 2 = 3.63, SD = .78; t (322) = -3.99, p < .001), while the item regarding the understanding of the emotion communicated by the music is significantly higher for Group 1 (𝑀𝐺𝑟𝑜𝑢𝑝 1 = 3.64, SD = .83; 𝑀𝐺𝑟𝑜𝑢𝑝 2 = 3.42, SD = .86; t (322) = 2.29, p < .05). (Appendix 9)
Item Significant
Uninteresting to Interesting -
-Modest to Prestigious Sonic logo 2
Common to Uncommon Sonic logo 2
Serious to Funny Sonic logo 1
Unhealthy to Healthy -
-Cheap to Expensive Sonic logo 2
Low quality to High quality Sonic logo 2
Unreliable to Reliable -
-Traditional to Modern -
-Unattractive to Attractive -
24 Table 3: Significant between-groups differences in emotional response to music
4.2.4.5 Effect of Music on Personal Perceptions towards the Music
In terms of personal perceptions towards the music, the majority of items are not significantly different between the two groups (Table 4). However, Group 1 presents significantly higher values for recognizability (𝑀𝐺𝑟𝑜𝑢𝑝 1 = 3.64, SD = .86; 𝑀𝐺𝑟𝑜𝑢𝑝 2 = 3.04, SD = 1.04; t (322) = 5.68, p < .001), fit with the video (𝑀𝐺𝑟𝑜𝑢𝑝 1 = 3.28, SD = .99; 𝑀𝐺𝑟𝑜𝑢𝑝 2 = 3.03, SD = 1.14; t (322) = 2.08, p < .05), fit with a brand of coffee (𝑀𝐺𝑟𝑜𝑢𝑝 1 = 2.98, SD = .93; 𝑀𝐺𝑟𝑜𝑢𝑝 2 = 2.74, SD = 1.07; t (322) = 2.16, p < .05), and excessive noise (𝑀𝐺𝑟𝑜𝑢𝑝 1 = 2.51, SD = 1.01; 𝑀𝐺𝑟𝑜𝑢𝑝 2 = 1.59, SD = .60; t (322) = 9.91, p < .001). Instead, Group 2 has significantly higher values regarding interest (𝑀𝐺𝑟𝑜𝑢𝑝 1 = 2.80, SD = .95; 𝑀𝐺𝑟𝑜𝑢𝑝 2 = 3.16, SD = 1.02; t (322) = -3.28, p < .05) and elegance (𝑀𝐺𝑟𝑜𝑢𝑝 1 = 2.24, SD = .91; 𝑀𝐺𝑟𝑜𝑢𝑝 2 = 3.65, SD = .89; t (322) = -14.18, p < .001). (Appendix 10)
Item Significant
The music is emotional Sonic logo 2
The music is happy Sonic logo 1
The music is joyful Sonic logo 1
The music is exciting Sonic logo 1
The music is melancholic Sonic logo 2
The music is sad Sonic logo 2
The music is depressing Sonic logo 2
I understand the emotion communicated by the music Sonic logo 1 The music makes me feel happy Sonic logo 1
The music makes me feel sad Sonic logo 2
25 Table 4: Significant between-groups differences in personal perceptions towards the music
4.2.5 Effect of Brand Perceptions on WTP
To understand which characteristics of brand perceptions affects the WTP, a linear regression model is calculated through stepwise method: the items of the brand perceptions scale are considered the independent variables to predict the respondents’ WTP. A significant regression is found (F (4,319) = 53.65, p < .001, 𝑅2 = .402) for the bipolar variables “Cheap to expensive”, “Modest to prestigious”, “Low quality to high quality” and “Unhealthy to healthy”. Therefore, the predicted WTP is equal to 1.969 + .259 (Expensive) + .142 (Prestigious) + .162 (High quality) – .084 (Healthy). Unsurprisingly, the first three variables are positively correlated with the WTP. Surprisingly, instead, the fourth variable is negatively correlated with the independent variable. (Appendix 11)
4.2.6 Effect of Emotional Response to Music on WTP
In order to predict the WTP depending on the emotional response to the music (RQ3), a linear regression is calculated through stepwise method, in which the independent variables are the items included in the emotional response to music scale. A significant regression is found (F (3,320) = 15.67, p < .001, 𝑅2 = .128) for the following items: “The music is melancholic”, “The music is depressing” and “The music is exciting”. According to this model, participants’ predicted WTP is equal to 2.924 + .215 (Melancholic) - .171 (Depressing) + .100 (Exciting). Therefore, there is a positive correlation between perceived melancholic and exciting music
Item Significant
I like the music -
-The music is pleasant -
-The music is distinctive -
-The music is interesting Sonic logo 2
The music is novel/original -
-The music is easy to recognize Sonic logo 1
The music grabs my attention -
-The music causes surprise -
-The music sounds familiar to me -
-The music fits the video Sonic logo 1
The music fits a brand of coffee Sonic logo 1
The music fits my current mood -
-The music is too noisy Sonic logo 1
The music is refined/elegant Sonic logo 2
26 and WTP alongside a negative correlation between perceived depressing music and WTP. All the other items included in the emotional response scale have no significant direct effect on WTP. (Appendix 12)
4.2.6.1 Perceived and Felt Emotions
The difference between perceived and felt emotions in response to music is explored with a paired samples t-test. The test is conducted for two pairs of variables: emotional perception is paired respectively with the values regarding felt happiness and felt sadness. Results show significant difference between perceived emotion (M = 3.53, SD = .85) and both felt happiness (M = 2.92, SD = 1.11), t (323) = 9.95, p < .001; and felt sadness (M = 2.35, SD = 1.10), t (323) = 14.58, p < .001. It is interesting to point that the difference is larger for felt sadness compared to felt happiness. (Appendix 13)
4.2.7 Effect of Personal Perceptions towards the Music on WTP
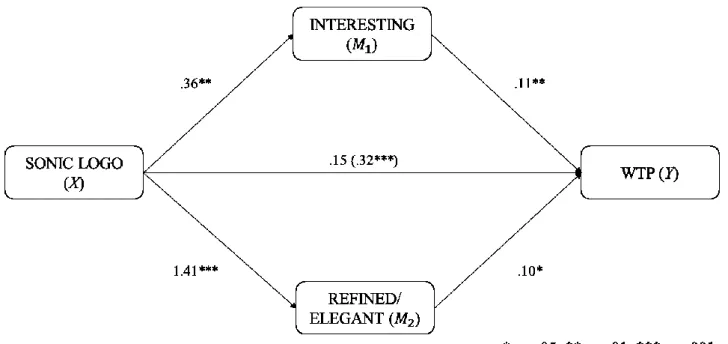
Another linear regression is calculated through stepwise method to address the effect of personal perceptions towards the music on WTP (RQ4). Out of the fourteen items included in the personal perceptions scale, only two are statistically significant in predicting the WTP: “The music is refined/elegant” and “The music is interesting”. The regression model is significant (F (2,321) = 21.07, p < .001, 𝑅2 = .116) and accordingly, the predicted WTP is equal to 2.716 + .142 (Refined/Elegant) + .094 (Interesting). These two variables have a positive effect on WTP, while all the other items regarding personal perceptions towards the music have no significant effect in predicting the WTP. (Appendix 14)
4.2.8 Overall Effect on WTP
After conducting individual regression models to measure single-scale effects on WTP, all the scales are simultaneously considered as independent variables to predict WTP through a comprehensive stepwise regression model (RQ3, RQ4). Unsurprisingly, a significant regression is found (F (8,315) = 32.33, p < .001, 𝑅2 = .451), which explains more variance of the dependent variable than all the other models individually. Considering all the scales, the predicted WTP is equal to 1.680 + .242 (Expensive [brand]) + .242 (Prestigious [brand]) + .077 (Familiar [music]) + .180 (High quality [brand]) - .100 (Healthy [brand]) + .101