i
Francisco Ramadas da Silva Ribeiro Bento (M2013022)
Dissertation presented as partial requirement for obtaining
the Master’s degree in Statistics and Information
Management
Predicting Start-up Success with Machine
Learning
i
MEGI
2
017 Predicting Start-up Success with Machine Learning Francisco Ramadas da Silva
2
NOVA Information Management School
Universidade Nova de Lisboa
Predicting Start-up Success with Machine Learning
By
Francisco Ramadas da Silva Ribeiro Bento (M2013022)
Dissertation presented as partial requirement for obtaining the Master’s degree in Information
Management, with a specialization in Business Intelligence
Advisors / Co Advisors: Professor Doutor Roberto Henriques / Mestre João Ferreira Loff
3
ACKNOWLEDGEMENTS
I would like to dedicate this work to my family and friends who always believed in me and gave me strength to finish this project in times where time seemed unavailable.
To my advisor Professor Roberto Henriques for the insights, reviewing my work and letting me present this study. I was not easy I know. Thank you.
To João, who co-advised my work. A friend and co-founder of the most challenging professional experience of my life. For the technical support and long hours dedicated into understanding my stubborn view of this study. Thank you.
To my mother and father who always pushed me into finishing what I start. It would not be possible without you. Thank you.
To my friend Guilherme, with whom I share not only one of the greatest friendships but an amazing professional adventure which challenges us every day. Thank you for the patience, motivation and the long hours working alone while I wasn’t available. I look forward to returning the effort with interest.
To Constança who, in times of pressure, always pushed me by giving motivation to conciliate all my duties. You rock. Thank you.
To Gonçalo for all the discussion – you made me challenge everything. I firmly believe in your potential. Your curiosity, knowledge and intrinsic view of technical problems will take you as far as you want. Thank you.
4
ABSTRACT
Start-ups are becoming the motor that moves our economy. Google, Apple, or more recently Airbnb and Uber are companies with tremendous impact in worldwide economy, social interactions and government. Over the past decade, both in the US and Europe, there has been an exponential growth in start-up formation. Thus, it seems a relevant challenge understanding what makes this type of high-risk ventures successful and as such, attractive to investors and entrepreneurs. Success for a start-up is defined here as the event that gives a large sum of money to the company’s founders, investors and early employees, specifically through a process of M&A (Merger and Acquisition) or an IPO (Initial Public Offering). The ability to predict success is an invaluable competitive advantage for venture capitals on the hunt for investments since first-rate targets are those who have the potential for growing rapidly soon, which ultimately, allows investors to be one step ahead of competition.
We explored the world’s largest structured database for start-ups – provided by the website CrunchBase.com, with the objective of building a predictive model, through supervised learning, to accurately classify which start-ups are successful and which aren’t. Most of the studies regarding the prediction of processes of M&A or an alternative definition of a company’s success tend to focus on traditional management metrics provided by financial reports and thus using a low number of observations compared with the present study. As technologies of information evolve it became possible to achieve highly reliable results in data analysis by manipulating it with complex machine learning algorithms or data mining techniques to define features and characterize robust models. Further developments on previous studies such as the development of new features and a new definition for the target variable were applied. Using Random Forests on our dataset, a general model (as including all categorical features) achieved a True Positive Rate (TPR) of 94%, which is the highest recorded with this data source, and a False Positive Rate (FPR) of 8%. The author also generated models per each category of a company to provide results comparable with previous studies the values achieved ranged between 61% and 96% compared with 44% and 80%. As a novelty, models for each of the five geographical regions selected (all from USA) are provided, with TPRs ranging between 90% and 96%. The new features, focused on the impact of venture capital in a company, proved pivotal to the overall performance of the models by being some of the most important to the final models showing the critical importance this type of investment has on these ventures.
Keywords
Start-up, Mergers and Acquisitions (M&A), IPO, data analysis, machine learning, venture capital, true positive rate (TPR), false positive rate (FPR).
5
INDEX
1. INTRODUCTION 9 1.1. OBJECTIVES 11 1.1.1. TECHNICAL OBJECTIVES 11 2. LITERATURE REVIEW 12 2.1. START-UP ECOSYSTEM 122.1.1. START-UP DEFINITION &GROWING IMPORTANCE 12
2.1.2. SUCCESS FOR START-UPS:IPOS AND M&AS 15
2.2. DATA ANALYSIS 17
2.2.1. DATA MINING 17
2.2.2. MACHINE LEARNING 19
2.3. PREVIOUS RESEARCH ON ACQUISITION PREDICTION 22
3. METHODOLOGY 25
3.1. DATA COLLECTION AND SELECTION (CRUNCHBASE CORPUS) 26
3.2. DATA PRE-PROCESSING 27
3.2.1. DATA CLEANING 28
3.2.2. DATA SELECTION 31
3.2.3. DATA TRANSFORMATION 33
3.2.3.1. Changes in original Data 33
3.2.3.2. New Variables 35
3.2.4. DATASET BREAKDOWN 38
3.3. EXPERIMENT SETUP 45
3.3.1. EVALUATION METRICS 45
3.3.2. PROBLEMS WITH THE DATASET AND SOLUTIONS USED 46
3.3.2.1. Sparsity of the dataset 46
3.3.2.2. Imbalanced Classes 50
3.3.3. MACHINE LEARNING ALGORITHMS 51
3.3.3.1. Logistic regression 52
3.3.3.2. Support Vector Machines 53
3.3.3.3. Random Forest 54
3.3.4. BASELINE 55
3.4. EXPERIMENT RESULTS 57
3.4.1. EVALUATING LEARNING ALGORITHMS 57
3.4.2. CHOOSING THE LEARNING ALGORITHM 58
3.4.3. FEATURE IMPORTANCE 59
3.4.4. EVALUATION BY STATE AND CATEGORY 61
4. CONCLUSIONS 63
5. RECOMMENDATIONS FOR FUTURE WORKS 65
6. REFERENCES 66
7. APPENDIX 71
7.1. SMOTEPSEUDO-CODE 71
7.2. RANDOM FORESTS –HOW IT WORKS 71
8. ANNEXES 75
8.1. DATA ANALYSIS 75
6
8.3. FINAL FEATURES 83
8.4. PYTHON SCRIPTS 87
8.4.1. GENERAL MODEL 87
8.4.2. MODEL PER STATE/CATEGORY 89
8.5. SQLQUERIES 91
8.5.1. DISCRETIZATION OF EMPLOYEE_COUNT: 91
8.5.2. AGE OF ACQUISITION AND IPO 91
8.5.3. SET TECH COMPANIES AND FINAL CATEGORY (1 PER COMPANY) 91
8.5.4. NUMBER OF CUSTOMERS PER COMPANY: 91
8.5.5. INVESTORS PER FUNDING ROUND,AVERAGE INVESTORS PER ROUND,AVERAGE INVESTMENT (IN DOLLARS) PER
FUNDING ROUND: 92
8.5.6. NUMBER OF FOUNDERS, HAS FOUNDER, NUMBER OF MONTHS OF EXPERIENCE (SUM OF JOBS), FOUNDERS
EXPERIENCE (SUM OF JOBS), TOTAL NUMBER OF JOBS: 93
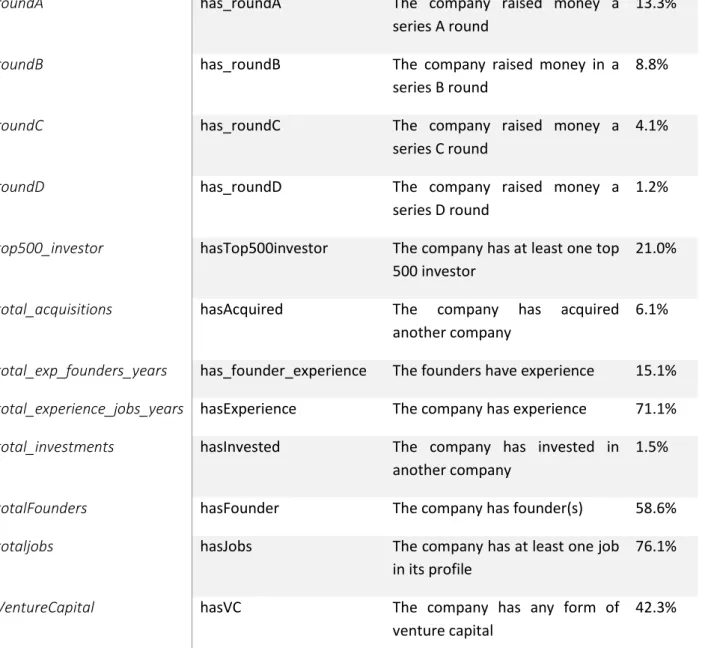
8.5.7. NUMBER OF COMPETITORS, WAS COMPETITOR ACQUIRED OR IPO 94 8.5.8. ROUND A,B,C,D: HAS ROUND, DATE OF ROUND, RAISED AMOUNT 94 8.5.9. NUMBER OF TOP500 INVESTORS (BY INVESTMENTS MADE) 95 8.5.10. TOTAL ACQUISITIONS & TOTAL INVESTMENTS PER COMPANY 96
7
LIST OF TABLES
FIGURE 1-METHODOLOGY OVERVIEW 25
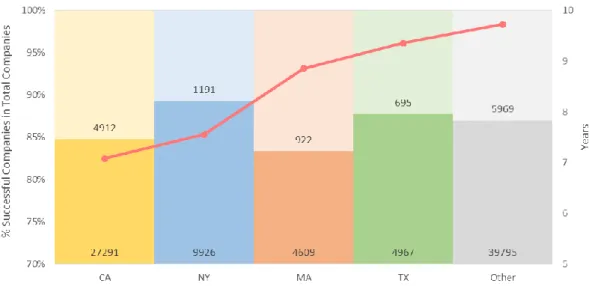
FIGURE 2-AVERAGE AGE OF SUCCESS PER STATE 38
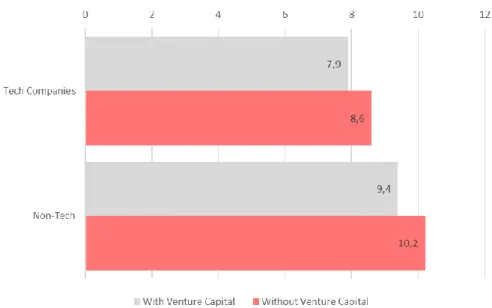
FIGURE 3–PERCENTAGE OF SUCCESSFUL COMPANIES PER CATEGORY 39 FIGURE 4-AVERAGE AGE OF SUCCESS PER TOP-10 CATEGORY IN EACH STATE 40 FIGURE 5–AVERAGE IMPACT OF VC IN TECH AND NON-TECH COMPANIES 41 FIGURE 6-IMPACT OF VC IN EACH STATE (TECH AND NON-TECH) 41 FIGURE 7-IMPACT OF VC AND TOP500INVESTORS IN SUCCESSFUL COMPANIES 42 FIGURE 8-#SUCCESSFUL COMPANIES PER #EXPERIENCE OF FOUNDING TEAM (IN YEARS) 42 FIGURE 9-FUNDING TOTAL (IN MILLIONS OF DOLLARS) PER COMPANY 43 FIGURE 10-ACCURACIES FOR LR,SVM AND RANDOM FORESTS 57
FIGURE 11-ROCCURVE 59
FIGURE 12-SMOTE ALGORITHM (PSEUDO-CODE) 71
FIGURE 13–DECISION TREE SAMPLE TREE (EXAMPLE) 72
FIGURE 14-AVERAGE SUCCESS AGE FULL TABLE 75
FIGURE 15-AVERAGE AGE OF SUCCESS (TOP 10 CATEGORIES) 77
FIGURE 16-PYTHON SCRIPT (GENERAL MODEL) 89
8
LIST OF FIGURES
FIGURE 1-METHODOLOGY OVERVIEW 25
FIGURE 2-AVERAGE AGE OF SUCCESS PER STATE 38
FIGURE 3–PERCENTAGE OF SUCCESSFUL COMPANIES PER CATEGORY 39 FIGURE 4-AVERAGE AGE OF SUCCESS PER TOP-10 CATEGORY IN EACH STATE 40 FIGURE 5–AVERAGE IMPACT OF VC IN TECH AND NON-TECH COMPANIES 41 FIGURE 6-IMPACT OF VC IN EACH STATE (TECH AND NON-TECH) 41 FIGURE 7-IMPACT OF VC AND TOP500INVESTORS IN SUCCESSFUL COMPANIES 42 FIGURE 8-#SUCCESSFUL COMPANIES PER #EXPERIENCE OF FOUNDING TEAM (IN YEARS) 42 FIGURE 9-FUNDING TOTAL (IN MILLIONS OF DOLLARS) PER COMPANY 43 FIGURE 10-ACCURACIES FOR LR,SVM AND RANDOM FORESTS 57
FIGURE 11-ROCCURVE 59
FIGURE 12-SMOTE ALGORITHM (PSEUDO-CODE) 71
FIGURE 13–DECISION TREE SAMPLE TREE (EXAMPLE) 72
FIGURE 14-AVERAGE SUCCESS AGE FULL TABLE 75
FIGURE 15-AVERAGE AGE OF SUCCESS (TOP 10 CATEGORIES) 77
FIGURE 16-PYTHON SCRIPT (GENERAL MODEL) 89
9
1. INTRODUCTION
“A start-up can be defined as a human institution created to develop new products and/or services under extreme uncertainty conditions.”
(Ries, 2011)
Start-ups are booming everywhere as more colleges, governments and private companies invest and stimulate people to pursue their ideas throughout these ventures. Companies are raising millions with ease and achieving unicorn status (i.e., a one-billion-dollar valuation) in a matter of years. Slack, a messaging app, achieved it after operating for 1.25 years (Kim, 2015). Examples like Uber and Airbnb are changing societies in such impactful ways that regulation had to be created to keep pace with a new reality. Start-ups are having such impact that, ultimately it becomes every investor’s ambition to be part of a large acquisition such as Facebook acquiring WhatsApp (another messaging app) for nineteen billion dollars which allowed Sequoia (a Venture Capital fund) to have a 50x return on investment (Neal, 2014). But there is a catch, start-ups are companies with an estimated 90% probability of failure, which means a lot of investments without proper returns (Patel, 2015).
Predicting the success of a start-up is commonly defined as two-way strategy that makes a large amount of money to its founders, investors and first employees, as a company can either have an IPO (Initial Public Offering) by going to a public stock market (i.e. Facebook going public, allowing everyone to invest in the company by buying shares being sold by its insiders in the U.S stock market) or, be acquired by or merged (M&A) with another company (i.e. Microsoft acquiring LinkedIn for $26B) where those who have previously invested receive immediate cash in return for their shares. This process is often denominated as an exit strategy (Guo, Lou, & Pérez-Castrillo, 2015). This study will therefore, consider both an IPO (Initial Public Offering) and a process of M&A (Mergers & Acquisitions) as the critical events that classify a start-up as successful.
With a focus on how a start-up or an investor could explore all this knowledge for a better decision making in investment strategy and monetary gain, the study intends, by applying data mining and machine learning techniques, to create a predictive model that has as the dependent variable a label to classify whether a start-up is (already) successful or not.
Improved areas of our society are already being improved by the application of machine learning. From healthcare, where by applying segmentation and predictive modelling it is possible to identify different types of treatment (from preventive to life-style changes) for a patient or even diagnose him (Raghupathi & Raghupathi, 2014), to marketing personalization where companies benefit from knowing as much as possible from their clients to create customer-centric experiences all around. Fraud detection, financial services, insurance and even smart cars are all industries creating value, in a short to medium term, through the application of machine learning (Marr, 2016). It is possible to bring similar advantages to investors in start-ups, by giving these players information about which start-ups are closer to a successful event in their near future they can better choose where to put their chips and have higher returns on their investments.
To generate the predictive model, three supervised machine learning algorithms were tested: Support Vector Machines, Logistic Regression and Random Forests. All these algorithms fit the characteristics of the dataset (147 features and more than 140 000 observations), provide a fast and
10 simple technical implementation. The creation of a predictive model to explain this specific phenomenon is an excellent indicator of how the level of exploitation of Data Mining techniques allows analysts to extract the full potential of the available data to reach all proposed goals. Being able to accurately classify if a start-up had this event in its progress is not only incredibly valuable for all the players in the start-up world (entrepreneurs, angels and investors of Venture Capital) but also, the application of different techniques and features to build models with higher predictive accuracy represents a step forward to not only the academic literature but also the industry.
Although there are a lot of studies about predicting processes of M&A, most focus on financial and managerial features with Logistic Regression being the most common predictive algorithm used (Ali-Yrkkö, Hyytinen, & Pajarinen, 2005; Altman, 1968; Gugler & Konrad, 2002; Karels & Prakash, 1987; Meador, Church, & Rayburn, 1996; Ragothaman, Naik, & Ramakrishnan, 2003). There is still space for an approach focused on venture capital (or other type of investment) features and different machine learning algorithms to company acquisition and with a platform as rich as CrunchBase it is an interesting challenge to explore and compare achieved results with previous approaches (Liang & Daphne Yuan, 2012; Xiang et al., 2012).
Considering the improvements achieved with the current approach, from 61% to 96% compared with 44% to 80% for different company’s categories and an overall TPR (True Positive Rate) of 94%, it is important to reinforce the advancements achieved in this study.
The following dissertation is divided in three sections: first section explores the study relevance and its importance, the objectives, a literary review of the thematic including previous studies of company acquisition and an overview of baseline articles. Secondly, the process to generate a final dataset from CrunchBase data. This includes pre-processing, creation of new variables, problems faced and its solutions. Finally, the application of machine learning algorithms to generate the proposed predictive model through supervised learning – the experiment setup, its results and final conclusions.
11
1.1. O
BJECTIVESThe present work has as the main objective, the development of a predictive model to classify a start-up/company as successful or not (binary classification).
The most recent works, such as A Supervised Approach to Predict Company Acquisition with Factual and Topic Features Using Profiles and News Article, on predictive analysis (using the same dataset) on start-up success rate shows there is room for improvement. Previous studies tend to focus primarily on managerial features and often overview the impact of financial features related with funding (specially from Venture Capital funds). It is intended to bridge this gap by creating funding-oriented features with good predictive impact in classifying successful companies. Additionally, there is room to improve the quality of the sample by being more selective with companies or by better treating the amount of sparse data which is characteristic of this dataset.
The present dissertation will also test different machine learning algorithms for its learning task in the generation of said predictive model (Xiang, Zheng, Wen, Hong, & Rose, 2012).
1.1.1. Technical Objectives
During the process, the author expects to achieve several technical objectives:
During a first phase of Data Analysis, a full understanding of the CrunchBase database is expected, followed by the process of Data cleaning (missing values, duplicates, redundant data). Having a full database ready to be filtered it fundamental to define the scope of data to be used in the model and to be able to do an explorative analysis of key features. Transformation of data will be made by defining and creating new features which will generate the final dataset to be used in the learning task.
Followed by a second phase consisting on the Experiment Setup and its Results, where the
experiment will be set up by applying different machine learning algorithms to generate the best
possible model through supervised learning to try to outperform current state of art. The algorithms tested are Logistic Regressions (LR), Support Vector Machines (SVM), and Random Forests (RF).
12
2. LITERATURE REVIEW
The literature review will identify major themes related to the subject of this study. Also, similarities and differences in previous studies will be considered to enrich the project’s content to make it unique and innovative for the start-up scene.
2.1. S
TART-
UPE
COSYSTEM2.1.1. Start-up definition & Growing Importance
Start-ups are companies that make products that venture to an area or market in ways that haven’t been done before. This makes start-ups risky and unpredictable as a new product or service may not work among its apparent users and may require constant adjustments before it gets product/market fit. Ultimately, a start-up is a high-risk company that is in the first stage of operations and commonly related to technology as a product or a service (Ries, 2011).
These ventures are often initially bootstrapped by their entrepreneurial founders as they attempt to capitalize on developing a product or service. Due to limited revenue or high scalability costs, most of these small-scale operations are not sustainable in the long term without additional funding from venture capitalists (in opposition to getting a bank loan). In the late 1990s, the most common type of start-up was a known as “dotcom”. As access to the internet expanded and computers took on an increasingly important part in people’s daily lives, venture capital became extremely easy to obtain during that time due to an excitement among investors speculating on the emergence of new types of businesses with a market penetration never seen before. Unfortunately, between 1997 and 2001, in a crisis known as the “dotcom bubble”, most of these technological start-ups went bankrupt due to major oversights in their business plans, such as a lack of a sustainable revenue (Geier, 2015). Founder of PayPal, Chairman of Palantir and serial entrepreneur Peter Thiel, defines a start-up as a creator of vertical innovation and not horizontal. Being vertical innovation the technology that hasn’t been created before and horizontal innovation the process of globalization, bringing existing technology to places that don’t have it yet. Thiel is also a firm believer that a start-up must aim to create a monopoly in a niche market and only then expand to new markets (Thiel & Masters, 2014). Thiel contributes with the most extreme point-of-view on the definition of a start-up, clearly focused on the characteristics of technological ventures. This is demonstrated by his views of exponential growth and market positioning (as a monopoly ruler) only possible in this field and at an early stage. Y Combinator founder Paul Graham puts it more simply in his essay: “A start-up is a company designed to grow fast”. Also, contrary to technology mogul, Peter Thiel, Graham doesn’t believe technology is essential to start-ups. To him, only companies with fast growth matters. Quoting, “Being newly founded does not in itself make a company a start-up. Nor is it necessary for a start-up to work on technology, or take venture funding, or have some sort of exit. The only essential thing is growth” (Graham, 2012). By explicitly including non-technological companies as start-ups, Graham gives the more realistic definition to today’s businesses as even small ventures can have cash flow positive operations in short term without having to raise debt allowing them to focus on expanding as fast as possible and thus being deemed start-ups.
13 Steve Blank, author of Four Steps to the Epiphany, although with a similar definition as Graham, defines it differently adding an important notion of scalability: a start-up is an organization aiming for a repeatable and scalable business model for a limited period. Once a start-up finds its model, it ceases to be a start-up (Blank, 2006).
It is also important to understand the difference between start-ups and traditional small businesses, according to “The Global Start-up Ecosystem Ranking 2015” developed by Compass.co (formerly Start-up Genome) in partnership with CrunchBase (the source of data used in the present work), a traditional small business has the odds of financial succeeding for the first two years of around 75%, inversely, a start-up has a 75% chance of failing. Nonetheless, an auto-shop or a laundry will hardly reach a Fortune 500 market capitalization but there are hundreds of start-ups in that league (Hermann, Gauthier, Holtschke, Bermann, & Marmer, 2015).
It is a game of higher risk, higher returns. Knowing the high risk and huge percentage of start-ups that fail, but also the exponential growth in start-up formation in US and Europe as well as its growing importance in national economies, it seems a valuable challenge to quantitatively study a phenomenon that is challenging so many people around the globe (Hermann et al., 2015; Williams, 2015).
Neil Patel (2015) from Forbes reports that nine out of ten start-ups will fail with most common factors for it, being first, the lack of market need for a specific product or service and secondly, companies that run out of capital (Griffith, 2014).
So, why are we seeing start-ups everywhere? Even countries are promoting its creation. See Portugal, a country with a massive debt (Eurostat, 2016) launched a program with fifteen different incentives for both investors and entrepreneurs in 2016 to further develop the ecosystem (Matias, 2016).
Focused on technological start-ups Steve Blank, proposes four reasons for the phenomenon in his book “The Four Steps to the Epiphany” (Blank, 2006):
- Start-ups can now be built for thousands rather than millions: With a decrease in cost of product
development by a factor of 10 over the last decade (Hermann et al., 2015), it is now cheaper than ever to build technology. Access to tools, open-source code, cheaper servers, and an ever-growing community of developers contributing to the dissemination of technology around the globe allows everyone to build, test and share its products. The highest representation of this fact is WhatsApp, which was bought for more than $19 billion dollars and had sixteen employees (Neal, 2014).
- A higher resolute venture capital industry: When Venture Capital (VC)1 were required to spend
millions of dollars on an investment, they had to make a small number of big bets. However, with the cost of technology being less expensive every year it has created an opportunity for other types of investors: angels, accelerators and micro-VCs. These entities, with smaller checks can make a whole lot of small bets and help a larger number of start-ups. This lifeline for small start-ups allows them to not look for additional outside funding until later stages of development.
14
- Entrepreneurship developing its own management science: When the first wave of Information
Era venture-backed software companies began in the 1970’s, many entrepreneurs applied its knowledge of Management Science created by Henry Ford and his peers. However, especially after the huge dotcom bubble burst in the final years of the nineties, many entrepreneurs began to realize start-ups were a different reality with a different rule set. Forty years after the beginning of the modern start-up era, Steve Blank with “The Four Steps to the Epiphany” and Eric Ries with “The Lean Start-up” laid the foundation for a new management science for start-ups, which has come to be known as the Lean Start-up Movement. Overtime “entrepreneurs have become significantly better at creating start-ups.” (Hermann et al., 2015)
- Speed of consumer adoption of new technology: As internet became universally accessible,
start-ups could be - from day one - what Steve Blank calls, a “micro-multinational” and people from all over the world can access products from the opposite end of the planet without any inconvenience (Blank, 2006). Google and Facebook prove that location is, probably, meaningless. Even the business conjuncture changed as big companies are now willing to try cheaper, faster and more elegant technologies from emerging start-ups. For example, Slack, the fastest ever company to achieve a billion-dollar valuation (becoming a unicorn in 1.25 years) is a three-year-old start-up sensation who managed to get customers like Airbnb, Buzzfeed, eBay, Expedia, NASA and Salesforce through very cheap software and a refined product (“Slack: Customer Stories,” 2017).
Not only has “the ease of global access to users and customers (…) and the increasing speed of technological adoption by consumers and businesses enabled start-ups to grow at a significantly faster rate” but also the access to up-to-date data and data-mining techniques gave entrepreneurs access to more knowledge than ever, avoiding mistakes of the past and correctly assessing what are the fundamental features (KPIs) for their companies. For an investor, a more data-driven decision process (as supported by data-mining and machine learning) lowers risks, which in the end represents higher returns on investments (Hermann et al., 2015).
15
2.1.2. Success for Start-ups: IPOs and M&As
The success of a start-up is commonly defined as a two-way strategy as a company can either have an IPO (Public Initial Offering) by going to a public stock market, allowing its shareholders to sell shares to the public, or be acquired or merged (M&A) with another company where those who have previously invested receive immediate cash in return for their shares. This process is often designated as an exit strategy (Guo, Lou, & Pérez-Castrillo, 2015).
Mergers and acquisitions are usually referred to as M&As and play an important part of corporate restructuring. According to Alam & Khan (2014), a merger is the strategy of joining two companies to form one single company (usually under a new name) to increase the profit and sales level and is, in non-tech companies, more frequent between entities of the same size and stature. M&A activities are especially critical for high-tech industries, because they often use M&As to acquire state-of-the-art technologies or rapidly expand their R&D capabilities (Wei, Jiang, & Yang, 2009). “An acquisition refers to a situation where one firm acquires another and the latter ceases to exist. An acquisition occurs when one company takes controlling interest in another firm (…) A firm that attempts to acquire or merge with another company is called an acquiring company” (Machiraju, 2003).
The rationale behind a process of M&A is that two companies are of more value together than as separate entities. This consolidation of two companies is a critical corporate strategy for companies to preserve their competitive advantages (Machiraju, 2003; Xiang et al., 2012).The Thomson Reuters report, shows 2015 as the biggest year ever in worldwide M&A deals with a $4.7 trillion in total business. A 42% percent rise from 2014, beating the former record of $4.4 trillion in 2007 (Rogers, 2016). The understanding of mergers and acquisitions is of great importance in today’s world where newspapers tell stories of such taking place around the globe. (Alam & Khan, 2014) Ultimately, an M&A prediction can help start-ups assess their possibility of being acquired or merged and who are the possible bidder companies (Wei et al., 2009). Using CrunchBase data to corroborate this trend, there were 4 589 acquisitions in 2015 and 7 899 in 2016 which represents a 72% increase.
According to Li & Liu (2010), “An IPO is the first sale of stock by a private company to the public. Therefore, ‘going public’ is an important event over the life cycle of a company. In the post-IPO stages, the companies will be evolved into continued growth as a healthy company, get acquired before a strong performance or weak performance, and be delisted from the stock market at the end of its life cycle.”.
When an IPO occurs, the venture obtains a stock market listing enabling the company to receive additional financing and allowing insiders to eventually sell their shares to the public.
There is no optimal exit strategy for a company as it heavily depends on multiple factors, such as the profitability of the company, the financial market conditions, the trade of information between insiders, the benchmark of other companies’ IPO, among many others (Akerlof, Yellen, & Katz, 1970). In the start-up ecosystem either one of these events is usually considered a success for the company, being acquired or going public, as it brings (large) amounts of immediate money to its founders, investors and early employees (Guo et al., 2015). One of the most frequent reasons for start-ups/companies to acquire smaller companies is to buy its talent pool. Not only the parent company is buying technology but also hiring its employees. This type of acquisition is commonly called,
16 acquihiring and provides a fast strategy to grow in competitive markets (Marita Makinen, Haber, & Raymundo of Lowenstein Sandler, 2014).
17
2.2. D
ATAA
NALYSIS“We are drowning in information and starving for knowledge.” – Rutherford D. Roger
2.2.1. Data Mining
We are currently living in a society where all our business, scientific and government transactions are computerized but also in a world where digital devices, social media and bar codes are generating data. Data scientists have been facing a challenge to rapidly increase our ability to generate and collect data through new techniques and automated tools, aiming to transform the ever-growing databases into useful information and most importantly, knowledge (Han & Kamber, 2006; Kantardzic, 2003).
Ian Witten and Eibe Frank define Data Mining as the process of extracting implicit and previously unknown information with potential use from a dataset (Witten, Frank, & Eibe, 2000). By building programs that look through databases, there is the potential to find strong patterns which, if found, will be able to generalizable complex problems and make accurate predictions on future data. Witten and Frank provide an example, the weather problem, to illustrate how by using only a set of four features – outlook, temperature, humidity and windy, one can find a pattern and predict if there are conditions to play outside. Through a simple set of rules, they can accurately classify an observation as a place with conditions to play outside or not (Witten et al., 2000). Machine learning provides the technical basis for data mining. It is used to extract information from the raw data in databases.The process of discovering patterns in data must be automatic or semiautomatic (which happens more frequently), and the discoveries must be “meaningful” in that they lead to some advantage. Since both terms are frequently associated, It is also important to understand machine learning as the mathematical algorithms used to create models and Data Mining as the entire process of knowledge extraction (which may or may not have machine learning techniques in its process) (Witten et al., 2000).
Berry & Linoff have a more business-centric definition, defining data mining a collection of technological tools and techniques required to support companies by providing useful knowledge. Their rational revolves around the notion that companies need to make decisions based on data (informed decisions) as opposed to assumption-based ones (uninformed decisions) and that companies need to measure all results which will always be beneficial to the business (Berry & Linoff, 2004). Christopher Clifton, with a similar definition, considers data mining as an interdisciplinary subfield of computer science with the overall goal of extracting information from large volumes of data, discovering patterns and transforming it into understandable knowledge.
Data mining is widely used in business, scientific research and even government security, since it combines methods from machine learning and statistics with database management to analyze data. Traditionally, data mining and the knowledge extraction were performed manually, however, the dissemination and increasing power of computer technology has dramatically increased data collection, storage, and manipulation ability. As datasets have grown in size and complexity, direct "hands-on" data analysis has increasingly been augmented with indirect, automated data processing, aided by newest discoveries in computer science, such as neural networks, cluster analysis, genetic
18 algorithms (1950s), decision trees and decision rules (1960s), and support vector machines (1990s) (Christopher Clifton, 2009; Kantardzic, 2003).
To make sense of data and aiming to address the problem of data overload, data scientists came up with a process concerned with the development of methods and techniques to standardize the application of Data Mining – Knowledge Discovery in Databases (or, in more recent approaches, Data). It is defined by Fayyad, Piatetsky-Shapiro and Smyth as the application of specific data-mining methods for pattern discovery and knowledge extraction. Jiawei Han and Micheline Kamber added, more recently, the notion that this data can be provided by different sources such as multiple databases, data warehouses, web or any data stream. The original definition of a KDD process is a 5-step framework that every Data Mining problem should follow: (1) Selection, data into target data; (2) Pre-processing, target data into processed data; (3) Transformation, processed data into transformed data; (4) Data Mining, transformed data into patterns2; (5) Interpretation/Evaluation;
interpretation of patterns into knowledge (Fayyad, Piatetsky-Shapiro, & Smyth, 1996).
While this definition is considered the standard for KDD, Jiawei Han and Micheline Kamber propose a more modern approach: (1) Data cleaning, removing noise, outliers, missing values; (2) Data integration, combining different data sources; (3) Data selection, retrieving relevant data from the database; (4) Data transformation, data is transformed as new features are created; (5) Data mining, mathematical algorithms are applied to extract meaningful patterns; (6) Evaluating results; (7) Knowledge presentation, where visualization and knowledge representation techniques are used to present results (Han & Kamber, 2006).
Applications of data-mining can be seen in healthcare as data mining is becoming increasingly essential in this field. Evaluating treatment effectiveness by comparing causes, symptoms and courses of treatment to the outcomes of patient groups treated with different drug regimens for the same disease allows to determine which treatments work best and are most cost-effective for each group (Kudyba, 2014). Also, to aid healthcare management, data mining applications can be developed to better identify chronic disease states and high-risk patients, design appropriate interventions, and reduce the number of hospital admissions and claims (Chye Koh & Tan, 2011). Other applications of data mining in healthcare are detection of fraud, customer relationship management and, even, predictive medicine.
Marketing also attracts a lot of development in this field. The most common application of data mining in marketing is through segmentation, which by analyzing customer databases allows the definition of different customer groups and even forecast their behavior. The amount of data gathered has so much potential that one time, Target (a US retailer), segmented a young woman as pregnant even before the father knew about the pregnancy (Hill, 2012). Another marketing application of data mining is through market-basket analysis systems, which find patterns in customers consumption habits (Fayyad et al., 1996). This allows a better management of stock, and distribution of shelve space in supermarkets.
2 Data Mining is a step in the KDD process that consists on applying data analysis and discovery
algorithms to produce patterns (or models) over transformed data. Classification (as in the present study), regression or clustering are examples of common data analysis. The data-mining component of the KDD process often involves repeated iterative application of data-mining methods.
19
2.2.2. Machine learning
Over the last 50 years, machine learning evolved from the efforts of scientists like Arthur L. Samuel exploring whether machines could learn to play games like checkers (Samuel, 1962) to a broad discipline taught in scientific schools all over the world and to be applied in all our interactions with technology. With computational power rapidly increasing over the past few decades it became possible to use these techniques in more practical ways than before. Using technologies like regressions and support vector machines, Google created PageRank, Google News and even Gmail spam classifier in its way to become one of the most powerful companies in the world. These algorithms became easy to distribute making new applications that rely on these techniques, more and more common (Beyer, 2015).
Kirk Borne, Principal Data Scientist at Booz Allen, clearly defines “machine learning as the basis set of mathematical algorithms that learn the models that describe the patterns and features in data” and “data mining as the application of those algorithms to make discoveries from large data sets” (“Artificial Intelligence and Machine Learning: Top 100 Influencers and Brands,” 2016; Onalytica, 2016).
Tom M. Mitchell, Department Head of machine learning at Carnegie Mellon University in his “The discipline of machine learning”, starts his exploration on the thematic by defining the question the field of machine learning seeks to answer:
“How can we build computer systems that automatically improve with experience, and what are the fundamental laws that govern all learning processes?”
The answer is broad as machine learning covers learning tasks ranging from autonomous robots, to the data mining of consumer records to predict their behavior, to search engines that automatically learn its users’ preferences but idea is: machine learning, a natural outgrowth of the intersection of Computer Science and Statistics, is the ability to make a machine learn something through experience (data) and original settings (algorithms and its parameters) (Mitchell, 2006).
Rob Schapire, formerly the Professor of computer science at Princeton University and currently at Microsoft, defines ML very simply as: “machine learning studies computer algorithms for learning to do stuff”. Machine learning is the capacity of telling a computer how to complete a task, make accurate predictions or even learn on how to act properly upon a determined scenario. It always starts with previous observed data and a set of instructions on how to analyze it. “So in general, machine learning is about learning to do better in the future based on what was experienced in the past”, Rob Schapire adds (Schapire, 2008).
We live in a world where machine learning applications are present in (almost) every sector of our daily lives:
- Banks and other businesses in the financial industry who use it primarily to identify investment opportunities, or help investors know when to trade. Using data mining can also identify clients with high-risk profiles, or pinpoint warning signs of fraud (Schapire, 2008). - Websites promoting items you might like based on previous purchases or searches based on
our previous behavior. More recently, Text Mining is also being used to compare a user review score with his review text (Loff, 2016).
20 - Uber, Lyft and other car sharing services use these algorithms to make routes more efficient or to predict potential problems to increase profitability. Even self-driving cars need machine learning to predict accidents or optimize routes (“10 Million Self-Driving Cars Will Be On The Road By 2020 - Business Insider,” 2016; NGUYEN, 2015).
- The health industry uses it as tool to help medical teams carry out pattern recognition of damaged tissue (structural health monitoring) to correctly diagnose patients. And more recently, wearable devices use sensors to monitor people’s health in real time (Farrar & Worden, 2012).
Machine learning can be divided in four different categories: supervised, unsupervised, semi supervised and reinforcement learning. Being supervised and unsupervised learning the most widely used.
Supervised learning algorithms make predictions based on a set of examples. A supervised learning
algorithm is, having x input variables and an output variable y. The algorithm learns to map the
function (y=f(x)) and can (correctly) predict/classify any new output y after getting new input data x. The possible answers from the output are known. All data is labelled, and the algorithms learn to predict the output from the input data. Supervised algorithms can be grouped into regression and classification problems: A regression function is a type of model when the output variable is a real value, i.e., 88, 130, 0%. A classification function generates models where the output is a category, i.e., “red”/ “blue”, “acquired”/ “not acquired”.
Unsupervised learning algorithm is when we only have input variables/features and no output
(target variable). It is in the learning process that the algorithm will discover and classify possible outcomes. Here, we don’t know the possible answers. As all data is unlabeled, the algorithm should learn to create patterns from the input data. Typically, unsupervised learning can be grouped into clustering and association analysis. A clustering problem is the discovery of groups with heterogeneous characteristics between them and homogeneous characteristics between the observations of each group. A frequent application of cluster techniques is in the segmentation of clients for a company (marketing). An association rule problem is when you want to discover n rules that describe large portions of data, such as people that acquire A also tend to buy B (usually used in supermarket chains) (Aggarwal, 2015; Berry & Linoff, 2004; Han & Kamber, 2006; Kantardzic, 2003; Mitchell, 2006;).
Frequently mistaken with machine learning, Data Mining is the set of different techniques to produce knowledge from data. It can involve statistical inference and machine learning algorithms to identify patterns in large datasets. Machine learning on the other hand is the specific set of mathematical algorithms running through computers to understand the structure of data being analyzed (Christopher Clifton, 2009). Machine learning can be defined as the set of methods and techniques used to discover patterns in data, it is a step in a broader discipline which is Data mining. An in-depth exploration of the topic is present in 2.2.1. Data Mining.
Being machine learning the ability to make computers learn through past information to provide present or future context, it is natural to see the potential for company acquisition studies using these techniques. We now have an immense historic information regarding acquisitions, IPOs, investment and others, that should be explored. Both supervised and unsupervised learning techniques can provide value in this field. For example, through a regression or a classification
21 problem it is possible to predict success (as in the present study), while through segmentation (unsupervised learning), one would be able to differentiate companies automatically and in ways not always obvious. The possibilities are endless, and it is up those working in this field to provide the most value from the available data.
22
2.3.
P
REVIOUSR
ESEARCH ONA
CQUISITIONP
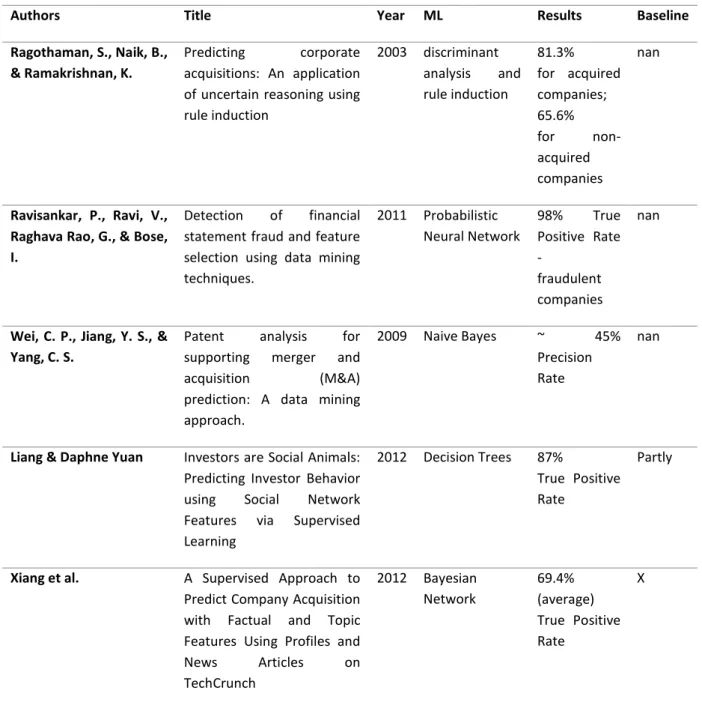
REDICTIONMost research focused on predictions by analyzing common quantitative financial variables for corporate companies as firm size, market to book value ratio, cash flow, debt to equity ratio and price to earnings ratio (Ali-Yrkkö, Hyytinen, & Pajarinen, 2005; Gugler & Konrad, 2002; Meador, Church, & Rayburn, 1996). With some adding managerial features as industry variations (Meador et al., 1996), management inefficiency (Ali-Yrkkö et al., 2005; Meador et al., 1996) and resource richness (Meador et al., 1996). Most of the analysis methods used to build M&A prediction models have been Logistic Regressions (or Multinomial Logistic Regressions) (Ali-Yrkkö et al., 2005; Gugler & Konrad, 2002; Meador et al., 1996; Ragothaman, Naik, & Ramakrishnan, 2003).
Hyytinen and Ali-Yrkko reported “how multinomial logic estimations show that if a Finnish firm owns a number of patents registered via the European Patent Office (EPO), the patents increase the probability that the firm is acquired by a foreign firm.”. The authors took under consideration other variables for their model as firm size, cash flow ratio to total assets and ROI (return on investment) to simulate managerial performance (Yrkkö et al., 2005). A relevant finding in Hyytinen and Ali-Yrkko’s work is that size (as a logarithmic function of total assets owned) matters. The larger the firm, the more likely it is acquired. However, their sample of 815 Finnish companies is too small to test with more powerful techniques.
Wei, et al., also studied the importance of patents a company has and its importance supporting Merger and Acquisitions prediction. Through a Naïve Bayes model to classify a company as whether the candidate target company would be acquired or merged by the bidder company or not, they defined a set of features such as number of patents granted to a company, number and impact of recent patents and the company’s technological quantity. Their results, with a set of 2394 acquisitions, vary between a precision rate of 42.93% and 46.43% (Wei et al., 2009). Although making a relevant step in predicting M&A’s by including technological variables they limited their results by excluding all other categories such as management and financial features.
ACTARGET is a tool to classify firms into acquisition and non-acquisition target categories and uses discriminant analysis and rule induction in its model. They developed the tool with a database of 97 acquired and 97 non-acquired firms, achieving 81.3% of the acquisitions and 65.6% non-acquisition companies as correctly classified (Ragothaman et al., 2003). Although promising, the small dataset and the use of only eight financial features limit their results.
There has also been a large focus on studies about business failures and bankruptcies over the last fifty years (Xiang et al., 2012). Professor Edward Altman, best known for the development of the (Altman) Z-score, proposed several financial ratios as the features of a multivariate statistical analysis in his study to predict bankruptcy. Altman extended his first study into the prediction of railroad bankruptcies in America by using a set of 21 railroads that went bankrupt between the years 1939-1970. Specifically, Altman with a five-variable model using multiple discriminant analysis, analyzed ratios like, common liquidity measures, solvency and leverage measures, and profitability measures plus efficiency indicators with a very accurate classification at one and two years prior to bankruptcy (achieving an accuracy of 97.7%) (Altman, 1968; Zhang & Zhou, 2004).
More recently Ravisankar et al., used six machine learning algorithms, Multilayer Feed Forward Neural Network (MLFF), Support Vector Machines (SVM), Genetic Programming (GP), Group Method
23 of Data Handling (GMDH), Logistic Regression (LR), and Probabilistic Neural Network (PNN) to understand the differences between a set of 202 companies listed in various Chinese stock markets, using 35 financial features. The dataset consisted of 101 non-fraudulent companies and 101 that were. Their Probabilistic Neural Network outperformed all other classifiers with a True Positive Rate of 98.09% predicting which companies were fraudulent (Ravisankar et al., 2011). Their numbers are impressive but the use of a small sample of 202 companies and a lack of exploratory analysis of the features used allows the assumption that significant differences between fraudulent and non-fraudulent companies exist and would be “easily” distinguished in their learning task. Their approach has the highest results analyzed but the scope of their investigation is not specifically company acquisition but more oriented to fraud prevention.
Investments behavior of venture capital firms and other investors in start-ups is also a subject of study. Liang & Daphne Yuan (2012) used the CrunchBase dataset to predict investor behavior using social network features and a supervised learning approach. They modelled the investment behavior through a classic link problem as they compare every pair of Investor and Company to predict if the Investor will invest in a Company based on how similar or different in terms of their social relationship. As of May 2012, their dataset comprised 89’370 companies and 28’108 investment rounds. Using Decision Trees as their learning algorithm, they achieved a TPR (True Positive Rate) of 87.53% with an AUC (Area Under Curve) of 0.77%. Although not directly predicting acquisitions their study still signals successful companies (Liang & Daphne Yuan, 2012) .
Using the same dataset but with a focus on start-up acquisition and investments from venture capital, Xiang et al. (2012), predicts company acquisition combining both the structured data from CrunchBase database and the application of text-mining on scrapped news from the website TechCrunch. Their model’s TPR ranges between 60% and 79.8% for different company’s category using Bayesian Network (BN) as their machine learning algorithm. FPR (False Positive Rate) ranging between 0 and 8.3% over categories with less missing values in the CrunchBase corpus. Their result is much better than the previously state-of-art article, Wei et al. (2009), who achieved a precision rate of 42.9% and 46.4%. Also, their final dataset consisted on 59 631 observations and with more than 6 000 acquisitions, this study far exceeded the 2 394 cases analyzed by Wei et al. (2012). Additionally, they proved that their text-mining component improves overall results.
Except for studies using CrunchBase database, most have small and specific datasets for the task at hands, and although achieving promising results, the nature of the data limits expansions on their work. Also, most works tend to focus on managerial features which doesn’t tell the full scope of a company’s status or potential to be acquired. Studies using CrunchBase database also do not take full potential of the data available opting for not creating several features related with the impact of venture capital such as number of investors, rounds of investment, amount raised among many others. In their defense, it must be said that some of the information available today might not been available at the time of their studies.
24
Authors Title Year ML Results Baseline
Ragothaman, S., Naik, B., & Ramakrishnan, K.
Predicting corporate acquisitions: An application of uncertain reasoning using rule induction 2003 discriminant analysis and rule induction 81.3% for acquired companies; 65.6% for non-acquired companies nan Ravisankar, P., Ravi, V., Raghava Rao, G., & Bose, I.
Detection of financial statement fraud and feature selection using data mining techniques. 2011 Probabilistic Neural Network 98% True Positive Rate - fraudulent companies nan
Wei, C. P., Jiang, Y. S., & Yang, C. S.
Patent analysis for supporting merger and acquisition (M&A) prediction: A data mining approach.
2009 Naive Bayes ~ 45% Precision Rate
nan
Liang & Daphne Yuan Investors are Social Animals: Predicting Investor Behavior using Social Network Features via Supervised Learning
2012 Decision Trees 87%
True Positive Rate
Partly
Xiang et al. A Supervised Approach to Predict Company Acquisition with Factual and Topic Features Using Profiles and News Articles on TechCrunch 2012 Bayesian Network 69.4% (average) True Positive Rate X
25
3. METHODOLOGY
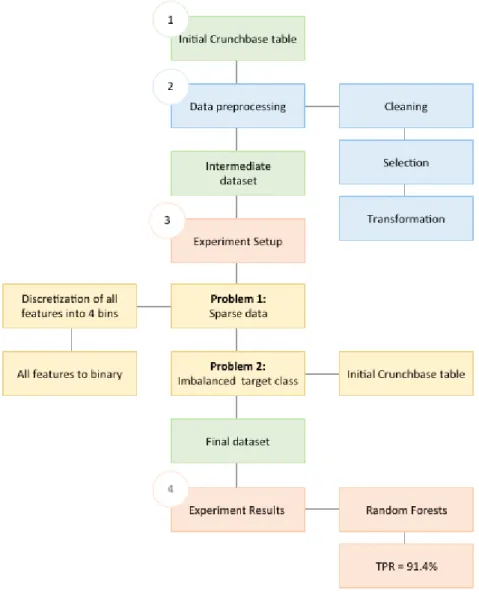
The methodology here applied (Figure 12 – Methodology Overview) mirrors a loose interpretation of Knowledge Discovery in Databases (KDD) approach (Fayyad et al., 1996): (1) Selection of data to be processed by defining relevant tables from the entire structured CrunchBase database; (2)
Preprocessing, by cleaning, Selecting and Transforming data. At this stage we deal with missing
values, outliers, discretization, and other common problems. An explorative analysis is made before further transformations; (3) Experiment Setup, where evaluation metrics are defined, and the two major problems of the dataset - Sparsity and Imbalanced target classes, are dealt with. Both these problems are only addressed at this stage. Several machine learning algorithms are chosen to test a binary classifier to classify the observations as either “successful” or “not-successful”; (4) Experiment
Results, where we draw conclusions and interpret results.
26
3.1. D
ATAC
OLLECTION ANDS
ELECTION(C
RUNCHB
ASEC
ORPUS)
The data used in the present work is the entire structured database from the website CrunchBase.com and was acquired on 2017-01-23. The data is created and edited by its users and moderators. It is important to disclaim that the access to the data was given to the author for an Academic License and to be used exclusively for the present work.
Despite being community based, especially for small-to-medium companies, its value is not to question. It has been an invaluable resource for multiple different companies as venture capitals, consulting companies (Deloitte, Oliver Wyman), marketing and sales platforms (Engagio, Datanyze) and previous academic studies (“Customer Stories | Crunchbase Data Solutions,” 2017; Liang & Daphne Yuan, 2012; Yuxian Eugene & Daphne Yuan, 2012). The website is a referenced database for all start-up ecosystem and investors in general.
As of 2017-01-23, the database from CrunchBase consisted of 20 tables in CSV (comma-separated-values) files:
Name Observations Selected
organizations 495 798 • people_descriptions Na people 422 032 • organization_descriptions Na jobs 996 453 • competitors 520 137 • funding_rounds 153 412 • customers 304 323 • investments 237 668 • investors 50 319 • events 33 211 acquisitons 35 532 • investment_partners 44 525 • ipos 11 986 • schools 10 891 event_relationships 7 717 org_parents 6 942 • funds 5 611 • category_groups 737 awards 38
Table 2 - CrunchBase Database
Note: To produce a dataset for the training task, only tables marked ‘Selected’ column will be used. People_descriptions, organization_descriptions are descriptive tables of people and organizations and do not have pertinent information for this work. The tables events, event_relationships, schools and awards are also out of scope and do not possess relevant information. All the selected tables will provide data converging in organizations table therefore acting as support tables.
27
3.2. D
ATAP
RE-
PROCESSING“If there is much irrelevant and redundant information present or noisy and unreliable data, the knowledge discovery during the training phase is more difficult”.
(Kotsiantis, Kanellopoulos, & Pintelas, 2006)
Data pre-processing can often have a critical impact on general performance of a supervised machine learning task. The process will follow general changes (as transversal to all thirteen tables in-use) and changes made to the organizations table as it is where all relevant information converges, ultimately becoming the training dataset of the task at hands. Due to the nature of the data and problem the priority is understanding its interdependence and not minimizing correlations.
The data pre-processing consists in a 3-step process:
• Data cleaning, where the author aims to remove all redundant and irrelevant information from the database as well as duplicates, missing values and outliers. The explanation of this process is divided between specific changes in the ‘Organizations’ table and general changes made transversely in all tables;
• Data selection, where the context of the study (i.e., social-demographic criteria) is defined to filter which data will be taken into the final dataset and
• Data transformation, consisting on the process of creating new variables or aggregating data from different tables into organization’s table.
28
3.2.1. Data Cleaning
“Data cleaning is a time-consuming and labor-intensive procedure but one that is absolutely necessary for successful data mining.” (Witten et al., 2000)
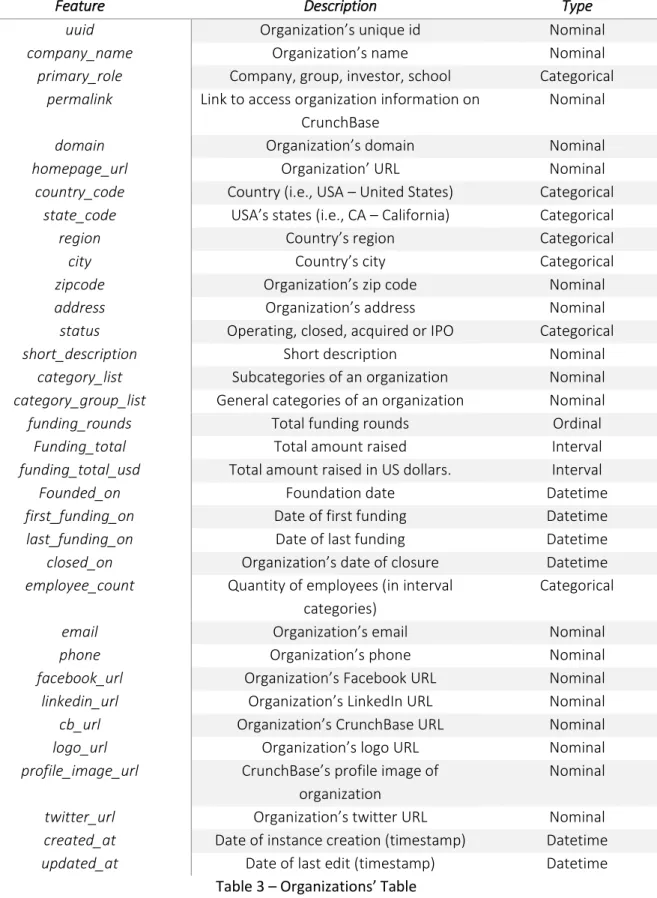
Feature Description Type
uuid Organization’s unique id Nominal
company_name Organization’s name Nominal
primary_role Company, group, investor, school Categorical
permalink Link to access organization information on CrunchBase
Nominal
domain Organization’s domain Nominal
homepage_url Organization’ URL Nominal
country_code Country (i.e., USA – United States) Categorical
state_code USA’s states (i.e., CA – California) Categorical
region Country’s region Categorical
city Country’s city Categorical
zipcode Organization’s zip code Nominal
address Organization’s address Nominal
status Operating, closed, acquired or IPO Categorical
short_description Short description Nominal
category_list Subcategories of an organization Nominal
category_group_list General categories of an organization Nominal
funding_rounds Total funding rounds Ordinal
Funding_total Total amount raised Interval
funding_total_usd Total amount raised in US dollars. Interval
Founded_on Foundation date Datetime
first_funding_on Date of first funding Datetime
last_funding_on Date of last funding Datetime
closed_on Organization’s date of closure Datetime
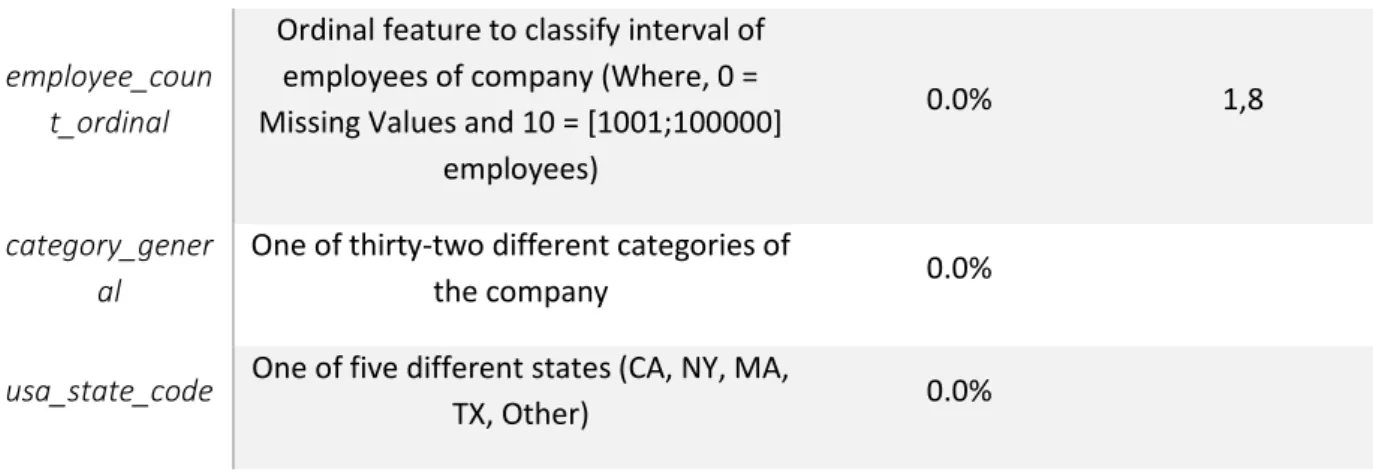
employee_count Quantity of employees (in interval categories)
Categorical
email Organization’s email Nominal
phone Organization’s phone Nominal
facebook_url Organization’s Facebook URL Nominal
linkedin_url Organization’s LinkedIn URL Nominal
cb_url Organization’s CrunchBase URL Nominal
logo_url Organization’s logo URL Nominal
profile_image_url CrunchBase’s profile image of organization
Nominal
twitter_url Organization’s twitter URL Nominal
created_at Date of instance creation (timestamp) Datetime
updated_at Date of last edit (timestamp) Datetime
29 The first step of pre-processing consists on treating all the irrelevant and redundant information present in tables. As a free-to-edit database with multiple purposes, the CrunchBase dataset has several columns (features) and instances (observations) whose context don’t match the objective of predicting a start-up’s success.
From the ‘Organizations’ table:
- Deleted region, city, zip_code, address as they provide too much granularity.
- Deleted domain, homepage_url, cb_url, facebook_url, linkedin_url, logo_url, twitter_url, profile_image_url, short_description; name, email and phone as irrelevant features.
- Deleted funding_total (as we only need funding_total_usd, a standardized version in U.S dollars allowing comparisons between the funding of companies from different countries in the same currency.)
- Deleted category_list (a subgroup comprising 689 unique values to (sub) categorize an organization, as a specific methodology (3.2.3.1) was applied to define a single category for an organization, this column ceased to be relevant).
It is also important to evaluate the redundancy of certain observations by looking for the presence of duplicates:
General changes:
30 The second step consists on eliminating noisy or unreliable data being the two most common cases of inconsistencies, Missing Values and Outliers. A Missing value (or missing data) is a variable that has no data value stored in an observation. Missing values are a common occurrence and can have a significant effect on the conclusions that can be drawn from the data. “Most machine learning methods make the implicit assumption that there is no particular significance in the fact that a certain instance has an attribute value missing: the value is simply not known.” (Witten et al., 2000). Although they may occur for several reasons (such as malfunctioning measurement equipment, changes in variable definition during data collection), the most probable cause for missing values in this dataset is simply because the creator of the profile didn’t put all the information on the database’s profiles, hence making it incredibly difficult to separate sparse data from missing values in the current context.
Following the premise, “as the amount of data decreases, the rate of increase in accuracy grows” (Kotsiantis et al., 2006), the following instances in the organizations table were simply deleted as the features may still have relevant information for the predictive task.
From the ‘Organizations’ table:
- Deleted instances with missing values for primary_role, status, country, category_group, and founded_date;
Outliers are excessively deviating values from the scale of the feature. (Kotsiantis et al., 2006) An example of an outlier found in the dataset can be an extremely high “total funding in USD” (i.e. total_funding_usd = $B 30000, read, thirty thousand billion dollars) of a specific company, probably due to an incorrect conversion from a different currency by the user who edited the organization’s page. Observations with excessively deviating values were deleted.
From the ‘Organizations’ table:
- Deleted outliers for funding_total_usd, #funding_rounds.
Another type of inconsistent data can be misspellings or contradictory values, especially due to the crowdsource nature of the in-use database. Wrong dates or presence of letters in numerical features are examples of frequently present inconsistent data.
General Changes:
- Deleted instances where closed_on is before founded_on, generating negative age (in #years).
31
3.2.2. Data Selection
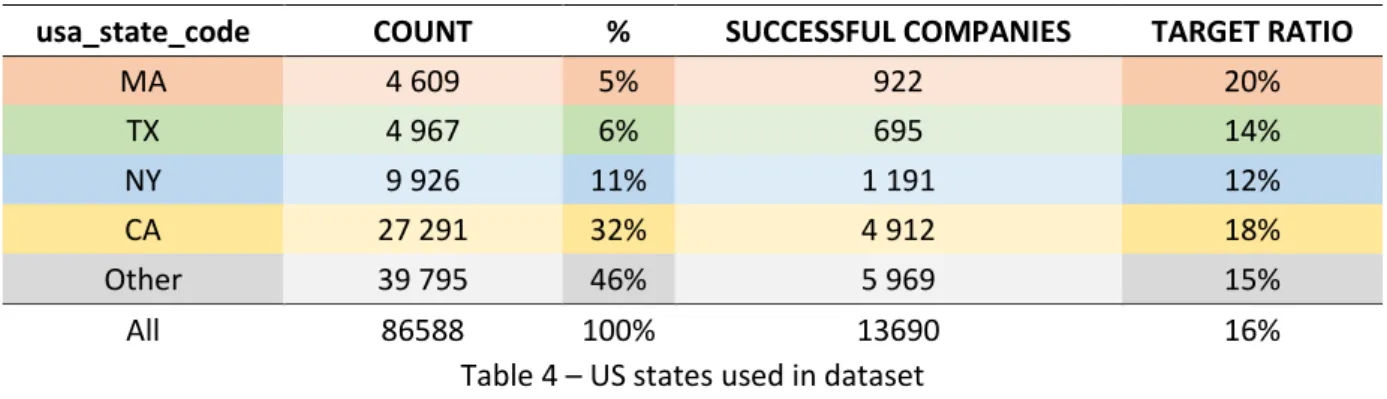
Before further advancements in the experiment setup of the dataset it is important to contextualize what will be the subject of study and filter data. Due to the context of the present the study only the companies from the United States were selected to be part of the training dataset. They were categorized as: CA (California), NY (New York), TX (Texas), MA (Massachusetts) and Other (consisting on the remaining states):
- Being part of American website of tech news TechCrunch, it means every article has referenced data from the database. More quality of information and media coverage means more revisions and curated information;
- Platform’s only language is English which limits the input of some features by foreign users like correct values for currencies;
- Similar strategy used by Xiang et al., (2012), although they used regions instead of states. Also, CrunchBase only started to export international start-ups and other profiles in 2014 (Lennon, 2014);
- California is, historically and currently, the most important place for tech companies worldwide (Weller, 2016);
- Top 5 most-represented states.
usa_state_code COUNT % SUCCESSFUL COMPANIES TARGET RATIO
MA 4 609 5% 922 20% TX 4 967 6% 695 14% NY 9 926 11% 1 191 12% CA 27 291 32% 4 912 18% Other 39 795 46% 5 969 15% All 86588 100% 13690 16%
Table 4 – US states used in dataset
Companies with founding date between 1985 and 2014: Although some of this companies can’t be
considered start-ups anymore due to their advanced age without a success event, they were at some point and some had events as funding rounds who potentially brought them closer to success, so these companies will stay in the dataset. A similar strategy was used by Xiang et al., (2012). The rationale behind this decision relies on the assumption that companies need time to mature and show results. At the same time, we cover the Dot-com bubble in 1997 & World crisis 2008.
32
Companies with at least one review of its profile 90 days after its creation: Users and moderators
can both review company profiles. By only having access to date of creation and date of last modification, the author filtered companies with at least a 90-day difference between the two. This transformation allows two main advantages: it limits the number of fake and incomplete company profiles and guarantees that profiles were subject to a review in a 90-day period.
Companies with category: To try to compare results with previous publications and being a category
of a company something that influences, among other factors, its average age of success the author chose to only take companies with a category to further analysis; The company’s category reflects both its industry as well as if it is a tech company or not.