.com http://www.bipublication
Research Article
An Intelligent Method for Data Classification by Proposing a Value for
Fields Missing Any Values On The Basis Of Recommendation Systems and
K-Means Clustering
Elham Bozorgzadeh1,2, Mashallah Abbasi Dezfuli*1,2
and Mohammad Reza Noorimehr1,2
1 Department of Computer, Khouzestan Science and Reaserch Branch,
Islamic Azad University, Ahvaz, Iran
2 Department of Computer, Ahvaz Branch,
Islamic Azad University, Ahvaz, Iran
*Corresponding Author: [email protected], [email protected], [email protected]
ABSTRACT:
Data-mining is a procedure to extract knowledge from available data, and it has been taken into account in various sciences. All sciences dealing with Data-mining suffer from fields missing the value. when a field misses a value, it is difficulty considered in the algorithms. In other words, when a classifier is designed to locate the samples in their own classification, this feature missing the value creates some problems. Therefore, a procedure must be taken into account to solve this problem, and to increase classification precision. The method proposed in this article ties to fill the fields missing the value.
The method proposed in this article includes three basic steps that involve finding similar samples, estimating the fields missing the value and computing the classification precisely after completing the fields missing the value. The results show that the values obtained by proposed method are more efficient than previous methods.
Keywords: Data-mining, Missing Values, Recommender Systems, Collaborative Filtering, k-Means Clustering.
[I] NTRODUCTION
Data-mining term is originated from mountain excavation to find main nervure of ore. Data mining is the process of basic and efficient information link correlations, changes, anomalies and considered structures from data stored in data bases, data storage or other information centers [1]. Knowledge is different and useful points alone. Data are converted to information by detailed processing. Then, statistical and modeling methods are applied on information so that some patterns are extracted.
There are three problems in terms of fields missing the value, these problems are as follows[2].
1) Performance reduces.
2) data processing and analysis is complicated. 3) Due to the difference between complete and in-complete data, bios and processing possibility is high.
of S neighbor, we fill the fields by S samples missing the value.
2. Literature Review
By increasing stored data in data base for data mining, there are some challenges among sample methods with efficiency and salability. Therefore, other methods have been highly used like machine learning. In the following parts, we study the methods in the field of Data-mining, and we focus on filling the fields missing the value. The most important methods to handle the fields missing the value are as follows:
2.1. Deleting cases with missing attribute values
This method is applied on the basis of ignoring the fields missing the value, and it is known as “deletion list” , “case deletion” or “complete case analysis” in statistics. In this method, all samples involving the field missing the value are removed from data set. Yu and his colleagues used practical data. They tried to focus on this topic. By investigating the characteristics of drop-out individuals, they tried to predict that which students are drop-out students [3].
2.2. The most common value of an attribute
This method is one of the most simple methods to study the value of the field missing the value. Substituted value equals with the highest common value of the column in that field. Namata and Getoor carried out a research in the field of data related to graph. Used data are incomplete data, their research so that efficiency of the presented method is highly proved [4].
2.3. Assigning all possible attribute values to a missing attribute value.
This approach was presented in article [5] for the first time. Each sample involves the field missing the value is replaced by a set of samples, and missing attribute value is substituted by all values.
2.4.replacing missing attribute values by attribute mean
This method is used for data set with numerical signs. In this method, each missing value is
replaced by arithmetic mean of related field values.
Twisk and his colleagues studied data in terms of longitude, since data are in numbers field, and they are different, they replaced missing attribute value with attribute mean [6].
2.5. Global Closest fit
The method of global closest fit is on the basis of replacing a missing attribute value with a determined value in another sample and it is similar to the sample involving the field missing a value.
Gaur and Duluwat tried to fill the fields missing data in the field of oil and gas by using the method of global closest fit, and they classified them into gas, oil and coal [7,8].
2.6. Using community rules
Code generation algorithm like Apriori [9] is used to present rules on the basis of fields having a value. Consider the following rule in which A and B are fields having a value, and C is the field missing a value: IF A=1 and B=0 THEN C=0.5 Wenfei and Geerts tried to present rules and they considered some limitations. They tried to detect the fields missing a value. Also, they identified missing records of data[10].
3. Using recommendation systems in the proposed method
Recommendation systems scientifically refer to systems presenting suitable suggestions to the users. The recommendation systems are based on cases or individuals similarity. As an example, if we can find similar S person, we can suggest
shopping and political interests and
entertainments of S person to similar persons. Now, suppose that we can generalize this subject to data in data mining. In other words, it is tried to obtain similar samples of S sample (involving the field lacking f value), and to use it to estimate f field value for S sample[11].
4. Details of the proposed method
4.1. Stage 1: Finding the neighbors
Suppose that used data base involves N sample (R1-: i=1,…,N). M field (Fi: i=1,…,M) has been
evaluated for each sample. Then, the matrix involves N rows and M columns, and it is presented in figure 1. Neighbors of sample S are samples that are similar to sample S.
Music 1
Music 2 … Music
M
User 1 W11 W12 … W1M
User 2 W21 W22 … W2M
User 3 W31 W32 … W3M
… … … … …
User N WN1 WN2 … WNM
Figure 1: scheme of matrix related to data
In order to select the similar samples, various methods have been used so that the best one is considered. The methods used to compute the distance between two samples similar to two vectors are presented in the following parts. If we show the distance of two vectors by d: o<d<1, their similarity is equal to (1-d). Distance is computed between the sample S and other samples. We select sample H (N>H) having less distances as the neighbor of sample S. Used distance criteria are as follows:
4.1.1. Euclidean
The distance of two n-dimensional points involving P and Q is obtained by equation (1)
(1)
4.1.2. City block
The distance of two n-dimensional points involving P and Q is obtained by equation (2):
(2)
4.1.3. Chebyshev
The distance of two n-dimensional points involving P and Q is obtained by equation (3):
(3)
4.1.4. Cosine
The distance of two n-dimensional points involving P and Q is obtained by equation (4):
(4)
4.1.5.Jaccard
The distance of two n-dimensional points involving P and Q is obtained by equation (5):
(5)
4.2. Step 2: suggesting the value by using neighbor samples
After finding H neighbors of sample S, values available field f of neighbors to estimate the value of field f in sample s. It is estimated by using weighted mean on the basis of the similarity between each neighbor and sample S.
(6)
As it is clear in equation (6), weighted mean of field f value in the samples similar to sample s is used to compute new value for field of from sample s missing a value. A weight of this mean is similarity of sample s with each of neighbor samples. Symbols of equation (6) have been explained in table 1.
Table 1: Describing symbols of equation (6) similarity of s with each of
neighbor samples SIM(Ri,S) The new suggested value for field f
from sample S by using collaboration
Sc-new(f)
The value of samples similar to
sample S in field f Ri(f)
The number of samples of neighbor
S (similar to s) H
This mean is weighted because the effect of each sample to compute the value of field f from sample s must be similar to sample S. In other words, the sample having more similarity has more effects.
4.3) step 3: suggesting a value by using data clustering
clustering is used. After modeling data in M-dimensional space, K-means method is used, and neighbor samples are divided into different K clusters. Then a cluster in which sample S is located is considered. In this step, suggested value of field f is equal to the value having the most iterations in the samples of this cluster.
4.4) Step 4: Computing the proposed value by using two suggested values for steps 2 and 3:
In order to compute the proposed value of field missing a value, harmonic mean of values obtained from steps 2 and 3 is obtained. Harmonic mean, like various kinds of means, measures orientation toward the center. It is different in terms of application. When data have different value, harmonic mean is used [12]. When we want to obtain the mean of two or more values that are different in terms of importance, harmonic mean presents more suitable results in comparison to geometric and arithmetic means [13]. Values suggested in steps 2 and 3 are important. Although the objective of step 3 in the proposed method is to provide an opportunity is higher, general subject faces with failure. The purpose of using recommendation systems is to use similar samples, and this is clear in steps 2 and 3. Equation (7) shows computing harmonic mean.
If there are n data for computing mean, all data are firstly reversed and summed up:
(7) In the procedure proposed in this article, there
are two values involving Sc-new(f). Their harmonic mean is computed by using equation (8). Snew(f) is the value proposed in this article for the field missing f value.
(8)
4-5) step 5: Obtaining classification precision
After computing the value proposed in this article for all fields missing the value in data, classification is computed precisely. The clear point is that the proposed method must be
considered along with other methods. In other words, there are two basic points in this step: 1) A classifier must be selected for all methods 2) Classification precision is measured by the
fields missing a value, and it is shown by accmiss. Then, the methods of filling the fields
missing the value are used, and their value is computed. After computing the value proposed in this article and other methods, a classifier is applied, and classification precision is obtained for each method. accmiss and the precision of
investigated methods are compared, and the best precision is selected. The method that can improve accmiss more than other methods is
more suitable method.
5. Using the proposed method in non-numerical fields
Estimating letter fields, binary and sequential fields are more difficult than numerical fields. We consider conversion of this kind to numerical one to estimate them, and this conversion is as follows.
1) A number is assigned to values belonging to sequential or letter field. For instance, in terms of individuals’ hair color, different hair colors of individuals are listed, and natural numbers (1,2,3) are assigned to them.
2) We show binary fields with Zero and one, and these numbers are considered as the numbers of numerical fields.
6. Obtained results and discussion
Except the cases mentioned in section 3, other methods have been presented in various articles, but all of them are not studied in this article. Therefore, researchers refer to some methods more than others, and these methods are considered as the method having higher applications, and their results should be compared.
These data bases are database related to breast cancer, hepatitis, dermatology liver patient and lung cancer. The characteristics of these five medical collections can be observed in tables 2-6.
Table 2: characteristics of breast cancer data base [14]
D at a b a se ch ar ac te ri st ic s m u lt ip le v al u es th e n u m b er o f sa m p le s 6 9 9 In v e st ig at ed fi el d m e an l if e fi el d t y p e n u m er ic al F ie ld n u m b er s 1 0 p u b li c at io n d at e 1 9 9 2 /7 /1 5 F o r u se cl as si fi ca ti o n fi el d m is si n g th e v al u e h as T h e n u m b er o f sc ie n ti fi c re fe re n c es t o th is b as e 1 6 6 7 2 5
Table 3: Characteristics of hepatitis data base [14]
D at a b a se c h ar ac te ri st i cs m u lt ip le v al u es th e n u mb e r o f sa mp le s 1 5 5 In v est ig a te d fi el d m ea n l if e fi el d t y p e L et te r, n u m er ic al F ie ld n u mb e rs 1 9 p u b li ca ti o n d at e 1 9 8 8 /1 1 /1 F o r u se cl as si fi c at io n fi el d mi ss in g th e v al u e h as T h e n u mb e r o f sc ie n ti fi c re fe re n c es to t h is b ase 9 3 7 6 8
Table 4: Characteristic of dermatology data base [14]
D at a b a se ch ar ac te ri st i c s m u lt ip le v al u es th e n u mb e r o f sa mp le s 3 6 6 In v e st ig a te d fi e ld m e an l if e fi el d t y p e L et te r, n u m er ic al F ie ld n u mb e rs 3 4 p u b li c at io n d a te 1 9 9 8 /1 1 /1 F o r u se cl as si fi ca ti o n fi e ld mi ssi n g th e v al u e h as T h e n u mb er o f sc ie n ti fi c re fe re n ce s to t h is b ase 6 5 2 6 6
Table 5: characteristics of liver patient data base [14]
D a ta b ase ch ar ac te ri st i c s m u lt ip le v al u es th e n u mb er o f s a mp le s 5 8 3 In v e st ig at ed fi e ld m e an l if e fi e ld t y p e n u m er ic al F ie ld n u mb er s 1 0 p u b li c at io n d a te 2 0 1 2 /5 /1 F o r u se cl as si fi ca ti o n fi e ld mi ssi n g th e v a lu e h as T h e n u mb er o f sc ie n ti fi c re fe re n ce s to t h is b a se 3 2 7 6 7
Table 6: Characteristics of lung cancer data base [14]
D at a b a se c h ar ac te ri st i cs m u lt ip le v al u es th e n u mb e r o f sa mp le s 3 2 In v est ig a te d fi e ld m e an l if e fi el d t y p e n u m er ic al F ie ld n u mb e rs 5 6 p u b li c at io n d a te 1 9 9 2 /5 /1 F o r u se cl as si fi ca ti o n fi el d m issi n g th e v al u e h as T h e n u mb er o f sc ie n ti fi c re fe re n ce s to t h is b ase 8 7 1 0 9
Table 7: The value of parameters for each data base The name of data
base N M H
breast cancer 699 10 69
hepatitis 155 19 15
dermatology 366 33 36
liver 583 10 58
lung cancer 32 56 3
Table 8:characteristics of samples involving the fields missing the value in each data base
The name of data base
Number of samples involving the field missing the value
the number of fields missing the value
H
breast cancer 16 1 69
hepatitis 75 14,7,6,5,4,3,2,1 15
dermatology 8 1 36
liver 5 1 58
lung cancer 5 1 3
After computing distance of all samples to the sample involving the field missing the value, we sort them in descending order, and we select sample H having least distance as neighbor distances. Then, maximum distance value is selected. By dividing all neighbors distances to this value, the value of all distances is located in range of [0,1]. If distance between the sample involving the field missing the value and the neighbor is equal to d, then similarity value is equal to 1-d.
It is clear that each sample has the highest similarity. Of course, since the sample involving the field missing the value does not involve a value, it cannot be considered in weighted mean in equation (6). This is true for other neighbor samples. In other words, the sample that does not involves a value in investigated field, it is not considered computation.
After computing the values estimated by the method proposed in this paper, a classifier must be applied, and precision must be measured. The most important principle that should be considered in step 5 is that classification applied on the proposed method and other methods
should be same. If classification procedure used in testing the proposed method is not as same as other methods, then comparison is not applied. Therefore, classification of k-nearest neighbor and 10-field cross validation is used to measure the performance and efficiency of the proposed method and all other methods. Previous results show that this classifier is suitable [15,16]. In order to compare all methods, difference mean of classification precision is used in data base. The procedure of computing difference mean of classification procedure is presented in the following sections.
Classification algorithm of 5-nearest neighbor is applied on 50data set obtained by 10-fold cross evaluation in 5 data bases. Classification precision difference is computed for 50 folds between precision obtained by estimating the value and precision without predicting the value ( breast cancer=63.1219, hepatitis, 62.4159,
dermatology=88.2490, liver=65.0420 lung
cancer=82.9857), and then their mean is computed, Negative values show that prediction of value is not efficient, and it has lower precision than the field missing a field. The results of computing precision in the proposed method and competitor methods have been presented in table 9.
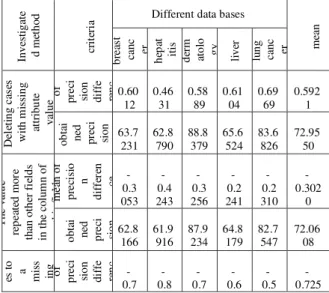
Table 9:The results of the proposed method and other methods
In
v
es
ti
g
at
e
d
m
et
h
o
d
cr
it
er
ia Different data bases
m
ea
n
b
re
as
t
ca
n
c
er
h
ep
at
it
is
d
er
m
at
o
lo
g
y
li
v
er
lu
n
g
ca
n
c
er
D
el
et
in
g
c
as
es
w
it
h
m
is
si
n
g
at
tr
ib
u
te
v
al
u
e
of pre
ci
si
o
n
d
if
fe
re
n
c
0.60 12
0.46 31
0.58 89
0.61 04
0.69 69
0.592 1
o
b
ta
i
n
ed
p
re
ci
si
o
n 63.7
231 62.8
790 88.8
379 65.6
524 83.6
826 72.95
50
T
h
e
v
al
u
e
re
p
e
at
ed
m
o
re
th
an
o
th
er
f
ie
ld
s
in
t
h
e
co
lu
m
n
o
f
th
is
f
ie
ld
m
e
an
o
f
p
re
ci
si
o
n
d
if
fe
re
n
ce 0.3 -053
-0.4 243
-0.3 256
-0.2 241
-0.2 310
-0.302
0
o
b
ta
i
n
ed
p
re
ci
si
o
n
62.8 166
61.9 916
87.9 234
64.8 179
82.7 547
72.06 08
es
t
o
a
m
is
s
in
g
o
f
p
re
ci
si
o
n
d
if
fe
re
n
c
-0.7
-0.8
-0.7
-0.6
-0.5
287 724 387 998 865 2 o b ta i n ed p re ci si o n 62.3 932 61.5 435 87.5 103 64.3 422 82.3 992 71.63 76 R ep la ci n g m is si n g at tr ib u te v al u e w it h m ea n v al u e o f p re ci si o n d if fe re n c 0.21 05 0.25 23 0.21 14 0.22 12 0.16 72 0.212 5 o b ta i n ed p re ci si o n 63.3 324 62.6 682 88.4 604 65.2 632 83.1 529 72.57 54 cl o se st m at ch m ea n o f p re ci si o n d if fe re n c
e -0.1 284 -0.1 573 -0.1 365 -0.0 982 -0.1 138 -0.126 8 o b ta i n ed p re ci si o n 62.9 935 62.2 586 88.1 125 64.9 438 82.8 719 72.23 60 U si n g co m m u n it y ru le
s mea
n o f p re ci si o n d if fe re n c e 0.71 17 0.81 01 0.70 03 0.80 05 0.54 62 0.713 7 o b ta i n ed p re ci si o n 63.8 336 63.2 260 88.9 493 65.8 425 83.5 319 73.07 66 T h e p ro p o se d m et h o d ( o n th e b as is o f e ac li d ea n m et h o d ) o f p re ci si o n d if fe re n c 0.81 95 0.79 21 0.82 18 0.82 31 0.84 17 0.819 6 o b ta i n ed p re ci si o n 63.9 414 63.2 080 89.0 708 65.8 651 83.8 274 73.18 25 T h e p ro p o se d m et h o d ( o n th e b as is o f ci ty b lo ck
) of
p re ci si o n d if fe re n c 0.81 94 0.78 98 0.81 68 0.82 17 0.84 88 0.819 3 o b ta i n ed p re ci si o n 63.9 413 63.2 057 89.0 658 65.8 637 83.8 345 73.18 22 T h e p ro p o se d m et h o d ( o n th e b as is o f ch eb y sh ev m et h o d ) m ea n o f p re ci si o n d if fe re n ce 0.81 44 0.76 23 0.81 84 0.82 34 0.84 79 0.813 2 o b ta i n ed p re ci si o n 63.9 363 63.1 782 89.0 674 65.8 654 83.8 336 73.17 61 T h e p ro p o se d m et h o d ( o n th e b as is o f Ja cc ar d of p re ci si o n d if fe re n c 0.82 61 0.79 53 0.80 58 0.82 40 0.88 53 0.827 3 o b ta i n ed p re ci si o n 63.9 480 63.2 112 89.0 548 65.8 660 83.8 710 73.19 02 T h e p ro p o se d m et h o d ( o n t h e b as is o f co si n e m et h o d ) m ea n o f p re ci si o n d if fe re n ce 0.81 66 0.75 62 0.81 03 0.81 96 0.88 04 0.816 6 o b ta i n ed p re ci si o n 63.9 385 63.1 721 89.0 593 65.8 616 83.8 661 73.17 95 Increasing classification method by using
proposed method is clearer than other well-known methods. In table 9, it is clear that the best performance is the method presented in this article is based on Jaccard distance for data bases of breast cancer, liver and lung cancer. In addition, the method proposed in this article performing by using Euclidean distance the best
performance in data base of dermatology and by using community rules, performs on hepatitis data base. Generally, the best performance is related to the method proposed in this article, and it performs by using Jaccard distance. Priority of the proposed method is specified on the basis of all methods of determining distance in table 9. Hence, it can be concluded that the method framework of this paper is suitable.
7.CONCLUSION AND FUTURE
RESEARCHES
The proposed method performs on the basis of the following procedures and steps, and methods based on recommendation systems are used to fill the fields missing the value. The first step is to find neighbors. Finding neighbor samples mean the samples that are highly similar to sample S. The number of neighbors is considered constant. Then, a proposed value is obtained from weighted mean of field f value in neighbor samples of sample s. Another proposed value is detected by using data clustering. This step is considered to prevent the bias of estimated procedure. Firstly, data are clustered by using k-mean method. The value with maximum iteration in field of is used. Also, proposed values computed in harmonic mean equation are used, and a value is proposed for the field missing value f.
The most important characteristics of the presented method are as follows:
1) Suggesting the value on the basis of recommendation systems based on collaboration 2) preventing the bias in estimation by applying
clustering
subject is studied in other parts of this particle such as the following points:
1) Generalization of the proposed method: The attempts to generalize the proposed method to predict non-numerical fields value help the efficiency of mentioned method. Intelligent assignment of numerical value helps to improve the method of this article.
2) Increasing implementation speed: since it’s necessary to find a neighbor for all samples involving missing value, a method should be used for implementation. If it is applied on large data sets, it should have suitable speed.
3) Using the mentioned method in the field of different sciences and their data: Data of different
sciences have special characteristics.
Theoretically, it cannot be claimed that a method results in more suitable performance and efficiency for all sciences. Therefore, it should be evaluated for data of this science.
REFERENCES
1. Gaur, Sanjay, and M. S. Dulawat. "A perception of statistical inference in data mining." International Journal of Computer Science and Communication 1.2 (2010): 653-658.
2. Farhangfar, Alireza, Lukasz Kurgan, and WitoldPedrycz. "A novel framework for imputation of missing values in databases." Systems, Man and Cybernetics, Part A: Systems and Humans, IEEE Transactions on 37.5 (2007): 692-709.
3. Yu, Chong Ho, Samuel DiGangi, Angel Jannasch-Pennell, and Charles Kaprolet. "A data mining approach for identifying predictors of student retention from sophomore to junior year." Journal of Data Science 8, no. 2 (2010): 307-325.
4. Namata Jr, Galileo Mark S., and LiseGetoor. "Identifying graphs from noisy and incomplete data." In Proceedings of the 1st ACM SIGKDD Workshop on Knowledge Discovery from Uncertain Data, (2009): pp. 23-29. ACM.
5. Grzymala-Busse, Jerzy W. "On the unknown attribute values in learning from examples." Methodologies for intelligent systems. Springer Berlin Heidelberg, (1991): 368-377.
6. Twisk, Jos, Michiel de Boer, Wieke de Vente, and Martijn Heymans. "Multiple imputation of missing values was not necessary before performing a longitudinal mixed-model analysis." Journal of clinical epidemiology 66, no. 9 (2013): 1022-1028. 7. Gaur, Sanjay, and M. S. Dulawat. "A closest fit
approach to missing attribute values in data mining." International Journal of advances in Science and Technology 2, no. 4 (2011): 18-24. 8. Gaur, Sanjay, and M. S. Dulawat. "Improved
Closest fit Techniques to handle missing Attribute values." Journal of Computer and Mathematical Sciences Vol 2, no. 2 (2011): 170-398.
9. Agrawal, Rakesh, and RamakrishnanSrikant. "Fast algorithms for mining association rules." Proc. 20th int. conf. very large data bases, VLDB. (1994): Vol. 1215.
10.Fan, Wenfei, and FlorisGeerts. "Capturing missing tuples and missing values."Proceedings of the twenty-ninth ACM symposium on Principles of database systems. ACM, (2010): SIGMOD-SIGACT-SIGART.
11.Vialardi, Cesar, Javier Bravo Agapito, Leila ShilaShafti, and Alvaro Ortigosa. "Recommendation in higher education using data mining techniques." (2009): 25-34.
12.Hidegkuti, Powell, Lecture Notes, “Arithmetic, Geometric, and Harmonic Means”, (2009): pp 65-84.
13.Sharma, R. “Some more inequalities for arithmetic mean, harmonic mean and variance,” Journal of Math Inequality, (2008): vol. 2, pp. 109–114. 14.UCI dataset. Available on:
http://archive.ics.uci.edu/ml/
15.Munirah Y, “The Impact of missing value methods and normalization Techniques on the performance of data mining models” [dissertation], University of Utara Malaysia; 2011: 87-101.
![Table 2: characteristics of breast cancer data base [14]](https://thumb-eu.123doks.com/thumbv2/123dok_br/18140934.326418/5.892.470.781.189.707/table-characteristics-breast-cancer-data-base.webp)