Quantitative Analysis of
Shared Workspace Usability
António Ferreira
Pedro Antunes
DI-FCUL
TR–05–16
September 2005
Departamento de Informática
Faculdade de Ciências da Universidade de Lisboa
Campo Grande, 1749-016 Lisboa
Portugal
Technical reports are available at http://www.di.fc.ul.pt/tech-reports.
The files are stored in PDF, with the report number as filename. Alternatively, reports are available by post from the above address.
1
Quantitative Analysis of Shared Workspace Usability
António Ferreira, Pedro Antunes
Departamento de Informática
Faculdade de Ciências da Universidade de Lisboa Campo Grande, 1749-016 Lisboa, Portugal
ABSTRACT
In this paper we propose a discount analytical approach for quantita-tively evaluating shared workspace usability. We started with exist-ing models of human performance, developed in the Human-Com-puter Interaction field and thus focused on single user interactions, and studied the benefits of extending them to collaborative scenar-ios. The obtained results indicate that the proposed approach: (1) fa-cilitates the fine-grained analysis of intensive concerted work sce-narios; (2) provides quantitative estimates of collaborative actions performed in shared workspaces; and (3) affords comparing alterna-tive design decisions, using shared workspace usability metrics de-rived from the aforementioned quantitative estimates.
Categories and Subject Descriptors
H.1.2 [Models and Principles]: User/Machine Systems—Human Factors, Human Information Processing; H.5.2 [Information
In-terfaces and Presentation]: Group and Organization InIn-terfaces—
Evaluation/Methodology, Synchronous Interaction.
General Terms:
Design, Human Factors, Performance.Keywords:
Shared Workspace Usability, Quantitative Analy-sis, Intensive Concerted Work, Discount Approach.1. INTRODUCTION AND MOTIVATION
Collaborative technologies place many challenges to usability evaluation, motivated by the number of users necessary to partici-pate in the evaluation processes and the required control over tech-nological factors and variables related to the group, task and context [7,5]. The complexity and cost associated to usability evaluation may be impeding the emergence of more successful groupware de-signs—highly usable and useful to individuals, work groups, and or-ganizations.
Several discount methods have recently emerged with the purpose of reducing the complexity and cost of groupware usability evaluation. Many of them are adaptations of discount methods applied to single-user software (or singleware), such as groupware walkthrough [17], groupware heuristic evaluation [2], groupware usability inspection [18], and scenario based evaluation [6].
In this paper our research focus is on a particular type of groupware: the one that supports people working together in an intensive con-certed effort towards a shared goal. Concon-certed work requires a sig-nificantly high level of workspace awareness, because individual ac-tions affect the outcomes of the other members [14].
This specific type of groupware poses even greater challenges to groupware usability evaluation, caused by the requirement to ana-lyze the low-level details of individual and collaborative actions in shared workspaces, usually performed in very dynamic contexts.
Furthermore, the impact of small design decisions on groupware support for concerted work scenarios is much higher than in other collaborative contexts, where the focus may be on more abstract ac-tivities, such as group decision making.
A set of analytical techniques have been developed in the Human-Computer Interaction field addressing the two concerns mentioned above: discount and attention to detail. These techniques rely on models of human performance to analyze usability problems and es-timate task execution times of interactive tools. In this set we in-clude the GOMS (Goals, Operations, Methods and Selection Rules) family of techniques [8], in particular the KLM (Keystroke-Level Model) [3,4].
These human performance models fall into the category of discount methods because they provide an analytic approach that can be ap-plied without the participation of users and even without a prototype being developed [9]. Such models have been successfully used to benchmark many singleware design solutions [8].
As we show in the related work section, human performance models have mostly been used with singleware. In this paper we expand previous research on the possible benefits of using them with groupware [1].
We argue that human performance models contribute to groupware usability evaluation with additional insights about groupware design issues that are not covered by the other methods. The advantages of this approach emerge from the following fundamental characteristics of human performance models:
□ Afford studying alternative design solutions in an analytical way [12,10]. This approach may save design time and effort by re-ducing the number of iterations and empirical tests necessary to revise and improve an initial design;
□ Elucidate the assumed mechanisms and capabilities of the human processing system [3], which may be instrumental to develop more useable groupware tools;
□ Specifically address situations where users accomplish tasks that they already master [8], disentangling the fine-grained details of concerted work;
□ Offer quantitative estimates of human performance [3,8] which may be extrapolated to groupware interaction.
The paper is organized as follows. We start with a discussion of re-lated work. Next, we describe an intensive concerted work scenario that will be the central case in our analysis. We proceed with the analysis of the case using our proposed approach. Then, we evaluate and compare an alternative design, and discuss the benefits and limi-tations in our approach. We finish the paper with a summary of con-tributions and future work.
2
2. RELATED WORK
Groupware walkthrough is a method adapting single-user cognitive walkthrough to the analytical evaluation of groupware [17]. It is based on the representation of collaborative activities using a set of mechanics of collaboration, i.e. fundamental types of collaborative interactions. Having this representation, a group of expert evaluators reviews and analyzes how the users’ goals are supported. The major adaptations of cognitive walkthrough to the groupware context re-sult from filtering out single-user actions and attaching the appropri-ate mechanics to typical collaborative tasks.
Another analytical method is groupware heuristic evaluation [2]. This method, adapted from single-user heuristic evaluation, relies on a small set of inspectors visually reviewing the compliance of a groupware tool with a list of heuristics. As with the groupware walkthrough approach, the list of heuristics is founded on the me-chanics of collaboration.
Considering that both groupware heuristic evaluation and groupware walkthrough are dependent on the quality of the task analysis, a new approach, called CUA (Collaboration Usability Analysis) appeared as an improved version of the mechanics of collaboration [16]. It is interesting to compare the CUA and human performance model approaches. Both analyze tasks using hierarchical decompositions but with significant differences in the intended level of detail. The CUA lowest granularity reduces collaboration tasks to the mechan-ics performed by users in shared workspaces, such as writing a mes-sage or obtaining a resource. Human performance models decom-pose tasks at a much lower level of detail; for instance, KLM analyses tasks at single keystrokes.
Single keystrokes are most times unrelated with collaborative work, notably when group decision making is involved, which is a strong argument in favor of high-level approaches such as CUA. However, we argue that going down to the keystroke level may provide addi-tional insights about how users interact with groupware tools in concerted work situations. We provide two orders of reasons to sup-port this argument:
□ In concerted work, individual and group tasks are highly inter-twined, so that individual tasks necessarily influence collabora-tive tasks and vice versa [14];
□ Concerted work involves people performing repetitive and highly-mastered tasks, for which the human performance models have demonstrated good estimates [8].
We therefore hypothesize the design of collaborative tools for con-certed work scenarios—where the designer may find necessary to optimize the effort applied by users in low-level tasks, even if only indirectly related with collaboration—may benefit from human per-formance analysis.
Nonetheless, the application of human performance models in the groupware context is very rare in the literature. DGOMS (Distrib-uted GOMS) is an extension of GOMS to the group level of analy-sis [13]. The approach regards group work at a high level of detail, as a group task that can be successively decomposed in group sub-tasks until individual sub-tasks can be identified. A new type of opera-tor, called communication operaopera-tor, is then defined to coordinate in-dividual tasks executed in parallel. Therefore, this approach does
not address concerted but coordinated work. As mentioned above, we focus on concerted work.
A similar approach is also suggested in a recent study of GOMS ap-plied to a complex task executed by a team of users [11]. The task involved several users monitoring a display and executing actions in a coordinated way via a shared radio communication channel. As in the previous case, the study does not address concerted work.
3. CASE DESCRIPTION
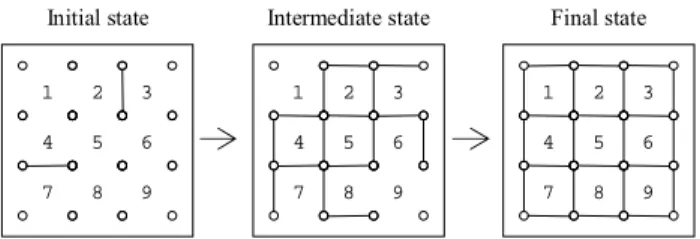
The case explores a scenario of intensive concerted work involving a team with two members, Sophie and Charles, who work in differ-ent places. Sophie is highly trained in drawing vertical connection lines, while Charles is an expert in making horizontal connections. Given a board filled with points, the team has to quickly connect all adjacent points using a groupware tool, as illustrated in Figure 1.
Figure 1. Team work produces connections between all points
The board is characterized by a square arrangement of contiguous cells, numbered 1 to 9 in the example in Figure 1, and by an initial state that contains at least one horizontal and one vertical connec-tion lines (these two lines are seeds for the team activity).
The groupware tool has two workspaces which serve the following purposes: a) the shared workspace displays a public up-to-date view of the board; and b) the private workspace allows connecting points in a cell with horizontal or vertical lines, depending on the expertise of the team member. To simplify our analysis, we restrict the user interactions to a mouse with a single button.
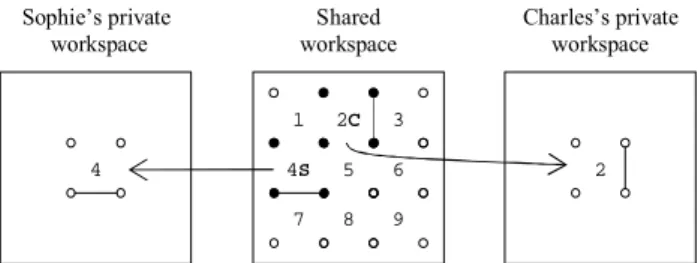
The rules for gradually connecting points in the board disallow ma-nipulations in the shared workspace. Instead, each member has to reserve points via the selection of the corresponding cell and by dragging it to the private workspace (see Figure 2). Once there, the cell points can be connected in pairs, but only if at least one of the to-be-connected points is already linked to a third point in the same
cell1. These modifications are made public when the cell is moved
back to the shared workspace.
Naturally, when a cell is dragged to a private workspace, the corre-sponding points are reserved (locked) in the shared workspace (see exception in the next paragraph). To minimize inadvertent selections of reserved cells, the shared workspace provides awareness by dis-playing, next to the cell number, a letter that identifies the current owner, as depicted in Figure 2.
1 For example, Sophie, who draws vertical connection lines, only
selects and reserves cells that have at least one horizontal connec-tion. Charles’s behavior is analogous.
Initial state 5 8 9 6 2 3 1 4 7 5 8 9 6 2 3 1 4 7 5 8 9 6 3 4 7 Final state Intermediate state 2 1
3
Figure 2. Cell reservations and ownership identification
The groupware tool also features automatic conflict resolution due to concurrent reservations of the same points. For instance, if Sophie and Charles both select the same cell and simultaneously try to re-serve it, then the groupware tool rere-serves the cell only to one of them, while the other is notified that the cell is in use. A similar situation occurs when vertically and horizontally adjacent cells are reserved in parallel since the two points that belong to both cells cannot be in different private workspaces at the same time. The only exception to this rule is when a single point is shared between di-agonally adjacent cells; in this case, the simultaneous reservation of such cells is allowed (see example in Figure 2).
It is expected that the cells remain reserved for a relatively small amount of time due to the expertise of the team members and their eagerness to accomplish the shared goal as fast as possible. To demonstrate how this case represents concerted work, consider the intermediate state in Figure 1. Now, suppose Sophie acts first by selecting and reserving cell 1; her action is observable in the shared
workspace due to the letter S in that cell. Based on this awareness
information, Charles knows where Sophie is working and thus moves away from cell 1 and considers, for example, cells 6 or 7, which are available.
Furthermore, to quickly reach the final state (see Figure 1) the team must be intensively working in harmony. The more horizontal con-nection lines exist, the more vertical concon-nections can be drawn, and vice-versa. Conversely, if one member stops drawing connection lines, the other team member will soon also stop. For example, if Sophie arrives late to a situation where the board is still on the ini-tial state, then Charles is capable of drawing only four horizontal connection lines (two each in cells 2 and 3), while being idle for the rest of the time. In other words, the actions of the team members are intertwined, this being a distinctive feature of concerted work [14].
4. ANALYTICAL EVALUATION
The case analysis starts with a characterization of the collaborative work environment in terms of roles, goals, and actions. There are two roles in this case, associated with drawing vertical and horizon-tal connection lines between adjacent points. These roles are played by Sophie and Charles, respectively. Both team members pursue in-dividual goals, such as drawing connection lines as fast as possible, while being conscious of team progress towards the shared goal: to quickly connect all adjacent points in the board.
In this environment, team work results from a combination of indi-vidual and collaborative actions performed by the two members. In-dividual actions are identified by DRAW_V_LINE and DRAW_H_LINE,
for drawing one vertical/horizontal connection line between adjacent points in a cell. Being related with private workspaces they do not
require any information to be delivered to the other team members. Collaborative actions are named RESERVE_CELL and RELEASE_CELL,
for moving a cell from the shared to the private workspace, and vice-versa. These actions involve the shared workspace and thus re-quire the groupware tool to provide awareness information to all team members about their outcomes.
These two types of actions—supporting individual and collaborative work—are intertwined and under the control of the groupware tool, which means their design can influence individual, and especially, team performance.
The case analysis proceeds with a detailed description of all the ac-tions Sophie and Charles can perform using the adopted design op-tions: mouse only inputs, exclusive reserves of points, drawing only in the private workspaces, and workspace awareness (see Table 1).
Table 1. Descriptions of individual and collaborative actions
Type Action Description
DRAW_V_ LINE
Sophie (1) identifies a cell point, in her private workspace, that belongs to an horizontal con-nection but is missing a vertical concon-nection; then she (2) presses the mouse button over the point and (3) moves the mouse cursor to the vertically adjacent point in the cell; once there, she (4) releases the mouse button
In di vi du al DRAW_H_ LINE
Charles (1) identifies a cell point, in his private workspace, that belongs to a vertical connec-tion but is missing an horizontal connecconnec-tion; then he (2) presses the mouse button over the point and (3) moves the mouse cursor to the horizontally adjacent point in the cell; once there, he (4) releases the mouse button
RESERVE_ CELL
The team member (1) identifies a candidate cell in the shared workspace; then (2) presses the mouse button over the cell and (3) moves the mouse cursor to the private workspace; once there, (4) releases the mouse button
C olla bo ra tiv e RELEASE_ CELL
The team member (1) identifies the cell in the private workspace; then (2) presses the mouse button over the cell and (3) moves the mouse cursor to the shared workspace; once there, (4) releases the mouse button
The candidate cell mentioned in the RESERVE_CELL description is
related to the interest of the team member in selecting the cell (see footnote 1). It also refers to a design feature addressing workspace
awareness: letters, such as S and C (see Figure 2), are used to make
team members conscious about the cell availability and ownership.
This awareness information is delivered after completion of the
RE-SERVE_CELL action. Conversely, RELEASE_CELL updates the shared
workspace by removing the ownership letter from the cell and by making visible any new connections.
4.1 Predicting Execution Times
Our case analysis now proceeds with a usability evaluation with the KLM (Keystroke-Level Model) [3,4]. This model provides quantita-tive predictions of human performance based on the descriptions of the actions in Table 1. In the KLM each action is converted into a sequence of mental and motor operators (shown in Table 2), whose individual execution times have been empirically established and validated in psychological experiences [3,15].
Charles’s private workspace Sophie’s private
workspace workspace Shared
5 6 8 9 1 7 3 4S 4 2 2C
4
Table 2. KLM operators (time in milliseconds) [3,15]
Operator Time Description
M 1200 Mental preparation
P 1100 Point with mouse to target on a display K 100 Press or release mouse button
An important KLM requirement is that modeling applies to expert error-free behavior only. This is met in our case since Sophie and Charles are highly trained in drawing line connections and using the groupware tool, as assumed in the case description.
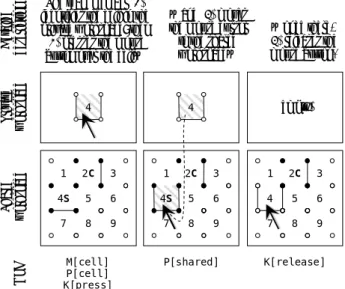
To exemplify the conversion from the detailed textual description
into a KLM representation, consider the RELEASE_CELL action in
Table 1 and the illustration in Figure 3.
Figure 3. KLM representation of the RELEASE_CELL action. The
final model is M[cell]P[cell]K[press]P[shared]K[release]
In step (1) of the RELEASE_CELL action the team member—Sophie,
in this case—identifies a, presumably worked, cell in her private
workspace; this is converted into the M[cell] operator. Then she
moves the mouse cursor over the cell, thus the P[cell], and presses
the mouse button, K[press]. In step (2) she moves the mouse cursor
to the shared workspace, an operation that is translated into a single
P[shared] without a preceding M[shared] since there is no need for
finding the workspace (it is always in the same place). In step (3)
Sophie releases the mouse button, K[release]. The total predicted
time for the execution of the RELEASE_CELL action, as for every
other action, is obtained by adding the individual times of the KLM operators, as shown in Table 3.
Interestingly, the KLM representations for the actions in our case
are all essentially equal (a sequence of MPKPK operators), hence the
predicted times are the same. This suggests the required human skills for drawing a connection line between two points are very similar to those needed for moving a cell between workspaces, which seems intuitive. Furthermore, the predicted execution times also seem plausible if we consider Fitts’s Law, the sizes of the ob-jects, and the distances between them [3].
Table 3. KLM representations and predicted execution times (in ms) for the individual and collaborative actions
Type Action KLM representation Time Total
In di vi du al DRAW_V_ LINE DRAW_H_ LINE (1) M[point] (2) P[point]K[press] (3) P[next_point] (4) K[release] 1200 1100+100 1100 100 3600 RESERVE_ CELL (1) M[cell] (2) P[cell]K[press] (3) P[private] (4) K[release] 1200 1100+100 1100 100 3600 C olla bo ra ti ve RELEASE_ CELL (1) M[cell] (2) P[cell]K[press] (3) P[shared] (4) K[release] 1200 1100+100 1100 100 3600
The estimates presented in Table 3 apply to single actions as if they were unrelated. To reveal goal achievement (individual and shared) in this collaborative environment it is necessary to understand how work is carried out with the groupware tool. We start with an analy-sis of individual behavior and then proceed with an evaluation of team performance towards the shared goal.
4.2 Focusing on the Individual Goals
Given a candidate cell in the shared workspace, each team member accomplishes individual goals by following one of two possible
se-quences of actions, shown in Table 4. Sequence S1 corresponds to a
single line draw in a cell. This sequence is applicable, by either So-phie or Charles, to cell 1 in the intermediate state in Figure 1. The
sequence of actions S2 applies to cases where two line connections
can be drawn in the same cell, as happened to cell 4 in Figure 3.
Table 4. Sequences of actions for achieving individual goals
S# Actions Time (ms) Collab. Individ.
S1 (1) RESERVE_CELL (2) DRAW_LINE2 (3) RELEASE_CELL 3600 + 3600 + 3600 = 10800 7200 / 10800 = 67% 3600 / 10800 = 33% S2 (1) RESERVE_CELL (2) DRAW_LINE2 (3) DRAW_LINE2 (4) RELEASE_CELL 3600 + 3600 + 3600 + 3600 = 14400 7200 / 14400 = 50% 7200 / 14400 = 50%
The data displayed in Table 4 is quite interesting, as it shows that
collaborative actions, RESERVE_CELL and RELEASE_CELL, are more
costly (7200 ms, 67% of total predicted time) than the individual
ac-tion of drawing a connecac-tion line, DRAW_LINE, that characterizes
se-quence S1. It is therefore natural for the groupware designer to
ad-mit that team members will avoid such situation and instead prefer
sequence S2, due to its lower collaboration overhead (50%) and
small increase in execution time (14400 versus 10800 ms, +33%) compared to twice the number of line drawings per reserved cell.
The advantages of sequence S2 can also be taken into account in the
design of the automatic conflict resolution mechanism, presented in the case description, so that overall team performance is optimized. For instance, when team members simultaneously try to reserve the
2
DRAW_LINE is an abstraction for DRAW_V_LINE and DRAW_H_LINE. M[cell]
P[cell] K[press]
The team member (1) identifies the cell in the private workspace; then (2) presses the mouse button over the cell…
P[shared]
…and (3) moves the mouse cursor to the shared workspace… P ri vat e w or kspa ce …once there, (3) releases the mouse button. K[release] S har ed w or ksp ac e 4 5 6 8 9 1 7 3 4S 5 6 8 9 1 7 3 4 2C 2C (empty) De ta ile d des cr ip ti on KL M 5 6 8 9 1 7 3 2C 4S 4
5 same cell the groupware tool could give preference, perhaps via heu-ristic rules, to the member that would be in condition of executing
S2, in detriment of S1. For this to happen, however, the groupware
tool would have to know the specialty of the team members, which seems a reasonable use of context information.
4.3 Focusing on the Shared Goal
Based on the previous analysis of individual behavior we can now evaluate team performance towards the shared goal. We start by de-fining a goal unit as a conceptual metric for assessing progress in terms of the shared goal. In our collaborative case the shared goal is reached when all line connections have been drawn on the board (see final state in Figure 1), which gives a total of 24 goal units. We continue the analysis with a characterization of the sequences of actions for achieving individual goals along three orthogonal dimen-sions, which we think are inherent to intensive concerted work: 1) production of goal units; 2) creation of new goal opportunities for the other team members; and 3) restrictions to the work of the other members while the current sequence of actions is going on. The productivity dimension measures the number of goal units each sequence of actions produces per time unit: the greater the value, the faster the team may progress towards the shared goal. In singleware design this dimension can be used for measuring individual effi-ciency. However, in intensive concerted work, team efficiency can-not be determined by simply combining individual efficiencies; we try to capture this with the two extra dimensions.
The opportunities dimension is related to the intertwined nature of intensive concerted work: if a team member stops, then soon the team will also halt, eventually never reaching the shared goal. This suggests that collaboration among team members is bound by oppor-tunity dependencies created by the achievement of individual goals. The measurement unit for this dimension is new goal unit opportuni-ties potentially created per time unit. The greater the number of op-portunities, the faster the team may progress.
The restrictions dimension reflects a possible negative outcome of coordination in shared workspaces: the prevention of conflicts and duplicate efforts (positive outcomes) may slow down or even impede parallel work by the other team members. Restrictions are measured in inaccessible goal units times the duration of the sequence of ac-tions. This unit of measurement emphasizes fast and unobtrusive execution of individual goals: the greater the value for restrictions, the slower the team may progress towards the shared goal, because team members will probably spend more time waiting to proceed. We are now in position for evaluating team performance toward the
shared goal based on the analysis of the sequences of actions S1 and
S2 (described in Table 4) along the three dimensions (see Table 5).
As mentioned before, in our case a goal unit (gu) is equal to drawing one connection line, either vertically or horizontally, between two adjacent points. Our main time unit, for convenience, is minutes.
Table 5. Team performance based on sequences of actions
S# Productivity Opportunities Restrictions
S1 1 gu / 10800 ms = 5.5 gu/min 2 gu / 10800 ms = 11.1 gu/min 1 gu * 10800 ms = 0.18 gu.min S2 2 gu / 14400 ms
= 8.3 gu/min 5 gu / 14400 ms = 20.8 gu/min 1 gu * 14400 ms = 0.24 gu.min
The predictions in Table 5 show that the sequence of actions S2 is
more productive than S1, because S2 takes 14400 ms to draw 2 line
connections—thus the 8.8 gu/min—in contrast with the 5.5 gu/min
of S1. Additionally, S2 also compares favorably with S1 in creating
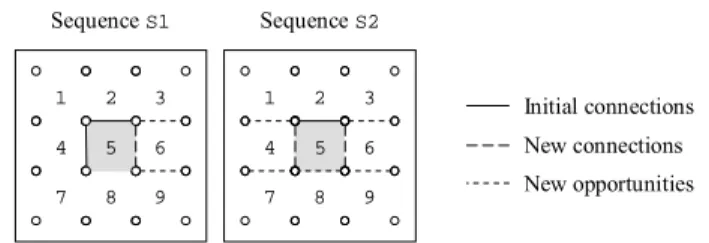
new individual goal opportunities for the other team members: 20.8 versus 11.1 gu/min. The reasoning behind the number of opportuni-ties for each sequence of actions is illustrated in Figure 4.
Figure 4. New opportunities based on the sequences of actions
Using sequence S1 only one vertical connection line can be drawn
by Sophie in cell 5, which, in the best case, opens two new goal op-portunities to Charles since he will be able to draw two extra hori-zontal connections: the top and bottom lines in cell 6. The missing bottom horizontal line in cell 5 is not considered an opportunity be-cause it was already available via the left vertical connection in cell 5. Actually, that bottom connection in cell 5 is inaccessible to the
other team members while Sophie is running S1 (more details in the
next paragraph). This logic analogously applies to S1 if we choose
Charles drawing a horizontal connection in cell 5 as a starting point.
In sequence S2 up to 5 opportunities can be created after the left and
right vertical lines are drawn in cell 5.
The only dimension where sequence S1 is preferable to S2 is in the
restrictions to the work of the other team members. The lower 0.18
gu.min of S1, against the 0.24 gu.min of S2, is due to its faster
pre-dicted execution time—10800 versus 14400 ms—since the number of inaccessible goal units during the execution of the sequence of ac-tions is the same in both cases: a single line connection drawing (the bottom horizontal connection in cell 5).
The results in Table 4 and Table 5, which we think are representa-tive of the afforded usability with the current version of the group-ware tool, provide a basis for making comparisons with other design options. This discussion will continue in the next section, where a design alternative will be evaluated using the same approach.
5. ALTERNATIVE DESIGN/DISCUSSION
Our design alternative for the groupware tool features more aware-ness information and multiple cell reservations/releases. As before, reserved cells are marked with a letter that identifies the current owner, but now awareness information is also provided when a team member selects cells in the shared workspace, by clicking the mouse button over a cell, for instance. The second feature allows multiple cells to be selected, and then reserved or released in a single step. The reasons for these choices are twofold: a) as we will show, a cell selection in the shared workspace is faster than a cell reservation, which means awareness information will be more up-to-date; and b) the impact of collaborative actions in the execution of individual goals (see Table 4) can be decreased if the groupware tool allows multiple cells to be reserved or released at once, because more con-nection lines can be drawn consecutively in private workspaces.
Sequence S1 8 9 6 2 3 4 1 7 5 5 Sequence S2 8 9 6 2 3 1 4 7 Initial connections New connections New opportunities
6
5.1 Predicting Execution Times
The new features inevitably imply changes in the individual and col-laborative actions that characterize the work environment. For
ex-ample, the previous action RESERVE_CELL is now a succession of
SE-LECT_CELL_C followed by RESERVE_SELECTED. Table 6 shows all
new action descriptions.
Table 6. New descriptions of individual and collaborative ac-tions, plus KLM representations and predicted times (in ms)
Type Action Description/KLM representation Time
Unchanged descriptions (see Table 1)
DRAW_V_ LINE DRAW_H_ LINE (1) M[point] (2) P[point]K[press] (3) P[next_point] (4) K[release] 3600 SELECT_
CELL_I (Similar to SELECT_CELL_C) 2500
In di vi du al SELECT_
CELLS_I (Similar to SELECT_CELLS_C) 4800
The team member (1) identifies a can-didate cell in the workspace and (2) clicks the mouse button over the cell
SELECT_ CELL_C
(1) M[cell]
(2) P[cell]K[press]K[release]
2500
The team member (1) identifies a can-didate cell in the workspace and (2) presses the mouse button over the cell; then (3) identifies a second candidate cell that defines the desired imaginary rectangle, (4) moves the mouse cursor to the cell, and (5) releases the mouse button SELECT_ CELLS_C (1) M[cell] (2) P[cell]K[press] (3) M[next_cell] (4) P[next_cell] (5) K[release] 4800
The team member (1) presses the mouse button over a newly selected cell, (2) moves the mouse cursor to the private workspace, and (3) releases the mouse button RESERVE_ SELECTED (1) K[press] (2) P[private] (3) K[release] 1300
The team member (1) presses the mouse button over a newly selected cell, (2) moves the mouse cursor to the shared workspace, and (3) releases the mouse button C olla bo ra tiv e RELEASE_ SELECTED (1) K[press] (2) P[shared] (3) K[release] 1300
The difference between the _I and _C versions of SELECT_CELL and
SELECT_CELLS is the workspace where the actions are executed: if
the selection is made in a private workspace, then the _I (individual)
version is used; the _C actions are used for selections in the shared
workspace, which produce awareness information to all team mem-bers, and thus are collaborative.
Table 6 shows the predicted time for SELECT_CELL_C, 2500 ms, is
lower than the 3600 ms required for the older RESERVE_CELL action
(see Table 3), which means team members should experience less time dealing with coordination conflicts. On the other hand, the time
to reserve a single cell slightly increases because now it takes a
SE-LECT_CELL_C followed by a RESERVE_SELECTED, with a total of
2500+1300 = 3800 ms, to perform what was previously done with
RESERVE_CELL in 3600 ms. We consider this tradeoff acceptable
be-cause the time to recover from a reservation conflict is, at least, an order of magnitude greater than the extra 200 ms.
The actions SELECT_CELLS_I and SELECT_CELLS_C simplify the
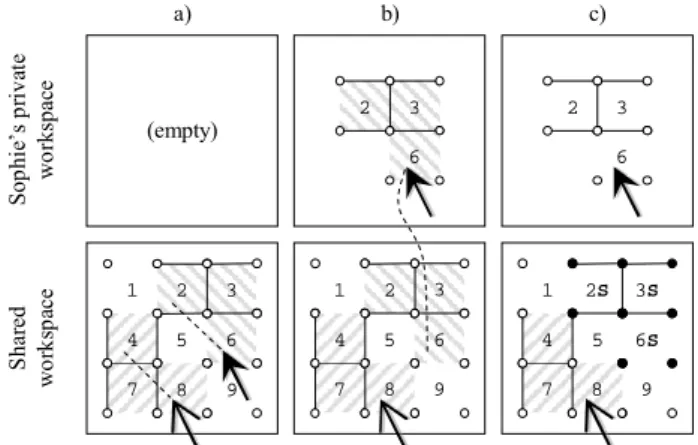
se-lection of multiple cells by allowing a team member to delineate an imaginary rectangle made of cells via the selection of two of its cor-ners. This extra versatility, though, also increases the probability of two or more team members simultaneously select the same cells. To overcome this problem the groupware tool features an anti-selection mechanism that automatically excludes cells that are being selected by two or more members, as illustrated in Figure 5.
Figure 5. Concurrent selection and reservation of multiple cells
In step a) in Figure 5 Sophie and Charles are selecting multiple— overlapping—cells at the same time. As a consequence, the group-ware tool activates the anti-selection mechanism to automatically prevent cell 5 from being selected. In step b) Sophie initiates a mul-tiple cell reservation by dragging the selected cells to her private workspace. In step c) the reservation is complete.
5.2 Focusing on the Individual Goals
The analysis of the design alternative now proceeds with a charac-terization of the sequences of actions that team members can exe-cute to achieve their individual goals (see Table 7).
As expected, if team members can only select single cells, they will probably prefer reserving those candidate cells where they can draw
two connection lines, using sequence S4, in detriment of S3. This is
because in S4 the overhead of collaborative actions, 34%, is lower
than the 46% in S3 (cf. similar situation with S2 and S1 in Table 4).
However, as the data in Table 7 shows, if team members see an op-portunity for reserving multiple candidate cells at once, then they
will likely use sequence S5 when at least three line drawings (n = 3)
are doable in those cells. In these circumstances, the impact of
col-laborative actions is about 32% (or lower, if n increases), this being
unmatched by any of the sequences S3 and S4.
9 1 S oph ie ’s pr iv at e w or kspac e S har ed w or ks pa ce 3S 3 6 2 7 5 3 9 1 6 2 8 4 (empty) 7 5 3 9 1 6 2 8 4 7 5 8 4 6S 2S 3 6 2 a) b) c)
7
Table 7. New sequences of actions for achieving individual goals. The proportion of individual actions is given by 1−Collab
S# Actions Time (ms) Collab.
S3 (1) SELECT_CELL_C (2) RESERVE_SELECTED (3) DRAW_LINE2 (4) SELECT_CELL_I (5) RELEASE_SELECTED 2500 + 1300 + 3600 + 2500 + 1300 = 11200 5100 / 11200 = 46% S4 (1) SELECT_CELL_C (2) RESERVE_SELECTED (3) DRAW_LINE2 (4) DRAW_LINE2 (5) SELECT_CELL_I (6) RELEASE_SELECTED 2500 + 1300 + 3600 + 3600 + 2500 + 1300 = 14800 5100 / 14800 = 34% S5 (1) SELECT_CELLS_C (2) RESERVE_SELECTED (3) DRAW_LINE2 * n (4) SELECT_CELLS_I (5) RELEASE_SELECTED 4800 + 1300 + 3600 * n + 4800 + 1300 = 3600 * n + 12200 7400 / total n = 1 → 47% n = 2 → 38% n = 3 → 32% n = 4 → 28% n = 5 → 25%
It is interesting to note that this design for cell selections affords a very clear and smooth definition of when to apply each sequence: if
n ≥ 3 then use S5; else, if n = 2 then use S4; else, use S3.
5.3 Focusing on the Shared Goal
We now evaluate team performance towards the shared goal based on the previous analysis of individual behavior. Table 8 shows
val-ues along our three dimensions for the sequences of actions S3, S4,
and for a variety of sequences S5, which are illustrated in Figure 6.
Table 8. Team performance based on new sequences of actions
S# Productivity Opportunities Restrictions
S3 1 gu / 11200 ms
= 5.4 gu/min 2 gu / 11200 ms = 10.7 gu/min 1 gu * 11200 ms = 0.19 gu.min
S4 2 gu / 14800 ms
= 8.1 gu/min 5 gu / 14800 ms = 20.3 gu/min 1 gu * 14800 ms = 0.25 gu.min
S5 h) 4 gu / 26600 ms = 9.0 gu/min 8 gu / 26600 ms = 18.0 gu/min 2 gu * 26600 ms = 0.89 gu.min
S5 a) 4 gu / 26600 ms = 9.0 gu/min 8 gu / 26600 ms = 18.0 gu/min 4 gu * 26600 ms = 1.8 gu.min S5 g) 5 gu / 30200 ms = 9.9 gu/min 9 gu / 30200 ms = 17.9 gu/min 5 gu * 30200 ms = 2.5 gu.min S5 b) 6 gu / 33800 ms = 10.6 gu/min 10 gu / 33800 ms = 17.8 gu/min 6 gu * 33800 ms = 3.4 gu.min S5 f) 6 gu / 33800 ms
= 10.6 gu/min 10 gu / 33800 ms = 17.8 gu/min 8 gu * 33800 ms = 4.5 gu.min
S5 c) 8 gu / 41000 ms
= 11.7 gu/min 13 gu / 41000 ms = 19.0 gu/min 9 gu * 41000 ms = 6.2 gu.min
S5 e) 9 gu / 44600 ms
= 12.1 gu/min 12 gu / 44600 ms = 16.1 gu/min 10 gu * 44600 ms= 7.4 gu.min
S5 d) 12 gu / 55400 ms
= 13.0 gu/min 16 gu / 55400 ms = 17.3 gu/min 14 gu * 55400 ms= 12.9 gu.min
S5 i) 12 gu / 55400 ms
= 13.0 gu/min 16 gu / 55400 ms = 17.3 gu/min 16 gu * 55400 ms= 14.8 gu.min
S5 j) 16 gu / 69800 ms = 13.8 gu/min 21 gu / 69800 ms = 18.0 gu/min 21 gu * 69800 ms= 24.4 gu.min
The results in Table 8 are sorted in ascending order by productivity, then by opportunities, and finally by restrictions. This particular ar-rangement conveys a sense of equilibrium between the three dimen-sions of team performance: the last rows describe the more
produc-tive variants of sequence S5 (shown in Figure 6) but which are, at
the same time, the most restrictive and offering only median oppor-tunities to the other team members; conversely, the first rows
repre-sent the sequences of actions—such as S3, S4, and the smaller
vari-ants of S5—that are less restrictive and offering good opportunities,
albeit with lower productivity.
Figure 6. Analysis of a variety of sequences of actions S5
Another feature of the arrangement of results in Table 8 is that it fa-cilitates the detection of sequences of actions that have equal pro-ductivities and equal opportunities, but different restrictions. In such conditions team performance is best when its members can execute those sequences of actions that impose lower restrictions to the other
members: for instance, S5 b) is better for the team than S5 f) and S5
Initial connections New connections New opportunities Inaccessible connections
a) n = 4 b) n = 6 c) n = 8
d) n = 12 e) n = 9
f) n = 6 g) n = 5 h) n = 4
8
d) is preferable to S5 i). Additionally, based on these clusters of
se-quences of actions, and guided by the corresponding illustrations in Figure 6, the designer can search for patterns of recommended use, such as, say, “if your role is drawing horizontal/vertical connection lines, then your multiple cell selections and reservations should be shaped like horizontal/vertical rectangles.”
We end the analysis of the design alternative with an explanation of
the variety of sequences of actions S5 depicted in Figure 6. These S5
variants are special cases of drawing horizontal connection lines (the logic for vertical lines is analogous): they represent best cases in terms of productivity and opportunities and, simultaneously, worst cases in terms of restrictions. It can be argued that actual team per-formance varies with the evolving state of the board. However, an
exhaustive analysis of sequence S5 is unmanageable due to the sheer
number of possible board states alone, much worse when combined
with the number of variants of S5. By focusing our attention on the
special cases of S5 we can create a cheap, yet reasonable,
compara-ble basis for evaluating team performance towards the shared goal.
5.4 Comparing Designs: The Big Picture
Our approach for analyzing intensive concerted work now reaches a level that affords comparing the two design alternatives. We
con-sider all previously analyzed sequences of actions: S1 and S2 from
the original design; S3, S4, and variants of S5 from the alternative
design. In particular, we look closer to S1 and S3 and to S2 and S4
because they are conceptually equivalent: only one cell is reserved and one or two (depending on the pair of sequences) line connec-tions are drawn.
Figure 7 shows the impact of collaborative overhead in total pre-dicted execution time versus the proportion of time for doing indi-vidual actions (that produce line connections/goal units). The values are sorted by collaborative overhead to facilitate the detection of the sequences of actions that are more costly to perform in a shared workspace. 0% 20% 40% 60% 80% 100% S1 S2 S3 S4 S5 h ) S5 a ) S5 g) S5 b) S5 f ) S5 c ) S5 e ) S5 d ) S5 i) S5 j) Pr opo rt ion of pr ed ic te d t im e
Collaborative overhead Individual actions
Figure 7. Collaborative overhead versus individual actions
The data in Figure 7 show that the sequences S1 and S2 have the
greatest proportions of collaborative overhead and that their related
siblings, S3 and S4, exhibit significantly better values. The variants
of S5, however, have the best proportions of individual actions in
to-tal predicted time. These preliminary results seem to indicate that the alternative design is preferable to the original design, even more so because, intuitively, collaborative overhead has a negative effect on team performance.
Team performance, in our case of concerted work, is more complex, though, as Figure 8 demonstrates. It shows a characterization of all sequences of actions along our three dimensions of team perform-ance towards the shared goal. The values are sorted by productivity, then by opportunities, and finally by restrictions, for the reason we suggested earlier. This ordering of values is similar to that of Figure
7, except for S1, S2, S3 and S4, which, nonetheless, continue to
oc-cupy the four leftmost positions in the graph.
0 5 10 15 20 S3 S1 S4 S2 S5 h ) S5 a ) S5 g ) S5 b ) S5 f ) S5 c ) S5 e ) S5 d ) S5 i) S5 j) gu /m in 0 5 10 15 20 25 gu .m in
Productivity Opportunities Restrictions
Figure 8. Analysis of team performance for the two designs
To show that the intuition is wrong—at least in this particular case of concerted work—we start by stating the following proposition: “lower proportions of collaborative overhead for achieving individ-ual goals lead to higher team performance towards the shared goal.”
Now consider the succession of varieties of S5, whose ordering is
the same in Figure 7 and Figure 8. In this succession, reading from left to right, the proportion of collaborative overhead gradually de-creases while the productivity inde-creases in a symmetrical way, the opportunities remain relatively constant, and the restrictions raise exponentially. Contrary to the proposition, the higher the proportion
of collaborative overhead in the variants of S5 the slower the team
progresses towards the shared goal because more of its team mem-bers will probably spend more time waiting to proceed.
The data on sequences of actions S1 and S3, and S2 and S4 also
show no direct relationship between the significant differences in the proportions of collaborative overhead and the identical values— within these two pairs of sequences—for the three dimensions of team performance.
Given this somewhat puzzling scenario of decision, full of tradeoffs between individual goals and the shared team goal, the groupware designer must find an optimal point of equilibrium. Where this point could be is the subject of further work. At the moment the big pic-ture is still getting clearer.
6. CONCLUSIONS AND FUTURE WORK
We show in this paper how estimates drawn from research in Hu-man-Computer Interaction, which fundamentally addresses single-ware, may be used to inform the design of groupware supporting in-tensive concerted work scenarios.
As shown in the illustrated case, in concerted work individual and collaborative tasks are intertwined and mutually dependent. In such circumstances, groupware usability depends on fine-grained details about how team members interact with the system, utilize
work-9 space awareness to organize themselves, and set their work strate-gies by balancing the costs associated with the achievement of indi-vidual goals and shared team goals.
We propose a discount analytical approach for identifying and ex-amining such tradeoffs in shared workspaces, providing quantitative indications of which design alternatives may be beneficial to team work. Our approach defines a conceptual metric, called goal unit, and three dimensions, and uses them to characterize team perform-ance towards the shared goal in intensive concerted work scenarios: □ The productivity dimension measures the number of goal units
produced per time unit. The greater the value, the faster the team may progress towards the shared goal;
□ The opportunities dimension captures the intertwined nature of intensive concerted work in terms of new goal unit opportunities potentially created per time unit. The greater the number of op-portunities, the faster the team may progress;
□ The restrictions dimension reflects the cost of coordination in shared workspaces. It is measured in inaccessible goal units mul-tiplied by the duration of individual work. The greater the value, the slower the team may progress towards the shared goal, be-cause its members probably spend more time waiting to proceed. Research described in this paper is just a preliminary step in the di-rection of exploring human performance models to estimate group-ware usability. Our estimates of human performance were based on experimental measures of time spent by humans executing single user operations. Experimental research with groupware will be ac-complished in the future.
Also related with future work, we are investigating the development of specific operators related to groupware interaction based on the experience documented here and on the analysis of typical (pattern-like) groupware mechanisms such as workspace awareness and floor control. Then, based on empirical tests, we will attempt to provide estimates for the most common groupware interactions.
In the near future we will continue exploring the current scenario of concerted work, searching for the existence of an optimal point of equilibrium between individual goals and the shared team goal, hop-ing not only to find any, but also that the search method can be gen-eralized to other scenarios.
7. REFERENCES
1. Antunes, P., Borges, M., Pino, J., and Carriço, L. Analyzing Groupware Design by Means of Usability Results. Proceedings of the Ninth International Conference on Computer Supported Cooperative Work in Design, 2005, 283–288.
2. Baker, K., Greenberg, S., and Gutwin, C. Empirical Develop-ment of a Heuristic Evaluation Methodology for Shared Work-space Groupware. Proceedings of the 2002 ACM Conference on Computer Supported Cooperative Work, 96–105. 3. Card, S., Moran, T., and Newel, A. The Psychology of
Human-Computer Interaction. Lawrence Erlbaum, 1983. 4. Card, S., Moran, T., and Newell, A. The Keystroke-Level
Model for User Performance Time with Interactive Systems. Communications of the ACM, 23(7), 1980, 396–410.
5. Fjermestad, J. and Hiltz, S. An Assessment of Group Support Systems Experimental Research: Methodology and Results. Journal of Management Information Systems, 15(3), 1999, 7– 149.
6. Haynes, S., Purao, S., and Skattebo, A. Situating Evaluation in Scenarios of Use. Proceedings of the 2004 ACM Conference on Computer Supported Cooperative Work, 92–101. 7. Ivory, M. and Hearst, M. The State of the Art in Automating
Usability Evaluation of User Interfaces. ACM Computing Sur-veys, 33(4), 2001, 470–516.
8. John, B. and Kieras, D. Using GOMS for User Interface Design and Evaluation: Which Technique? ACM Transactions on Computer-Human Interaction, 3(4), 1996, 287–319. 9. John, B. Why GOMS? Interactions, 2(4), 1995, 80–89. 10. Khalifa, M. Computer-Assisted Evaluation of Interface Designs.
The Data Base for Advances in Information Systems, 29(1), 1998, 66–881.
11. Kieras, D. and Santoro, T. Computational GOMS Modeling of a Complex Team Task: Lessons Learned. Proceedings of the 2004 Conference on Human Factors in Computing Systems, 97–104.
12. Kieras, D. Model-Based Evaluation. In Jacko, J. and Sears, A. (eds.) The Human-Computer Interaction Handbook. Lawrence Erlbaum Associates, 2003, 1139–1151.
13. Min, D., Koo, S., Chung, Y., and Kim, B. Distributed GOMS: An Extension of GOMS to Group Task. Proceedings of the 1999 IEEE Conference on Systems, Man, and Cybernetics, 720–725.
14. Nunamaker, J., Briggs, R., Mittleman, D., Vogel, D., and Balthazard, P. Lessons from a Dozen Years of Group Support Systems Research: A Discussion of Lab and Field Findings. Journal of Management Information Systems, 13(3), 1997, 163–207.
15. Olson, J. and Olson, G. The Growth of Cognitive Modeling in Human-Computer Interaction. Human-Computer Interaction, 5. 1990, 221–265.
16. Pinelle, D., Gutwin, C., and Greenberg, S. Task Analysis for Groupware Usability Evaluation: Modeling Shared-Workspace Tasks with the Mechanics of Collaboration. ACM Transactions on Computer-Human Interaction, 2003, 281–311.
17. Pinelle, D. and Gutwin, C. Groupware Walkthrough: Adding Context to Groupware Usability Evaluation. Proceedings of the ACM SIGCHI Conference on Human Factors in Computing Systems: Changing Our World, Changing Ourselves, 2002, 455–462.
18. Steves, M., Morse, E., Gutwin, C., and Greenberg, S. A Com-parison of Usage Evaluation and Inspection Methods for As-sessing Groupware Usability. Proceedings of the 2001 Interna-tional ACM SIGGROUP Conference on Supporting Group Work, 125–134.