1
Children’s exposure to indoor air in urban nurseries - Part II: gaseous pollutants’
1
assessment
2 3
P.T.B.S. Branco, R.A.O. Nunes, M.C.M. Alvim-Ferraz, F.G. Martins, S.I.V. Sousa*
4
LEPABE – Laboratory for Process Engineering, Environment, Biotechnology and Energy,
5
Faculty of Engineering, University of Porto, Rua Dr. Roberto Frias, 4200-465, Porto, Portugal
6 7
*Corresponding author:
8Telephone: +351 22 508 2262
9Fax: +351 22 508 1449
10E-mail address: sofia.sousa@fe.up.pt
11
Postal address: Rua Dr. Roberto Frias, 4200-465, E215, Porto, Portugal
12 13
This article was published in Environmental Research, 142, 662-670, 2015
http://dx.doi.org/10.1016/j.envres.2015.08.026
2
Abstract
14
This study, Part II of the larger study “Children’s exposure to indoor air in urban nurseries”,
15
aimed to: i) evaluate nursery schools’ indoor concentrations of several air pollutants in class
16
and lunch rooms; and ii) analyse them according to guidelines and references. Indoor
17
continuous measurements were performed, and outdoor concentrations were obtained to
18
determine indoor/outdoor ratios. The influence of outdoor air seemed to be determinant on
19
carbon monoxide (CO), nitrogen dioxide (NO2) and ozone (O3) indoor concentrations. The peak
20
concentrations of formaldehyde and volatile organic compounds (VOC) registered (highest
21
concentrations of 204 and 2320 µg m
-3respectively), indicated the presence of specific indoor
22
sources of these pollutants, namely materials emitting formaldehyde and products emitting
23
VOC associated to cleaning and children’s specific activities (like paints and glues). For
24
formaldehyde, baseline constant concentrations along the day were also found in some of the
25
studied rooms, which enhances the importance of detailing the study of children’s short and
26
long-term exposure to this indoor air pollutant. While CO, NO2 and O3 never exceeded the
27
national and international reference values for IAQ and health protection, exceedances were
28
found for formaldehyde and VOC. For this reason, a health risk assessment approach could be
29
interesting for future research to assess children’s health risks of exposure to formaldehyde and
30
to VOC concentrations in nursery schools. Changing cleaning schedules and materials emitting
31
formaldehyde, and more efficient ventilation while using products emitting VOC, with the
32
correct amount and distribution of fresh air, would decrease children’s exposure.
33
Keywords
34Indoor air, nursery school, children, exposure, health risk assessment
35 36
3 37
1. Introduction
38Exposure to air pollutants in indoor environments may lead to health effects, from discomfort
39
symptoms to the prevalence of respiratory or even cardiovascular diseases and/or carcinogenic
40
effects, mainly lung cancer and childhood leukaemia (Franklin, 2007; Jones, 1999; Lin et al.,
41
2013). The World Health Organization (WHO) selected particulate matter (PM) and some
42
gaseous compounds as crucial to verify Indoor Air Quality (IAQ), namely radon, carbon
43
monoxide (CO), nitrogen dioxide (NO2), polycyclic aromatic hydrocarbons, formaldehyde and
44
other volatile organic compounds (VOC) as benzene, naphthalene, trichloroethylene, and
45
tetrachloroethylene (WHO, 2010). The increasing concern about those pollutants led WHO and
46
national governmental organizations, like the United States Environmental Protection Agency
47
(USEPA) and Health Canada, to define guidelines and standards to protect people’s health by
48
ensuring a better IAQ.
49
There were found some studies on children’s exposure to indoor air in nursery schools, but
50
some of them were merely focusing on ventilation, CO2 and/or comfort parameters, PM or even
51
biological compounds (Branco et al., 2014; Branco et al., 2015; Carreiro-Martins et al., 2014;
52
Fonseca et al., 2014; Gładyszewska-Fiedoruk, 2011; Madureira et al., 2015; Nunes et al., 2015;
53
Theodosiou and Ordoumpozanis, 2008). Nevertheless, Zuraimi and Tham (2008) investigated
54
indoor concentrations of several air pollutants, evaluating their sources in child care centres in
55
the tropical region of Singapore. Despite the large number of child care centres and air
56
pollutants assessed, samplings were only conducted in the middle of the week and during
57
occupation periods, which did not allow understanding potential differences between
58
occupation and non-occupation periods. Yoon et al. (2011) measured indoor air concentrations
59
of several chemical compounds (including TVOC and formaldehyde) besides PM in Korean
60
pre-schools. However, NO2 (also considered crucial to IAQ by WHO) was not considered in
61
that study. Roda et al. (2011) investigated IAQ of Paris child care centres to compare it with
62
dwellings by measuring biological and chemical pollutants, besides comfort parameters.
63
However, chemical pollutants were measured passively during an entire week (except the
64
weekend), which did not allow to understand pollutants variations along the day. St-Jean et al.
65
(2012) also studied IAQ in day care centres of Montréal (Canada) to determine its associations
66
with building characteristics. Despite considering a few different chemical compounds as well
67
as a VOC selection, passive sampling was also used for formaldehyde and VOC sampling,
4
which did not allow understanding pollutants variations along the day, and no outdoor
69
measurements were used to understand the outdoor influence on nursery schools’ indoor air.
70
Also in the AIRMEX study (Geiss et al., 2011), in which 23 different VOC were measured in
71
public buildings including schools and kindergartens in eleven European cities, passive
72
sampling was used with the duration of a full 7-days week, not allowing to understand variations
73
along the day and between occupation and non-occupation periods.
74
Accordingly, following the study already reported focusing on the PM assessment (Branco et
75
al., 2014) in the scope of INAIRCHILD project (Sousa et al., 2012), and aiming to reduce the
76
lacks above referred, this study aims to assess children’s exposure to indoor air pollution in
77
urban nursery schools. To meet this goal, the study was divided in two parts: i) Part I – CO2
78
and comfort assessment; and ii) Part II (the present study) which aimed to: i) evaluate indoor
79
concentrations of several gaseous air pollutants in different microenvironments of urban
80
nursery schools in Porto city; and ii) analyse those concentrations according to guidelines and
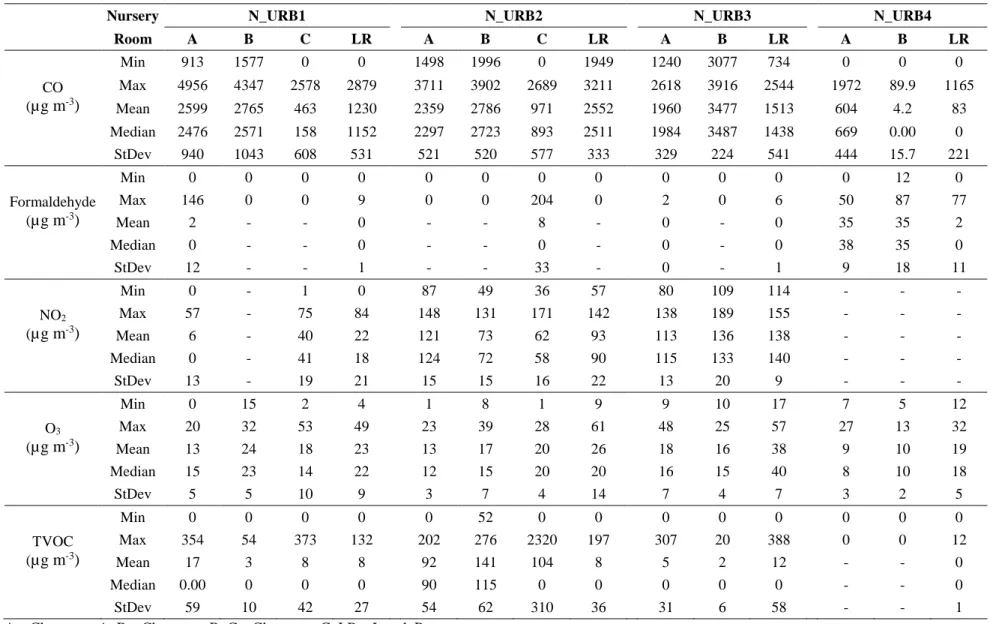
81
references for IAQ and children’s health.
82 83
2. Materials and methods
842.1. Sites description, sampling and analysis
85
This study was carried out in the city of Porto (Portugal) on four different nursery schools
86
located at urban sites influenced by traffic emissions (N_URB1, N_URB2, N_URB3 and
87
N_URB4), from March to June 2013 in N_URB1, N_URB2 and N_URB3, and in November
88
2013 in N_URB4. Its main characteristics (including occupation, ventilation and cleaning
89
habits and other specific activities), indoor microenvironments considered, and sampling
90
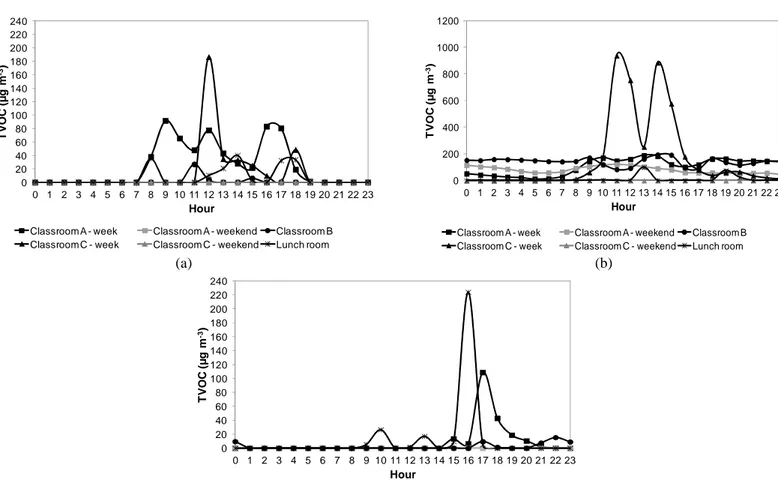
periods were fully described in Part I of the present study (Branco et al., 2015).
91
Indoor gaseous air compounds, namely CO, formaldehyde, NO2, O3, and total volatile organic
92
compounds (TVOC), were continuously measured using an Haz-Scanner IEMS Indoor
93
Environmental Monitoring Station (SKC Inc., USA), equipped with high sensitive sensors.
94
Sampling methods and main characteristics of each sensor are summarized in Table 1. Sampling
95
procedures, periods and duration were fully described in Part I (Branco et al., 2015).
96 97
5 Table 1 – Sampling methods and main characteristics of each sensor.
98 Sensor Detection methods Sensor minimum resolution
Sensor accuracy Measurement range
CO Electrochemical
detection < 1746 µg m
-3 < +/- 10% of reading or 2% of full
scale – whichever is greater 0-58200 µg m -3
Formaldehyde Electrochemical
detection 62.5 µg m
-3 < +/- 10% of reading or 2% of full
scale – whichever is greater 0-5000 µg m -3
NO2 Electrochemical
detection 41 µg m
-3 < +/- 10% of reading or 2% of full
scale – whichever is greater 0-41000 µg m -3
O3 Electrochemical
detection 2.14 µg m
-3 < +/- 10% of reading or 2% of full
scale – whichever is greater 0-1070 µg m -3
TVOC Photoionization
detection (PID) 230 µg m
-3 < +/- 10% of reading or 2% of full
scale – whichever is greater 0-115385 µg m -3
99
The mean values were compared with reference standards and guidelines aiming to evaluate
100
exceedances and/or non-compliances. Comparisons were performed considering national and
101
international reference values for general indoor environments, namely: i) Portuguese 2006
102
legislation (hourly means) (Decreto-Lei nº 79/2006) for CO (12 500 µg m
-3), O3 (200 µ g m
-3),
103
formaldehyde (100 µ g m
-3), and TVOC (600 µg m
-3); ii) Portuguese 2013 legislation (Portaria
104
nº 353-A/2013) for CO (10 000 µ g m
-3), formaldehyde (100 µg m
-3), and TVOC (600 µ g m
-3,
105
plus 100% of margin of tolerance (MT) if no mechanical ventilation system was working in the
106
room); iii) WHO guidelines (WHO, 2010) for CO (35000 µg m
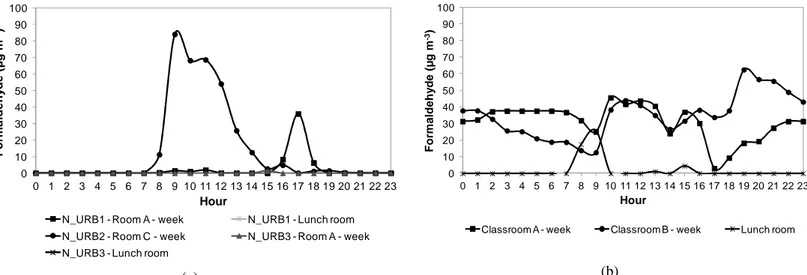
-3for hourly mean), NO2 (200
107
µg m
-3for hourly mean) and formaldehyde (100 µg m
-3for 30 minutes mean); and iv) Health
108
Canada guidelines (HealthCanada, 2013) for NO2 (480 µg m
-3for hourly mean) and
109
formaldehyde (123 µg m
-3for hourly mean). For the Portuguese 2013 legislation, 8-hour
110
running means were calculated and the daily maximum was compared with the reference value.
111
Although Portuguese 2006 legislation was officially replaced by the new Portuguese 2013
112
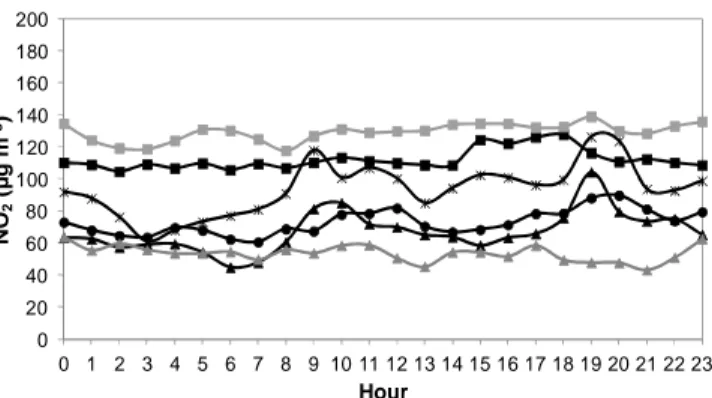
legislation, comparisons were made with both due to the clear differences between them, which
113
allowed concluding on the expected impacts from the application of the new one.
114
Simultaneously, hourly NO2 and O3 outdoor concentrations were obtained from the nearest air
115
quality station, classified as urban traffic and representative of the area (CCDR-N, 2011),
116
because only one equipment was available inhibiting simultaneous measurements outside the
117
nursery schools. These measurements were conducted by the Air Quality Monitoring Network
118
of Porto Metropolitan Area, managed by the Regional Commission of Coordination and
119
Development of Northern Portugal (Comissão de Coordenação e Desenvolvimento Regional
120
do Norte) under the responsibility of the Ministry of Environment. These concentrations
121
allowed calculating the correspondent indoor/outdoor (I/O) ratios.
6 123
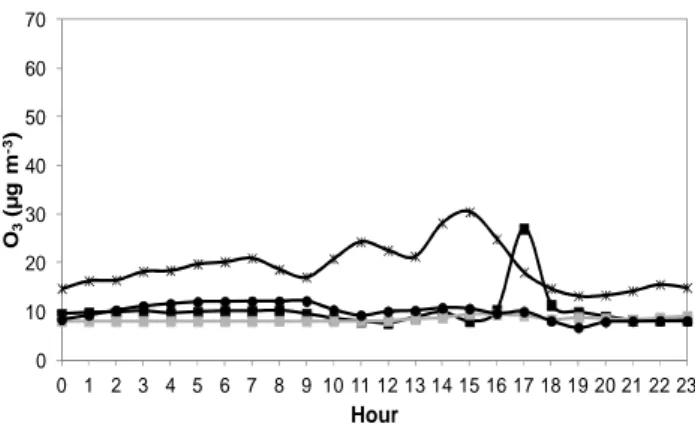
2.2 Statistical analysis
124
Data were tested for normality with both Shapiro-Wilk and Anderson-Darling tests. If normal,
125
the differences between hourly mean concentrations in different sampling days for each
126
microenvironment were analysed by a parametric unpaired t-test; in the other cases, the
non-127
parametric Kruskal-Wallis test was used for the microenvironments where there were more than
128
two complete sampling days, and the Wilcoxon Rank Sum Test (also called Mann-Whitney U
129
test) was used for those where there were only two complete sampling days.
130
The one-sample parametric t-test was used to analyse if the differences along the day were
131
significant for normal distributions; for other distributions, the non-parametric Wilcoxon
132
Signed Rank Test was used.
133
To analyse other differences, namely between weekdays and weekends, as well as between
134
different microenvironments and nursery schools, the parametric unpaired t-test or the
non-135
parametric Wilcoxon Rank Sum Test was used, respectively when distributions were normal or
136
not. In all cases, a significance level (
α
) of 0.05 was considered. Descriptive statistics was
137
calculated using MS Excel
(Microsoft Corporation, USA), and other statistical analyses were
138
determined using R software, version 3.1.2 (R Development Core Team, 2014).
139 140
3. Results and discussion
141Table 2 summarizes the main statistical parameters (minimum, maximum, mean, median and
142
standard deviation) of the hourly mean for each room of the four nursery schools.
143
When comparing two or more consecutive sampling days of the studied microenvironments,
144
statistically significant differences were found (p < 0.05) in 83.3%, 50% and 75% of the cases
145
regarding CO, NO2 and O3, respectively. For formaldehyde and TVOC, it was not possible to
146
make these statistical comparisons because concentrations were usually specific in time.
147
Despite this, a daily mean scenario in each microenvironment was assumed for the following
148
analyses of all the studied pollutants.
7
Table 2 – Statistical parameters of the hourly mean data for each room studied in the four nurseries.
150
Nursery N_URB1 N_URB2 N_URB3 N_URB4
Room A B C LR A B C LR A B LR A B LR CO (µg m-3) Min 913 1577 0 0 1498 1996 0 1949 1240 3077 734 0 0 0 Max 4956 4347 2578 2879 3711 3902 2689 3211 2618 3916 2544 1972 89.9 1165 Mean 2599 2765 463 1230 2359 2786 971 2552 1960 3477 1513 604 4.2 83 Median 2476 2571 158 1152 2297 2723 893 2511 1984 3487 1438 669 0.00 0 StDev 940 1043 608 531 521 520 577 333 329 224 541 444 15.7 221 Formaldehyde (µg m-3) Min 0 0 0 0 0 0 0 0 0 0 0 0 12 0 Max 146 0 0 9 0 0 204 0 2 0 6 50 87 77 Mean 2 - - 0 - - 8 - 0 - 0 35 35 2 Median 0 - - 0 - - 0 - 0 - 0 38 35 0 StDev 12 - - 1 - - 33 - 0 - 1 9 18 11 NO2 (µg m-3) Min 0 - 1 0 87 49 36 57 80 109 114 - - - Max 57 - 75 84 148 131 171 142 138 189 155 - - - Mean 6 - 40 22 121 73 62 93 113 136 138 - - - Median 0 - 41 18 124 72 58 90 115 133 140 - - - StDev 13 - 19 21 15 15 16 22 13 20 9 - - - O3 (µg m-3) Min 0 15 2 4 1 8 1 9 9 10 17 7 5 12 Max 20 32 53 49 23 39 28 61 48 25 57 27 13 32 Mean 13 24 18 23 13 17 20 26 18 16 38 9 10 19 Median 15 23 14 22 12 15 20 20 16 15 40 8 10 18 StDev 5 5 10 9 3 7 4 14 7 4 7 3 2 5 TVOC (µg m-3) Min 0 0 0 0 0 52 0 0 0 0 0 0 0 0 Max 354 54 373 132 202 276 2320 197 307 20 388 0 0 12 Mean 17 3 8 8 92 141 104 8 5 2 12 - - 0 Median 0.00 0 0 0 90 115 0 0 0 0 0 - - 0 StDev 59 10 42 27 54 62 310 36 31 6 58 - - 1
A – Classroom A; B – Classroom B; C – Classroom C; LR – Lunch Room
8
3.1 TVOC and formaldehyde
152
TVOC mean concentrations from the studied class and lunch rooms in N_URB1, N_URB2 and
153
N_URB3 are represented in Figure 1 a), b) and c), respectively. N_URB4 is not represented in
154
Figure 1 because concentrations were zero or very close to zero (maximum concentration
155
observed equal to 4 µg m
-3) (Table 2).
156
(a) (b)
(c)
Figure 1 - Daily profile of TVOC mean concentrations registered indoors of a) N_URB1,
157b) N_URB2, and c) N_URB3.
158Although different concentrations and daily profiles were observed, it is clear that the presence
159
of TVOC occurred mainly during occupation periods, which seemed to be result of typical
160
children activities associated with the use of paints and glues. The concentrations measured
161
while the nursery schools were closed (night and weekend) were very close to zero, with
162
exception of classrooms A (both on weekdays and weekend), B and C (on weekdays) of nursery
163
school N_URB2 (Table 2) in which it seemed to exist a continuous source of VOC.
164
Additionally, peak concentrations were observed in the beginning of the morning, during or
165 0 20 40 60 80 100 120 140 160 180 200 220 240 0 1 2 3 4 5 6 7 8 9 10 11 12 13 14 15 16 17 18 19 20 21 22 23 T V O C ( µ g m -3) Hour
Classroom A - week Classroom A - weekend Classroom B Classroom C - week Classroom C - weekend Lunch room
0 200 400 600 800 1000 1200 0 1 2 3 4 5 6 7 8 9 10 11 12 13 14 15 16 17 18 19 20 21 22 23 T V O C ( µ g m -3) Hour
Classroom A - week Classroom A - weekend Classroom B Classroom C - week Classroom C - weekend Lunch room
0 20 40 60 80 100 120 140 160 180 200 220 240 0 1 2 3 4 5 6 7 8 9 10 11 12 13 14 15 16 17 18 19 20 21 22 23 T V O C ( µ g m -3) Hour
9
immediately after lunch time and in the afternoon. These TVOC concentrations in the indoor
166
air immediately before and/or after the occupation periods in the classrooms were associated
167
with the cleaning activities using products that emitted VOC.
168
Figure 2 shows the formaldehyde mean concentrations for a) classroom A (weekdays) and
169
lunch room of N_URB1, classroom C (weekdays) of N_URB2 and classroom A (weekdays)
170
and lunch room of N_URB3, and b) N_URB4. The formaldehyde concentrations for the
171
remaining studied rooms are not represented because concentrations were close to zero (Table
172
2) in all those cases, except for weekend on classroom A of N_URB4 which was due to
173
instrument error. No daily profile was found for formaldehyde concentrations on the different
174
studied rooms. The highest concentrations were observed in classroom C of N_URB2 during
175
weekdays, where there was a peak in the morning (after the opening hour), which decreased
176
through the morning until the period after lunch and a second peak (lower) was found about 5
177
p.m.. These peaks matched the periods of entrance and exit from the classroom. In the other
178
rooms represented in Figure 2 a) concentrations were close to zero. Regarding N_URB4, in the
179
lunch room, concentrations were close to zero, except at the beginning of the morning, during
180
and after lunch, also periods of entrance and exit. Indoor formaldehyde concentrations seemed
181
to indicate the presence of specific indoor sources for this pollutant, namely the use of materials
182
emitting formaldehyde (mainly furniture). The higher concentrations during occupation
183
periods, characterized by some peaks, seemed to be mainly related to entrance and/or exit
184
periods, associated with moving the furniture (tables and chairs).
185
(a) (b)
Figure 2 – Daily profile of formaldehyde mean concentrations registered indoors in a)
186classroom A (weekdays) and lunch room of N_URB1, classroom C (weekdays) of
187N_URB2, classroom A (weekdays) and lunch room of N_URB3; and b) N_URB4.
188 0 10 20 30 40 50 60 70 80 90 100 0 1 2 3 4 5 6 7 8 9 10 11 12 13 14 15 16 17 18 19 20 21 22 23 F o rm a ld e h y d e ( µ g m -3) HourN_URB1 - Room A - week N_URB1 - Lunch room N_URB2 - Room C - week N_URB3 - Room A - week N_URB3 - Lunch room
0 10 20 30 40 50 60 70 80 90 100 0 1 2 3 4 5 6 7 8 9 10 11 12 13 14 15 16 17 18 19 20 21 22 23 F o rm a ld e h y d e ( µ g m -3) Hour
10
Table 3 – Exceedances (%) to WHO guidelines and Portuguese legislation (2006 and 2013) reference values of formaldehyde and TVOC measured on weekdays and
189
only during occupation periods.
190
Nursery Room
Weekdays During occupation
Portuguese 2006 legislation WHO Portuguese 2013 legislation Portuguese 2006 legislation WHO
Formaldehydea TVOCb Formaldehydec Formaldehyded TVOCe Formaldehydea TVOCb Formaldehydec
N_URB1 A 1 0 1 0 0 2 0 2 B 0 0 15 0 0 0 0 22 C 0 0 0 0 0 0 0 0 LR 0 0 0 0 0 0 0 0 N_URB2 A 0 0 0 0 0 0 0 0 B 0 0 0 0 0 0 0 0 C 6 11 6 33 33 18 29 17 LR 0 0 0 0 0 0 0 0 N_URB3 A 0 0 0 0 0 0 0 0 B 0 0 0 0 0 0 0 0 LR 0 0 0 0 0 0 0 0 N_URB4 A 0 0 0 0 0 0 0 0 B 0 0 0 0 0 0 0 0 LR 0 0 1 0 0 0 0 0
a) % of the hourly mean concentrations above the reference value of 100 µg m-3; b) % of the hourly mean concentrations above the reference value of 600 µg m-3; c) % of the 30-min mean
191
concentrations above the reference value of 100 µg m-3; d) % of 8-hour running mean concentrations above the reference value of 100 µg m-3 ; e) % of 8-hour running mean concentrations above
192
the reference value of 600 µg m-3.
193 194
11
Table 3 shows the number of non-compliances and exceedances (%) to the standards and
195
guidelines referred in section 2.2. The values presented on the table are the percentage (%) of
196
the measured hourly means which were above the Portuguese 2006 reference values, the
197
percentage (%) of the 30-min means which were above the WHO reference value (only for
198
formaldehyde), and the percentage (%) of the daily maximum 8-hour running means which
199
were above the Portuguese 2013 reference values.
200
In few situations the recommended standard and guideline values for formaldehyde and TVOC
201
were exceeded. In the case of formaldehyde, the exceedances were mainly found during
202
occupation periods and mainly for the WHO reference value (WHO, 2010). A health risk
203
assessment approach could be important to assess the children’s health risks of short-term
204
exposure to those high concentrations, and to confirm if they are expected to cause mild or
205
moderate eye irritation.
206
Formaldehyde concentrations in N_URB4 were similar to those registered by Yoon et al. (2011)
207
in Korean urban pre-schools (45.27 µg m
-3), but far from those registered in Korean
208
kindergartens (162.69 µ g m
-3) (Yang et al., 2009). Both of those studies found much higher
209
TVOC concentrations (591.2 µg m
-3and 642.11 µg m
-3respectively), and both also concluded
210
that those problems in indoor air were caused by emissions from building materials and
211
furnishing, worsened by insufficient ventilation as concluded in Part I (Branco et al., 2015).
212
Formaldehyde concentrations found in classroom C of N_URB2 and in N_URB4 were often
213
found higher than those reported by Roda et al. (2011), both in hot and cold season (10.7 and
214
14.8 µg m
-3, respectively), and higher than those reported by St-Jean et al. (2012) (22.9 µ g m
-215
3
). The selection of classroom materials to use in nursery schools’ indoor environments should
216
be performed with extreme caution by choosing formaldehyde-free materials to safeguard
217
children’s health. Moreover, better ventilation (amount of fresh air and its distribution) could
218
help to reduce indoor formaldehyde and TVOC concentrations. It is important to notice that the
219
analysis performed in the present study were made for TVOC, but further investigations in
220
specific VOC are needed, as made in previous studies (Pegas et al., 2012; Roda et al., 2011;
St-221
Jean et al., 2012) which reported considerable indoor concentrations in nursery and primary
222
schools. That will allow comparing the results to better understand sources and pathways of
223
children’s exposure to specific VOC inside nursery schools.
224 225
3.2 CO, NO2 and O3
12
Figure 3 shows the CO mean concentrations in all the studied rooms of the four nursery schools
227
((a) N_URB1, (b) N_URB2, (c) N_URB3, and (d) N_URB4). It is possible to distinguish a
228
similarity in the daily profile, especially during weekdays, in all the studied rooms – an increase
229
in CO concentrations in the early morning and a decrease starting at the evening. During
230
weekend, CO concentrations seemed to have an almost constant profile along the day. In
231
general, CO concentrations were significantly lower (p < 0.05) in N_URB4 than in the other
232
three nursery schools. The highest concentrations were found on weekdays in classrooms A and
233
B of N_URB1 (respectively 4956 and 4347 µg m
-3) and the lowest were found in classroom B
234
of N_URB4 (close to zero) (Table 3). In N_URB2, CO concentrations in classroom C were
235
significantly lower (p < 0.05) than in the remaining rooms of that nursery school. In N_URB3,
236
CO concentrations in classroom B were significantly higher (p < 0.05) than in the other rooms
237
of that nursery school. As there were not found any indoor sources, outdoor CO concentrations
238
were expected to be the main determinant of the indoor concentrations registered.
239
(a) (b)
(c) (d)
Figure 3 – Daily profile of CO mean concentrations registered indoors of a) N_URB1, b)
240N_URB2, c) N_URB3, and d) N_URB4.
241 0 1000 2000 3000 4000 5000 6000 0 1 2 3 4 5 6 7 8 9 10 11 12 13 14 15 16 17 18 19 20 21 22 23 C O ( µ g m -3) Hour
Classroom A - week Classroom A - weekend Classroom B Classroom C - week Classroom C - weekend Lunch room
0 1000 2000 3000 4000 5000 6000 0 1 2 3 4 5 6 7 8 9 10 11 12 13 14 15 16 17 18 19 20 21 22 23 C O ( µ g m -3) Hour
Classroom A - week Classroom A - weekend Classroom B Classroom C - week Classroom C - weekend Lunch room
0 1000 2000 3000 4000 5000 6000 0 1 2 3 4 5 6 7 8 9 10 11 12 13 14 15 16 17 18 19 20 21 22 23 C O ( µ g m -3) Hour
Classroom A - week Classroom A - weekend Classroom B Lunch room
0 1000 2000 3000 4000 5000 6000 0 1 2 3 4 5 6 7 8 9 10 11 12 13 14 15 16 17 18 19 20 21 22 23 C O ( µ g m -3) Hour
13
NO2 mean concentrations registered in N_URB1, N_URB2 and N_URB3 are represented in
242
Figure 4 a), b) and c), respectively. NO2 mean concentrations in N_URB4 and in classroom B
243
of N_URB1 are not represented due to instrument error. The lowest concentrations were found
244
in N_URB1 and the highest in N_URB3 (Table 2). In fact, in classrooms A (both weekend and
245
weekdays) and B of N_URB1 concentrations were always very close to zero. Although with
246
significant differences amongst them (p = 0.06), classrooms of N_URB2 (weekdays), as well
247
as the studied rooms of N_URB3, showed higher values and significantly different profiles (p
248
< 0.05) than those observed in N_URB1. All of these three buildings were located in a busy
249
traffic street (N_URB1 and N_URB2 were located in the same street), but N_URB2 and
250
N_URB3 had a road junction with traffic lights next to the front façade of the building, which
251
could indicate higher NO2 emissions from the vehicles exhaust and consequently higher
252
concentrations of this compound entering into the building. In classroom A of N_URB2, both
253
in weekdays and weekend, there were found significantly higher values (p < 0.05) than in the
254
rest of that building, probably due to the location of this classroom (in the ground floor and with
255
windows in the front façade of the building). In the weekend at some classrooms, indoor NO2
256
concentrations were higher than in weekdays because as there was no ventilation during the
257
weekend, the high concentrations observed in Friday did not decrease maintaining a high and
258
almost constant daily profile during the whole weekend.
259 (a) (b) 0 20 40 60 80 100 120 140 160 180 200 0 1 2 3 4 5 6 7 8 9 10 11 12 13 14 15 16 17 18 19 20 21 22 23 N O2 (µ g m -3) Hour
Classroom A - week Classroom A - weekend Classroom B Classroom C - week Classroom C - weekend Lunch room
0 20 40 60 80 100 120 140 160 180 200 0 1 2 3 4 5 6 7 8 9 10 11 12 13 14 15 16 17 18 19 20 21 22 23 N O2 (µ g m -3) Hour
Classroom A - week Classroom A - weekend Classroom B Classroom C - week Classroom C - weekend Lunch room
14
(c)
Figure 4 – Daily profile of NO
2mean concentrations registered indoors of a) N_URB1, b)
260
N_URB2, and c) N_URB3.
261Figure 5 a), b) c) and d) shows the O3 mean concentrations determined in the studied rooms of
262
N_URB1, N_URB2, N_URB3 and N_URB4, respectively. It is possible to observe O3
263
concentrations with a similar order of magnitude among the different studied rooms in the four
264
nursery schools, and with no relevant variations along the day in all the studied classrooms. The
265
highest values were often found in the lunch rooms (Table 2) during or immediately after lunch
266
time, which in the absence of indoor sources might be associated with higher ventilation to
267
outdoors during daytime. The accumulation in those indoor microenvironments led to the O3
268
highest concentrations during the night and dawn found in the lunch rooms of N_URB3 and
269
N_URB4. In N_URB4, no relevant variations in O3 concentrations were found in the
270
classrooms. As there are no indoor sources, O3 concentrations indoors seemed to be associated
271
with outdoor concentrations.
272 (a) (b) 0 20 40 60 80 100 120 140 160 180 200 0 1 2 3 4 5 6 7 8 9 10 11 12 13 14 15 16 17 18 19 20 21 22 23 N O2 (µ g m -3) Hour
Classroom A - week Classroom A - weekend Classroom B Lunch room
0 10 20 30 40 50 60 70 0 1 2 3 4 5 6 7 8 9 10 11 12 13 14 15 16 17 18 19 20 21 22 23 O3 (µ g m -3) Hour
Classroom A - week Classroom A - weekend Classroom B Classroom C - week Classroom C - weekend Lunch room
0 10 20 30 40 50 60 70 0 1 2 3 4 5 6 7 8 9 10 11 12 13 14 15 16 17 18 19 20 21 22 23 O3 (µ g m -3) Hour
Classroom A - week Classroom A - weekend Classroom B Classroom C - week Classroom C - weekend Lunch room
15
(c) (d)
Figure 5 – Daily profile of O
3mean concentrations registered indoors of a) N_URB1, b)
273
N_URB2, c) N_URB3, and d) N_URB4.
274The outdoor mean concentrations of NO2 and O3 allowed obtaining a mean daily profile,
275
represented in Figure 6 a) and b) respectively. In both NO2 and O3 profiles a similar pattern was
276
found between weekdays and weekend with NO2 concentrations usually higher on weekdays
277
and with O3 concentrations usually higher on weekend. Daily variations in NO2 concentrations
278
boiled down to two significant peaks – one in the morning and another at the end of the
279
afternoon, matching the two traffic rush periods, as expected for urban areas (Wichmann et al.,
280
2010). From the O3 outdoor profiles, it is possible to observe the highest concentrations along
281
the afternoon, as expected (Sousa et al., 2009). These profiles were generally similar to those
282
typically found indoors, thus outdoor air seemed to be the main contributor to those
283
concentrations found indoors.
284
(a) (b)
Figure 6 – Daily profile of outdoors mean concentrations for a) NO
2 and b) O3.285 0 10 20 30 40 50 60 70 0 1 2 3 4 5 6 7 8 9 10 11 12 13 14 15 16 17 18 19 20 21 22 23 O3 (µ g m -3) Hour
Classroom A - week Classroom A - weekend Classroom B Lunch room
0 10 20 30 40 50 60 70 0 1 2 3 4 5 6 7 8 9 10 11 12 13 14 15 16 17 18 19 20 21 22 23 O 3 (µ g m -3 ) Hour
Classroom A - week Classroom A - weekend Classroom B Lunch room
0 10 20 30 40 50 60 70 80 90 100 0 1 2 3 4 5 6 7 8 9 10 11 12 13 14 15 16 17 18 19 20 21 22 23 N O2 (µ g m -3) Hour Weekday Weekend 0 10 20 30 40 50 60 70 80 90 100 0 1 2 3 4 5 6 7 8 9 10 11 12 13 14 15 16 17 18 19 20 21 22 23 O3 (µ g m -3) Hour Weekday Weekend
16
Table 4 – I/O ratios for NO2 and O3: median values observed in each studied site for weekdays and weekends, and respective minima (min) and maxima (max)
286
values.
287
Nursery Room NO2 O3
Weekday Weekend Weekday Weekend
N_URB1
A 0.02 (min-max: 0.00-2-26) 0.00 (min-max: 0.00-0.23) 0.16 (min-max: 0.00-1.15) 0.19 (min-max: 0.16-0.22)
B 0.00 (min-max: 0.00-0.00) - 0.33 (min-max: 0.21-0.50) -
C 1.88 (min-max: 0.50-4.41) 1.50 (min-max: 0.42-4.88) 0.24 (min-max: 0.03-6.11) 0.22 (min-max: 0.14-0.62)
LR 0.41 (min-max: 0.00-3.43) - 0.31 (min-max: 0.05-1-78) -
N_URB2
A 3.80 (min-max: 1.18-7.88) 6.19 (min-max: 1.63-13.73) 0.25 (min-max: 0.06-0.99) 0.20 (min-max: 0.16-0.50)
B 2.94 (min-max: 0.93-7.67) - 0.30 (min-max: 0.10-1.70) -
C 2.33 (min-max: 0.36-5.11) 2.42 (min-max: 0.71-4.68) 0.28 (min-max: 0.01-1.07) 0.27 (min-max: 0.18-0.65)
LR 1.98 (min-max: 0.79-4.20) - 0.42 (min-max: 0.11-2.49) -
N_URB3
A 4.20 (min-max: 1.46-15.93) 4.08 (min-max: 1.25-9.77) 0.33 (min-max: 0.17-1.08) 0.30 (min-max: 0.17-3-97)
B 2.70 (min-max: 1.07-5.65) - 0.22 (min-max: 0.14-1-07) - LR 6.79 (min-max: 2.99-17.49) - 0.57 (min-max: 0.26-1.07) - N_URB4 A - - 0.15 (min-max: 0.13-0.64) 0.19 (min-max: 0.12-0.53) B - - 0.79 (min-max: 0.12-8.03) - LR - - 2.53 (min-max: 0.30-19.88) - 288
17
Indoor concentrations were compared with those obtained outdoors using the I/O ratio. Outdoor
289
concentrations were obtained from an air quality station instead of measured simultaneously
290
outside each nursery school. Although the air quality station was representative of the study
291
area (CCDR-N, 2011), this might be a study limitation and results should be interpreted with
292
care. Table 4 shows mean I/O ratios (and minima and maxima) for NO2 and O3 in each studied
293
room. In N_URB1, NO2 I/O ratios were usually below 1, showing indoor concentrations lower
294
than outdoors, with the exception of classroom C, both in weekdays and weekend, although
295
there were ratios below 1 in these cases. In the case of N_URB2 I/O median ratios were often
296
above 1, and in N_URB3 all the I/O ratios were also above 1, which might be due to the steep
297
decrease of outdoor concentrations which were not followed by the same decrease indoors. As
298
indoor concentrations of NO2 in N_URB4 were usually zero, I/O ratios were not represented.
299
O3 I/O ratios in N_URB1, N_URB2 and N_URB3 were usually below 1 both during weekdays
300
and weekend. In N_URB4, the same was found in classroom A and B, but different results were
301
found in the lunch room (2.53), which might be also due to the steep decrease of outdoor
302
concentrations which were not followed by the same decrease indoors as referred for NO2.
303
Table 3 shows the exceedances (%) to the standards and guidelines referred in the section 2.2.
304
When there were more than one standard or guideline for the same pollutant, like in the case of
305
CO and NO2, Table 4 reports the most restrictive one (Portuguese 2006 legislation for CO and
306
WHO guideline for NO2). Although influenced by outdoor concentrations, the indoor O3, CO
307
and NO2 concentrations did not exceed the standards and guidelines used for comparison
308
referred in section 2.2. Zuraimi and Tham (2008) found much higher O3 concentrations (62.65
309
µg m
-3), mainly determined by outdoor concentrations, shelf area and table cleaning, but CO
310
concentrations observed in classrooms A and B of N_URB1, classrooms A, B and lunch room
311
of N_URB2 and in N_URB3 were higher than those found in that study (1266.38 µg m
-3only
312
determined by outdoor air). On the opposite, lower CO concentrations were found by Yang et
313
al. (2009) (524.42 µg m
-3) and by Yoon et al. (2011) (812.89 µg m
-3). Roda et al. (2011)
314
registered indoor NO2 concentrations comparable to those found in N_URB1 but much lower
315
than those detected in N_URB2 and N_URB3, ranging between 9.0 and 41.0 µg m
-3, which
316
were determined by outdoor air influence in the absence of indoor sources, mainly due to the
317
proximity to roadways with heavy traffic and by the fact that most of nursery schools’
318
classrooms were located on the ground floor. There were not found exceedances to the
319
Portuguese 2006 and 2013 standards for CO, O3 or NO2, which indicates that the registered
320
concentrations of those pollutants are not expected to cause health effects on children attending
18
these nursery schools. As expected, it is possible to observe from the results that the new
322
Portuguese legislation is less restrictive. Exceedances to Portuguese 2006 standards were
323
always higher during occupation periods than on weekdays in general. Moreover, it is also
324
important to refer that the results here presented were similar to those obtained in Portuguese
325
primary schools by Pegas et al. (2012) for NO2 and VOC. School activity and indoor sources
326
were also identified as increasing loadings of air pollutants in those primary schools, being
327
inadequate ventilation, specific indoor sources (especially for VOC) and outdoor influence
328
(NO2) the main determinants of IAQ.
329 330
4. Conclusions
331This study allowed a better understanding of the behaviour of several indoor air pollutants in
332
the studied nursery schools, with and without occupation. The influence of outdoor air seemed
333
to be determinant on O3, CO and NO2 indoor concentrations, and the observed formaldehyde
334
and TVOC peak concentrations indicated the presence of specific indoor sources for these
335
pollutants, namely materials emitting formaldehyde (mainly furnishing) and products emitting
336
VOC associated to cleaning and children’s specific activities (like paints and glues). For
337
formaldehyde, baseline constant concentrations along the day were also found in some of the
338
studied rooms, which enhances the importance of detailing the study of short and long-term
339
children’s exposure to this indoor air pollutant.
340
While CO, NO2 and O3 never exceeded the national and international reference values for IAQ
341
and health protection, exceedances were found for formaldehyde and TVOC. For this reason, a
342
health risk assessment approach could be interesting for future research to assess the children’s
343
health risks of short-term exposure to formaldehyde and to VOC concentrations.
344
Thus, improving IAQ is needed in the studied nursery schools. Besides the measures proposed
345
in Part I of this study, others like changing cleaning activities schedule (after the occupation
346
period), changing materials emitting formaldehyde and better ventilation while using products
347
emitting VOC (amount of fresh air and its distribution), could also be applied to reach the same
348
goal. It is important to take into consideration when applying these changes the conclusions
349
reported by Branco et al. (2014) concerning the concentrations of PM in the rooms. The study
350
of individual VOC should be done to better understand IAQ inside these nursery schools. These
351
recommendations can also be applied in a broader perspective, as the problems found in these
19
nursery schools are similar to others being reported in other nursery and even in primary
353
schools. Additionally, it could be also important to study other nursery schools to help
354
supporting these findings, not only considering urban traffic influence, but also including
355
suburban and rural contexts for comparison.
356 357
Acknowledgements
358The authors are grateful to the nursery schools involved in this study and to Comissão de
359
Coordenação e Desenvolvimento Regional do Norte (CCDR-N) for kindly providing the
360
outdoor air quality data. The authors are also grateful to Fundação para a Ciência e a
361
Tecnologia (FCT), COMPETE, QREN and EU for PTDC/SAU-SAP/121827/2010 funding.
362
PTBS Branco and SIV Sousa are also grateful to FCT, POPH/QREN and European Social Fund
363
(ESF) for the financial support of grants SFRH/BD/97104/2013 and SFRD/BPD/91918/2012,
364
respectively.
20
References
366 367
Branco, P. T. B. S., Alvim-Ferraz, M. C. M., Martins, F. G., Sousa, S. I. V., 2014. Indoor air
368
quality in urban nurseries at Porto city: Particulate matter assessment. Atmospheric
369
Environment. 84, 133-143.
370
Branco, P. T. B. S., Alvim-Ferraz, M. C. M., Martins, F. G., Sousa, S. I. V., 2015. Children's
371
exposure to indoor air in urban nurseries-part I: CO2 and comfort assessment. Environmental
372
Research. 140, 1-9.
373
Carreiro-Martins, P., Viegas, J., Papoila, A. L., Aelenei, D., Caires, I., Araujo-Martins, J., et
374
al., 2014. CO2 concentration in day care centres is related to wheezing in attending children.
375
Eur J Pediatr. 173, 1041-9.
376
CCDR-N, 2011. Remodelação da Rede de Medida da Qualidade do Ar da Região Norte -
377
Documento técnico. Comissão de Coordenação e Desenvolvimento Regional do Norte.
378
http://www2.ccdr-n.pt/fotos/editor2/ambiente/remodelacaorede.pdf.
379
Fonseca, J., Slezakova, K., Morais, S., Pereira, M. C., 2014. Assessment of ultrafine particles
380
in Portuguese preschools: levels and exposure doses. Indoor Air. 24, 618-628.
381
Franklin, P. J., 2007. Indoor air quality and respiratory health of children. Paediatric Respiratory
382
Reviews. 8, 281-286.
383
Geiss, O., Giannopoulos, G., Tirendi, S., Barrero-Moreno, J., Larsen, B. R., Kotzias, D., 2011.
384
The AIRMEX study - VOC measurements in public buildings and schools/kindergartens in
385
eleven European cities: Statistical analysis of the data. Atmospheric Environment. 45,
3676-386
3684.
387
Gładyszewska-Fiedoruk, K., 2011. Analysis of stack ventilation system effectiveness in an
388
average kindergarten in north-eastern Poland. Energy and Buildings. 43, 2488-2493.
389
HealthCanada, Residential Indoor Air Quality Guidelines. 2013.
390
Jones, A. P., 1999. Indoor air quality and health. Atmospheric Environment. 33, 4535-4564.
391
Lin, L.-Y., Chuang, H.-C., Liu, I. J., Chen, H.-W., Chuang, K.-J., 2013. Reducing indoor air
392
pollution by air conditioning is associated with improvements in cardiovascular health among
393
the general population. Science of The Total Environment. 463–464, 176-181.
394
Madureira, J., Paciência, I., Rufo, J. C., Pereira, C., Teixeira, J. P., de Oliveira Fernandes, E.,
395
2015. Assessment and determinants of airborne bacterial and fungal concentrations in different
396
indoor environments: Homes, child day-care centres, primary schools and elderly care centres.
397
Atmospheric Environment. 109, 139-146.
21
Ministério das Obras Públicas, Transportes e Comunicações. Diário da República - I Série, Nº
399
67, 2416-2468. , Decreto-Lei nº 79/2006.
400
Ministérios do Ambiente, Odenamento do Território e Energia, da Saúde e da Solidariedade,
401
Emprego e Segurança Social - Diário da República - 1ª Série, Nº 253, 6644(2)-6644(9). ,
402
Portaria nº 353-A/2013.
403
Nunes, R. A. O., Branco, P. T. B. S., Alvim-Ferraz, M. C. M., Martins, F. G., Sousa, S. I. V.,
404
2015. Particulate matter in rural and urban nursery schools in Portugal. Environmental
405
Pollution. 202, 7-16.
406
Pegas, P. N., Nunes, T., Alves, C. A., Silva, J. R., Vieira, S. L. A., Caseiro, A., et al., 2012.
407
Indoor and outdoor characterisation of organic and inorganic compounds in city centre and
408
suburban elementary schools of Aveiro, Portugal. Atmospheric Environment. 55, 80-89.
409
R Development Core Team, 2014. R: A Language and Environment for Statistical Computing.
410
R Foundation for Statistical Computing, Vienna, Austria. URL: http://www.Rproject.org/.
411
Roda, C., Barral, S., Ravelomanantsoa, H., Dusséaux, M., Tribout, M., Le Moullec, Y., et al.,
412
2011. Assessment of indoor environment in Paris child day care centers. Environmental
413
Research. 111, 1010-1017.
414
Sousa, S.I.V., Alvim-Ferraz, M.C.M., Martins, F.G., Pereira, M.C., 2009. Ozone exposure and
415
its influence on the worsening of childhood asthma. Allergy 64, 1046-1055.
416
Sousa, S. I., Ferraz, C., Alvim-Ferraz, M. C., Vaz, L. G., Marques, A. J., Martins, F. G., 2012.
417
Indoor air pollution on nurseries and primary schools: impact on childhood asthma--study
418
protocol. BMC Public Health. 12, 435.
419
St-Jean, M., St-Amand, A., Gilbert, N. L., Soto, J. C., Guay, M., Davis, K., et al., 2012. Indoor
420
air quality in Montréal area day-care centres, Canada. Environmental Research. 118, 1-7.
421
Theodosiou, T. G., Ordoumpozanis, K. T., 2008. Energy, comfort and indoor air quality in
422
nursery and elementary school buildings in the cold climatic zone of Greece. Energy and
423
Buildings. 40, 2207-2214.
424
WHO, WHO guidelines for indoor air quality: selected pollutants. World Health Organisation,
425
Regional office in Europe, European Series, Copenhagen, Denmark, 2010.
426
Wichmann, J., Lind, T., Nilsson, M.A.M., Bellander, T., 2010. PM2.5, soot and NO2 indoor–
427
outdoor relationships at homes, pre-schools and schools in Stockholm, Sweden. Atmospheric
428
Environment 44, 4536-4544.
429
Yang, W., Sohn, J., Kim, J., Son, B., Park, J., 2009. Indoor air quality investigation according
430
to age of the school buildings in Korea. Journal of Environmental Management. 90, 348-354.
22
Yoon, C., Lee, K., Park, D., 2011. Indoor air quality differences between urban and rural
432
preschools in Korea. Environmental Science and Pollution Research. 18, 333-345.
433
Zuraimi, M. S., Tham, K. W., 2008. Indoor air quality and its determinants in tropical child
434