Red wine sweetness preference according to consumer
segmentation
Maria Madalena CastelBranco da Silveira de Sena Esteves
Dissertação para a obtenção do Grau de Mestre em
Viticultura e Enologia
Orientador: Doutor Manuel José de Carvalho Pimenta Malfeito Ferreira
Orientador: Doutora Mariana Gomes Mota
Júri:
Presidente: Doutor Jorge Manuel Rodrigues Ricardo da Silva, Professor Catedrático do Instituto Superior de Agronomia da Universidade de Lisboa
Vogais: Doutor Manuel José de Carvalho Pimenta Malfeito Ferreira, Professor auxiliar com agregação do Instituto Superior de Agronomia da Universidade de Lisboa;
Doutora Sofia Cristina Gomes Catarino,Professora Auxiliar Convidada do Instituto Superior de Agronomia da Universidade de Lisboa
ii
Resumo
O presente trabalho pretendeu avaliar a aceitação e preferência do sabor doce num vinho tinto, de acordo com uma segmentação dos provadores em idade, género, tipo de personalidade, sensibilidade de boca e experiência de consumo de vinho.
Convidou-se um painel de 114 provadores com uma média de idades de 27 anos, para provar cinco pares de copos de vinho tinto seco com adições de glucose e fructose em iguais concentrações de 2 g/L, 4 g/L, 8 g/L, 16 g/L e 32 g/L, em que cada par de copos de vinho tinha um copo de vinho controlo, ao qual não foi adicionado açúcar e outro copo com vinho com açúcar. Os pares de copos de vinho foram apresentados por ordem crescente de concentração de açúcar dos 2g/L aos 32 g/L Foi também pedido aos provadores que respondessem a dois questionários no final da prova, o teste de personalidade
Big-5 Personality Test o teste de sensibilidade de boca, Vinotype. Os provadores foram agrupados em 5
segmentos: idade, género, categoria experiência no consumo de vinho, vinotype e 5 traços de personalidade. Para análise sensorial foram feitos testes de comparação emparelhada, ISO-5495.
A avaliação das respostas dos provadores permitiu obter uma curva de preferência pela doçura em forma de U invertido, tendo a preferência aumentado após 4g/L e diminuído após a concentração de 16 g/L. Entre as concentrações de glucose de 4 g/L e de 16 g/L os provadores demonstraram uma preferência pela doçura (p <0.05) com um máximo de 8 g/L. Finalmente foi também concluído que alguns segmentos influenciaram a preferência pela doçura num vinho: o género, o vinotype e a experiência de consumo de vinho na concentração mais alta de açúcar (32 g/L), e a extroversão na concentração de 8 g/L. Foram também descobertas interações entre segmentações, entre traços de personalidade como o neurotismo e a abertura à experiência, e, ainda, entre o género e a categoria experiência do consumo de vinho. Relativamente ao vinotype, chegou-se à conclusão que há uma preferência maior pela doçura dos vinotypes pela seguinte ordem Sweet> Hypersensitive> Sensitive>
Tolerant, na concentração de 32 g/L.
Palavras-chave: segmentação dos consumidores, análise sensorial, vinho tinto, vinotype, preferência pela doçura.
iv
Abstract
The present work aims to evaluate the acceptance and preference for sweet taste in red wine, according to consumer segmentation in age, gender, personality type, tasting sensitivity and consumer experience in wine.
A hundred and fourteen wine tasters were invited to the wine tasting, and the average age was 27 years. An addition of sugar was made with equal concentrations of glucose and fructose to the wine at 2g/L, 4g/L, 8g/L, 16g/L and 32g/L. Five pairs of glasses were presented for the subjects to taste containing each a control wine and a spiked sample. Pairs were presented in order of concentration, from 2g/L to 32g/l.
The subjects were also asked to answer two online questionnaires at the end of the tasting, on the personality types and vinotype, which is related to mouth sensitivity.
ISO-5495 paired comparison tests were used for sensorial analysis. The objective was to assess if any of the nine segmentation factors had influence on preference or rejection for spiked samples and to establish whether this preference was statistically significant.
We concluded that it would be important to have subjects with an age average higher than 27 years and more experienced in wine drinking, mostly because the data relative to preferences in novices shows some dispersion and lack of attention. A panel of older and more experienced wine tasters is likely to be more attentive and focused and therefore yield differentiated results. It was also concluded that more research is required to extend this investigation to other wine styles because the differences in preferences can depend on other reasons, such as preferring a wine with more or less sugar according to the type of wine. Finally it was concluded also that some variables influence preference for sweet taste in red wine, such as gender, vinotype and category of experience.
Key-words: segmentation, sensorial analysis, personality traits, vinotype, preference for sweet wine
v
Resumo alargado
O presente trabalho pretende avaliar a aceitação do doce num vinho tinto, de acordo com uma segmentação de nove factores: género, idade, cinco tipos de personalidade, sensibilidade gustativa e nível de experiência de consumo de vinho.
Estas segmentações foram escolhidas à semelhança de outros estudos sobre a preferência do doce nos vinhos, como o estudo de Blackman, Saliba e Schmidtke (2010) num tipo de vinhos da Austrália, os vinhos Semillon. Nesse estudo também foram estudadas as preferências dos provadores consoante o seu nível de experiência, tendo sido agrupados em três categorias: novatos, experientes e enólogos. Também num outro estudo foi avaliada a preferência pelo doce num vinho branco consoante traços de personalidade, (Saliba et al., 2009). Nesse estudo foram feitos testes de personalidade usando o teste “the big-five theory of personality” e os provadores foram divididos em dois grupos: os que diziam preferir doce e os que diziam não preferir doce. Um estudo de Kikuchi e Watanabe (2000) chegou à conclusão que indivíduos com uma preferência pelo doce têm níveis mais elevados de neuroticismo, um traço da teoria dos 5 grandes factores de personalidade.
Assim nasceu o interesse por realizar um estudo sobre um vinho tinto e o nível de aceitação do gosto doce nesse mesmo vinho consoante as características de cada provador.
Procedeu-se à preparação de uma prova de vinho no Instituto Superior de Agronomia. Foram convidadas 114 pessoas, das mais variadas áreas de trabalho, para provar cinco pares de copos de vinhos. Foram preparadas amostras de vinho às quais foram adicionadas concentrações de glucose e frutose, nas mesmas quantidades, em concentrações de 2, 4, 8, 16 e 32 g/l. Preparou-se também uma ficha de prova, para que cada provador ao longo da prova indicasse em cada par o copo de vinho que preferiu e respondesse a algumas perguntas que o definiram como sendo um consumidor de vinho experiente ou novato. Os provadores completaram também o Big 5-Personality Test e o myvinotype, testes para determinar o perfil de personalidade e a sensibilidade gustativa, respectivamente. As cinco características de personalidade descritas são openness (abertura à experiência), agreableness (agradabilidade), neuroticism (neuroticismo), extraversion (extroversão) e conscientiousness (ser consciencioso) e os quatro vinotypes possíveis são sensitive (sensível: Se), hypersensitive (hipersensível: HS), tolerant (tolerante: To) e sweet (doce: Sw). O nível de experiência, novato ou experiente, foi atribuído a cada provador consoante o número de vezes que bebe vinho durante a semana, há quantos anos bebe vinho e se se considera sabedor ou simples consumidor de vinho. Considera-se um consumidor experiente um provador que beba vinho mais de três vezes por semana, há mais de dez anos e que se considere sabedor.
vi
Os dados foram organizados sendo que a cada provador correspondeu uma idade, género, um dos quatro vinotypes, um nível de experiência, as cinco características de personalidade e a cada uma corresponde um valor de 1 a 5, que foram agrupados em duas classes, alta [3-5] (A) e baixa [1-3 [ (B).
Após as provas, foram realizados testes estatísticos aos dados, nomeadamente análises de variância a cada fator para cada concentração de açúcar. Utilizou-se o programa R para efetuar estas análises de variância.
Uma vez que após a resolução do teste de personalidade, a maior parte dos provadores obtiveram resultados elevados no traço de personalidade agradabilidade e houve poucos provadores com resultados baixos no traço de personalidade agreableness, não foi possível fazer a análise de variância deste fator. Os resultados foram tratados de acordo com uma análise à sua variância. Relativamente ao fator vinotype apenas houve diferenças significativas na maior concentração de açúcar, 32g/l, chegando-se à conclusão que nesta concentração limite, os provadores, relativamente ao vinotype, preferem esta concentração de açúcar pela seguinte ordem: Sw> HS> Se> To. O fator género também teve influência apenas na maior concentração de açúcar, sendo que a diferença significativa se deve ao facto de as mulheres serem quem prefere mais esta concentração máxima de açúcar. O fator experiência de consumo de vinho teve igualmente diferenças significativas na concentração mais elevada de açúcar, sendo que foram os consumidores novatos que revelaram a maior preferência pelos 32 g/L de açúcar no vinho. Relativamente ao fator de personalidade, apenas o traço de extraversion deu diferenças significativas na concentração média de 8 g/. Nas duas classes observadas deste traço, alta e baixa, a classe baixa revelou ser a que maior preferência teve pela amostra com 8g de açúcar. Os restantes fatores, idade e outros traços de personalidade não revelaram qualquer diferença significativa relativamente à preferência por uma determinada concentração de açúcar.
Conclui-se com este trabalho que será essencial melhorar este estudo com um painel de provadores mais experiente, mais atento e focado, para que as preferências dos vinhos sejam mais consistentes. Os resultados do estudo sugerem que as preferências podem estar relacionadas com os vários tipos de vinho pelo que um provador pode não gostar de vinho com a concentração de 16g/L e mostrar preferência na concentração de 32 g/L por o identificar como um vinho licoroso ou fortificado.
vii
1. Introduction
1
1.1. Importance of sensory analysis 1
1.1.2 Sensory attributes driving consumer acceptance of wine 2
1.1.3 Taste preferences 3
1.1.4 Sweet taste preference 4
1.2 Consumer segmentation 5
1.2.1 Personality traits 6
1.2.2 Category-level of experience 7
1.2.3 Taste phenotype 9
1.3 Aim of the study 10
2. Materials and Methods 11
2.1 Segmentation 11
2.2 Respondents 11
2.3 Wine 11
2.4 Colour determination and global phenolic compounds 12
a) Colour intensity 12
b) Tonality 12
c) Total pigments 12
d) Polymeric pigments 12
e) Polymerization index of pigments 13
f) Stained anthocyanins 13 g) Total anthocyanins 13 h) Tannic power 13 i) Total phenols 13 2.5 Testing procedure 14 2.6 Statistical Analysis 14 3. Results 15
3.1 Wine chemical analysis 15
viii
3.3 Hedonic responses to sweetness according to consumer segmentation 16
3.4 Sweetness preference according to consumer segmentation 26
3.5 Interaction between factors 29
4. Conclusion and perspectives 30
5. References 33
x
List of figures
Page
Figure 1- Number of subjects who preferred the spiked sample in preference to the control for each sugar level.………..18 Figure 2- Number of novices and experienced consumers who preferred the spiked sample to the control for each glucose level………..………..19
Figure 3- Number of females and males who preferred the spiked sample in preference to the control for each glucose level……….19 Figure 4- Class A [18-24] and class B [25-29] of ageswho preferred the spiked sample in preference to the control for each glucose level………..20 Figure 5- Number of Sensitive and Hypersensitive consumers who preferred the spiked sample in preference to the control for each glucose level……….………..21 Figure 6- Number of Tolerant and Sweet consumers who preferred the spiked sample in preference to the control for each glucose level……….21 Figure 7- Number of extroverts, that scored low (Class B) and high (Class A),who preferred the spiked sample in preference to the control for each glucose level………...……..22 Figure 8- Number of conscientiousness consumers who scored low (Class B) and high (Class A)who preferred the spiked sample in preference to the control for each glucose level………...……….23 Figure 9- Number of consumers with high or low (class A and B) neuroticism trait who preferred the spiked sample in preference to the control for each glucose level………..………..24
Figure 10- Number of high agreableness trait consumers who preferred the spiked sample in
preference to the control for each glucose level………...……..24 Figure 11- Number of high openness trait consumers who preferred the spiked sample in preference to the control for each glucose level……….……..……25 Figure 12-Means and standard errors in each vinotype. Sw-sweet, Hs- Hypersensitive, S-sensitive, To-tolerant……….…….29 Figure 13- Interaction between the factors gender and category………..…….30
xi
List of tables
Page
Table 1- Chemical analysis of the control wine and the sweetest spiked sample………..…16 Table 2- Mean values of each chemical parameter of control and wine samples spiked with increasing concentration of sucrose………...………..16 Table 3- Characterization of consumer segmentation, total of subjects for each e segmentation and class………...………..17 Table 4- Factors grouped in types of hedonic responses for sweetness…………...………..26 Table 5- Influence of each factor in sweet preference for the different sugar concentrations………...……….…….28 Table 6- Means and standard errors of the vinotypes………...……….29 .
xii
List of Equations
1) Intensity=A420+A520+A620 2) Tonality=A420/A520 3) Total Pigmentation=AHCL 520 4) Polimeric Pigments=ASO 2 520 5) IPP=ASO2 520/AHCl520× 100 6) SA=A520-ASO2520×20 7) TA= [AHCl 520 - ( 5 3×A so2 520)]×20 8) TP=(d-d0)/0,08xiii
List of abbreviations
RT - rejection threshold DT - detection threshold B.C - before Christ PROP - 6-n-propylthiouracil TP - tannic power TA - total acidity RS - residual sugarIPP - Polymerization index of the pigments SA - stained anthocyanins
d=solution turbidity
1
1. Introduction
Wine exists since the very beginning of civilization. The Greeks worshiped Bacchus and Dionysus, gods of wine, singing to them and compose lyrics about wine and its effects. Romans carried on with this cult. For thousands of years wine has been an evolving and fascinating product, composed by many different varieties, a product that brings pleasure to a great many people all over the world.
Across the centuries many famous people talked and wrote about wine. Homer wrote (928 B.C) “Wine can of their wits the wise beguile, make a sage frolic, and the serious smile.” Plato (400 B.C) said “Nothing more excellent nor more valuable than wine was ever granted mankind by God”, S. Thomas Aquinas (1225-1274) said “Sorrow can be alleviated by good sleep, a bath and a glass of wine”, Benjamin Franklin (1706-1790) once said “wine is a sure proof that God loves us and wants us to be happy”. Wine is generally described by as leaving people happier and more relaxed. It’s easy to see the importance of a good wine, suited to each individual, into different moments and events in life.
There are hundreds of wine types (e. g. dry, sweet, gasified) in the world, each with its own flavors and styles, because of the different varieties, production methods, time in barrels… Wine drinking is a key feature of social habits in western culture. It features prominently in books, plays and movies, paintings and other works of art.
The importance of wine since the beginning of civilization and its key role in social and cultural life, the impact it has in social interaction and the gratification it brings to individuals are the reasons why we seek to develop it to its greatest potential.
1.1 Importance of sensory analysis
According to Francis and Williamson (2015) the sensory properties of a wine are a major element that will determine its success with consumers. It has been only in recent times that the industry and research communities have started to apply the principles of sensory evaluation to quantify consumer preferences. Francis and Williamson’s review provides an overview of the current knowledge of the sensory attributes that have been found to be important to consumer preference and liking.
The overall aim of many grape and wine researches is to improve wine “quality”: providing ways of understanding, altering and controlling compounds that affect wine sensory properties through viticulture and winemaking to make consistently better wines. It is of the utmost importance for the wine industry to produce wines with sensory characteristics that appeal to consumers. In a global marketplace rigorous sensory evaluation has become more and more important. The lack of thorough sensory methods can result in faults being overlooked and less appealing wine styles
2
reaching the marketplace. It is therefore somewhat surprising that few wineries have embraced formal sensory analysis tests and even fewer consider conducting consumers testing. Wine is a constantly evolving product, meaning its sensory properties change over time in the marketplace, and conclusions drawn at the time of its release might not be sustained 1 or 2 years later. Winemakers can and should take consumer reaction to their wines into account through indirect measures, such as sales, feedback from cellar door visitors or even social media report. However these measures do not provide knowledge on which specific sensory characteristics of wine the consumers like or dislike. Other non-sensory information, such as wine brand, wine writer judgements and pricing is highly influential on the consumer reactions (Francis and Williamson, 2015).
Characterizing the sensory properties of a set of wines with a trained panel and a descriptive analysis procedure is not enough to be able to say that a particular wine is more appealing than another. In some cases, it can be inferred that a particular attribute is undesirable and that a wine with a higher rate of that attribute will be less appreciated, but this is not a strong basis for commercial decision making. For example in a study on the effect of yeast nutrients on Chardonnay wine sensory profiles (Torrea et al., 2011), some treatments resulted in wines with lower fruit or floral related aroma and flavor attributes, and higher solvent-like and acetic flavors. It can be assumed the latter will have lower acceptance amongst most wine drinkers, but this has not been confirmed by experimental data.
1.1.2 Sensory attributes driving consumer acceptance of wines
Thanks to several studies over the last 15 years on different wine styles, relationships between consumer hedonic response and wine sensory attributes as quantified by a trained sensory panel, it has been established that there are consistent wine sensory characteristics that drive acceptance. Multiple studies showed that consumer preferences are not homogenous and clear clusters of consumers based on preferences have emerged. Some studies have shown that consumers can be surprisingly responsive in their positive judgements to small sensorial differences in some key attributes.
Regarding white wines, a common finding in several studies is the importance for many consumers of acidity (sourness) (Lésschaeve et al., 2002; Lésschaeve and Findlay, 2005; Francis et al., 2010), bitterness and sweetness (Francis et al., 2010). Studies by Blackman et al. (2010) evidenced preference for added glucose, when using the paired preference method. Subjects choosing between two Semillon wines with different acidity levels consistently preferred a particular sugar level. Several studies show that bitterness generally emerges as a negative attribute for most consumers and winemakers must take this into account. Fruit intensity and type were also significant attributes, as shown in the study on Sauvignon Blanc wines (Lund et al., 2009).
3
In the case of red wines, in a significant number of studies the mainpreferred flavors were berry fruit and strong fruit, as opposed to relatively high bitterness, and sweetness, especially in those studies involving some wines with a relatively high glucose and fructose concentration. The presence of “Brett” related flavor was a common negative driver of liking as were sulfur-related flavor, oxidation related flavor and “green” or vegetal flavor. This was the case even in studies where wines were not assessed under double blind conditions (Mueller et al., 2010) which means that despite the effect of brand and price these sensory attributes exert a strong effect on consumer preference. Astringency is also an interesting attribute. Although it is sometimes indicated as a negative attribute for clusters of consumers, different from bitterness, in one study a correlation was found between an optimal level of astringency and liking in a sizeable proportion of consumers (Lattey et al., 2010).
1.1.3 Taste and flavor preferences
There are many studies about what influences taste preferences. Much research focuses on the influence of biological (Mennella et al, 1995), learning (Birch & Marlin, 1982) and socio-economic factors (Drewnowski, 2003) on food taste preferences. Research suggests that preference flavours of a pregnant woman are transmitted in the amniotic fluid, which is ingested by the foetus (Menella et al., 1995). Evidence further suggests that exposure of the unborn child to flavours in the amniotic fluid may contribute to taste preferences in later life (Beauchamp & Bartoshuk, 1997). Multiple studies suggest that taste is the primary driver of consumers’ food selection behavior, eclipsing cost, convenience and even its potential health value (Glanz et al., 1998; IFIC, 2011).
The measurement of taste detection thresholds dates back to Fechner and to the dawn of psychophysics 150 years ago (Engen, 1972; Duffy, et al., 2009a; Duffy, et al.,, 2009b). Harwood et al. (2012) investigated the food preference and the consumer rejection threshold for bitterness in chocolate milk, using segmentation based on the self-declared preference for milk or dark solid chocolate. In this investigation, to meet the demands of consumer it was important to determine the point at which concentration of bitter compounds in chocolate becomes objectionable, even for those who enjoy some degree of bitterness. The investigators quantified and compared differences in rejection thresholds (RjT) and detection thresholds (DT) in chocolate milk spiked with a food safe bitterant, using a paired preference test and the forced choice ascending method of limits. After running the tests the conclusion was that the DT was the same for the two groups of consumers, those who preferred chocolate milk and those who preferred dark solid chocolate, which suggests that the differential effect of bitterness on liking chocolate products is not based on the ability to detect bitterness. In contrast, the RjT it was 2.3 times higher for those preferring dark chocolate than the RjT for those preferring milk chocolate.
Prescott et al. (2005) adapted classical threshold method to directly address the question of acceptability of cork taint (TCA) in white wine. This approach of consumer rejection threshold has also
4
been applied to 1,8-cineole, known as eucalyptol, in red wine (Saliba et al., 2009). In this study the consumers’ preference for cineole concentration levels was compared for gender, experience, familiarity and self-reported liking for eucalyptus flavour, and also for preference compared with age and consumption frequency. The objective was to determine a consumer RjT for cineole and in doing so, determine whether the perceived flavour was positive at low levels and objectionable at higher levels. Results calculated the consumer RjT for cineole at 27.5 ppb and this level is well above the recognition threshold 3.2 ppb, which suggests that moderate levels of cineole are not considered negative or a “taint”.
1.1.4 Sweet taste preference
In a study conducted by DeSnoo (1937), an increase in foetal gulp rate was found in response to injections of saccharin into the amniotic fluid during pregnancy, which raises the possibility that the response to sweet taste is innate. It is likely that “humans are born with an innate preference for sweet tastes and distaste for bitter and sour tastes (…)” (Desor et al., 1975). The conventional explanation for this distaste adaptation is that bitterness signals dietary danger such as poison which therefore is to be avoided, while “sweetness is a proxy for food containing high amounts of energy (…)” (Drewnowski and Gomez-Carneros, 2000).
Sweet taste preference and acceptance in wines has been studied in the last few years. There are many anedoctal stories about consumer preference for sweetness, yet there is limited empirical research on this topic. Research that has been reported is equivocal, because key constructors, such as “consumer”, ”experience” and “sweetness” have not been consistently applied. Early research found that American consumers have a preference for sweet rather than for dry wines (Filipello et al, 1955).
The relationship between sweetness and consumer preference for Moselle wine determined that a residual sugar level between 10 and 24 g/L was favoured (Kielhofer, 1955). In a study investigating different sweeteners for Seyval Blanc and Elvira wine, using five experienced tasters, a linear relationship between residual sugar and preference was found (Duitshaever et al, 1980). This research indicated an increasing preference for Seyval Blanc with up to levels of 25 g/L residual sugar and 37g/L for the Elvira varietal wine.
A study about sweet taste preference and personality traits (Kikuchi & Watanabe, 2000) found a preference for sweet and salty taste in people exhibiting high levels of the trait neuroticism; however the sample was based on junior students from a Tokyo University, with five times as many females than males. In a research using white wine Saliba et al (2004) found that participants with a sweet taste preference in white wine reported significantly higher levels of impulsiveness, but significantly lower levels of openness.
5
There have been studies on preference based on nationality. A study by Lattey et al, (2007) on Australian consumer preference showed that the sweetest wine was the most preferred in a range of Shiraz and Cabernet Sauvignon wines. Chinese consumers have demonstrated preference for a moderate level of sweetness in Australian red wines (Francis et al., 2009). In 2012, after comparing Chinese and Australian consumers’ liking responses for red wine, it was found that all have broadly similar preferences (Williamson et al., 2012).
Another study with Hunter Valley Semillon wines demonstrated that different consumer groups based on knowledge, experience and involvement in wine industry, preferred different levels of residual sugar and sweetness (Blackman et al. 2010). Experienced consumers preferred wines with less added glucose than the novice group and significant differences existed at high glucose additions (32 g/L). This study confirmed the necessity to control for level of experience within a general consumer group, not just between novices and experts.
Even in international wine challenges, where specialists are the majority of tasters awards like the “Great Gold” tend to be given to wines with higher sugar level and high ethanol content (Loureiro
et al., 2016).
1.2
Consumer segmentation
Segmenting is, as its most basic, the separation of a group of customers with different needs into subgroups of customers with similar needs and preferences (Gupta, 2014). By doing this, a company can better tailor and target its products and services to meet each segment’s needs.
In this research, the following questions are crucial: who are the drinkers, who drinks wine, which wine is drunk and why it is drunk, so that the best wine can be found for each segment, that is, for each group of persons. First, it is essential to make an attitude segmentation, which means trying to identify differences in customer groups based for example on their purchase and life style patterns.
It is important to take gender under consideration because it is widely accepted that being a woman or a man really influences one’s actions, relations, preferences, notion of the world itself. This research involved 41 female and 59 male subjects answering all the questions, as multiple studies have consistently shown that when clusters exist with distinct liking responses, more consumers should be used and researchers should aim to have at least 40 responses per cluster in order to allow meaningful interpretations (MacFie, 2007).
6
More recently, studies were conducted on the influence of personality traits on taste preferences. However, many of these studies on influence of personality on taste preference have simply asked participants to self-report on their preferences. An obvious disadvantage of this kind of measure is that socially desirable answering tendencies can be fairly strong (Gerding and Weinstein, 1992). In later years, some studies started making blind tastings in an attempt to minimize the effect of social desirability (Saliba et al. 2009).
Francis and Williamson (2015) consider that the inclusion of measurements of personality traits is of interest for winemakers. It is likely that people who have an interest in wine and are willing to spend quite large sums of money in buying them, will have certain psychological personality traits, such as interest in new experiences, high sociability, an intellectual interest in wine flavor differences or a desire to signal their taste to others. While there has been limited work investigating this area, it has been shown that there is a generally positive link between extraversion, impulsivity, and neuroticism and alcohol use and a negative link with conscientiousness (Zhang et al. 2015). Saliba et al (2009) in a simple paired test preference in a small sample indicated that sweetness preference in a white wine with added sugar was linked to lower openness. A study involving aroma characterization and liking of a set of Italian red wines (Torri et al., 2013) showed a link between “innovativeness” (related to openness) and consumers who could reliably differentiate samples. More studies would be necessary to assess whether differences in preferences might be related to personality traits which are easy to measure.
Research on personality traits provides evidence of five factors – the ‘Big Five’ theory of personality that involves the independent traits of extraversion, neuroticism, openness, conscientiousness and agreeableness (Hogan et al., 1997). Based on this theory the Big Five test personality evaluation test has been devised. Extraversion reflects how much the individual is oriented towards things outside him and derives satisfaction from interacting with other people. Neuroticism is the tendency to experience negative emotions. Openness to experience has been portrayed as a proxy measure of the willingness to explore new and unfamiliar experiences, ideas and feelings (Costa and McCrae, 1992), while conscientiousness refers to persistence, perfectionism and self-discipline (Brummet et al., 2008). Agreableness means being sympathetic, kind, affectionate and reflects how much an individual likes and tries to please others. A preference for sweet and salty taste in people who score high in the neuroticism trait was found in 2000 (Kikuchi and Watanabe, 2000). However the sample used had five times more female judgements than male ones. Openness and conscientiousness in particular may play a role in mediating taste preference.
1.2.2 Category - level of experience (Pedir ao Prof os limiares de percepção Açúcar- by prof sofia)
7
For many years in wine research, the use of expert winemaker panels was the primary tool to allow evaluation of sensory outcomes of studies. However, it is particularly concerning the fact that expert quality judgement does not necessarily relate to consumer liking or preference. There was some consumer testing in the late 1950’s, with a report (Filipello and Berg, 1959) that outlined studies carried out in the California wine industry using the nine-point hedonic scale (Jones et al, 1955), which is still a widely accepted scale for assessing food liking or disliking including wine (Frost and Noble, 2002; King et al., 2010; Lattey et al., 2010). In these early California studies subjects were recruited at wine fairs, to assess the level of sweetness in different wine styles in an attempt to provide advice to producers regarding products that were appreciated by consumers in order to increase wine sales. However, there appears to have been little of use of consumers in wine research until recent times.
Prior to 2000, there was a limited use of inexperienced consumers using the paired preference procedure to assess differences amongst research treatments, using small panels of 10 or 20 individuals, (but these studies did not pre-test the samples to confirm whether the wines tested were actually perceptibly different, which is a danger when conducting this kind of test). Accepted practice of consumer preference judgements recommends the use of a much larger number of consumers so as to have sufficient discrimination and statistical power, given the variability in consumer responses.
Sweetness acceptance of consumers with different degrees of experience was investigated in order to understand how much years of experience and frequency of drinking wine can affect the acceptance of sweetness in wines. Frost and Noble (2002) designed a study to assess differences in wine knowledge which showed only a weak effect of wine expertise, where a group with a medium degree of wine knowledge rated liking higher in a Sangiovese wine with a moderate sensory attribute intensity than the wine experts. In a study with 109 New Zealand consumers (Lund et al., 2009) the 77% of the subjects who preferred the strongly fruity style of Sauvignon Blanc were younger consumers (under 34 years), regularly drank Sauvignon Blanc, and were more likely to spend more money on wine. The 23% who preferred the less fruity wines comprised more females and many more red wine-only drinkers. In a study with a narrower range of wines differing only in aroma compounds (King et al., 2011), there was a surprisingly strong difference amongst the consumer-liking clusters, with the cluster that preferred the “tropical fruit” wines and disliked wines with “fresh green” attributes comprising more females, those with relatively low wine knowledge, and more frequent drinkers of New Zealand Sauvignon Blanc. In the same study more males with high wine knowledge disliked wines with higher tropical fruit and cat urine aroma. The self-reported liking and consumption frequency for New Zealand Sauvignon Blanc related well to the liking responses for the fruity/green wines in this study.
In the Lattey et al. (2010) study, differences between the clusters related most strongly to the number of years drinking wine rather than to age or any other demographic, self-reported wine knowledge or usage data. A study deliberately selecting consumers with differing consumption habits
8
and demographics backgrounds (Lésschaeve et al., 2012) found a consumer cluster that preferred slightly sweet, fruity white wines. This cluster comprised significantly younger wine consumers, with a higher education level, a lower household income, who drank wine more frequently in a restaurant and who stated that they knew little about wine. The cluster that preferred wines with higher oak-related wine attributes, as well as higher alcohol and dry/astringency character, had more consumers who stated that they were very knowledgeable. In a study assessing Australian consumer preferences, it should be noted that glucose and fructose in red wines could be perceptibly sweet even at concentrations as low as 4g/L (Williamson et al., 2012). These authors showed that the cluster liking sweeter red wines with red berry attributes had a lower proportion of experienced wine consumers, while the cluster appreciating wines with higher alcohol, oak and dark fruit attributes had the higher proportion of older consumers who had been drinking wine for a longer period of time.
Knowing that wine experience is related to consumer preference, a study was conducted to assess the effect of repeated exposure to two red wines types over six separated occasions, on liking of a set of red wines (Osidacz et al., 2011). In this study the consumers responded differently to the repeated exposure depending on their wine drinking experience. For consumers relatively new to wine (having less than 5 years drinking experience), after exposure to a relatively sweet, red berry-flavored wine with low bitterness and astringency, preference moved more strongly to this wine style. For the novices consumers who repeatedly exposed to a dry wine style with higher dark fruit and oak flavor, their preferences similarly changed to wines of this type. This dark fruit wine wasn’t liked either before or after the exposure, most likely because its relatively high level of bitterness and astringency. The long-term consumers behaved differently, changing little in their liking response after exposure to the slightly sweet red wine, but with increasing preference towards for the red berry-flavored, sweeter wines after exposure to dark fruit. It is possible that the recent wine consumer’s increase in liking for the dark fruit style wines after exposure to this style was because they were previously less familiar with this style, while long-term consumers, having greater experience with this style and not liking it particularly, reacted by preferring the red berry fruity styles.
In conclusion, in several of these studies, degree of wine experience is a common factor that differentiates consumer preference differences. Familiarity with wine and previous exposure to style, together with years of drinking wine, appear to be key aspects that discriminate preference groups.
1.2.3 Taste phenotype
Genetic variation in taste was measured by the perceived bitterness of PROP (6-n-propylthiouracil) which is influenced by genetic, hormonal and pathologic factors, and density of fungiform papillae on the anterior portion of the tongue (influenced primarily by genetic factors) (Bartoshuk and Duffy, 2000). PROP is a genetics determinant marker in taste. Individuals who perceive
9
PROP as exceptionally bitter can also perceive sugars as sweeter, other bitters as more intense and dietary fats as more creamy and/or viscous than individuals who perceive PROP as a weaker bitter.
Bartoshuk and Duffy (2000) examined the association between genetic variation in taste and sweet acceptance (as well as high-fat, bitter foods and beverages). The influence of genetic variation in taste depends on how perceptible sweet, fat or bitter components are in foods and beverages, as well as on the value of sensory factors vs other factors (health and convenience) on personal dietary choices. In women, liking of sweet and high-fat food and beverages groups decreased with increasing perceived bitterness of PROP. In men, liking of these foods and beverages increased with increasing papillae densities. The intensity of many tastes depends on the perceived bitterness of PROP which varies across tasters, and this has led to subdividing tasters in two classes: medium tasters (those rating PROP as moderately bitter) and supertasters (those rating PROP as exceptionally bitter. As a result, three types of tasters were proposed: nontasters, medium tasters and supertasters.
The influence of genetic variation on perceived intensity and preference for sweetness was investigated in a study by Peterson et al. (1999) which tested if the perceived bitterness of PROP was associated with perception and preference for sweetness intensity in sucrose solutions given to the subjects. In summary, appropriate scaling techniques can reveal associations between the perceived bitterness of PROP and the perceived intensity and preference for sweet solutions and common sweet foods. Supertasters of PROP may find some sweet foods less pleasant because the sweetness is too intense for them.
An indirect method of taste phenotype evaluation was proposed by Hanni (2013), based on studies on genetic variation in taste. This author created an online tool for wine consumers and a wine recommendation platform for wine-related businesses (www.myvinotype.com). It establishes the consumer’s sensitivity to wine, assesses his particular taste sensitivities and tolerances and then introduces him to wines that will appeal to his unique, personal combination of sensitivities and values. The vinotypes described are Sweet, Hypersensitive, Sensitive and Tolerant. The “sweet type” is at the top end scale in terms of sensory sensitivity and sweet vinotypes are defined in simple terms as always having a preference for sweet wines, tending to prefer more delicate styles, lower alcohol content wines and reds which are especially rich and smooth because of their highly sensitive sensory perception. Roughly 70% of this vinotype are female and 30% are male. Sensitive vinotype is at the center of the sensory sensitivity spectrum, it is the largest segment and people included in it are more apt to enjoy the widest range and diversity of wine styles. A sensitive vinotype person is defined as being flexible, adaptable, adventurous and a champion of “context” for finding just the “right” wine. Hypersensitive vinotype people are described as tending to love exploring and discovering all sorts of new wines but with very clear preference parameters. The last type, tolerant vinotype defines people who like intensity and lots of flavor.
10 1.3. Aim of the study
This research was based on two previous studies, one on the sweetness acceptance by tasters with different expertise categories (Blackman et al., 2010) and the other on sweet taste preference according to personality traits (Saliba et al., 2009). The main objective of this research was to establish a relationship between the preference and acceptance of sweetness in red wine with personality-types, age, gender, vinotype and experience and frequency of drinking wine.
In particular, the objectives of the study were:
1. To determine the preference for sweetness in red wine with a large group of consumers.
2.
To understand the preference for sweetness according to consumer segmentation.3. To help wine professionals understand consumers’ behavior in order to improve their wines’ acceptance.
Specifically in this research it was important to explore the differences that lead to a preference for sweetness in a red wine, a subject which has not been studied as far as we are aware. In addition, recent research performed in our laboratory has showed that higher prized wines have relatively high sugar levels (Loureiro et al., 2016) Therefore, it would be interesting to study the preference for sweetness with a large tasting panel aiming to find differences according to tasters’ segmentation. These differences can be related to demographic data, such as gender and age, wine involvement and experience, or more complex factors such as psychological profile and genetically based physiological differences, all of which have been explored in food consumer sensory studies but for which available research in wines is scarce.
11
2. Material and Methods
2.1 Consumer segmentation
Consumers were initially asked to answer some questions in order to divide them into the following classes: gender, age, personality type, vinotype and category of wine drinking experience.
On the age dimension this study panel had four classes of ages: class A ages [18-24], class B ages [25-29], class C ages [30-39] and, class D ages [40-60].
To evaluate personality, subjects took the Big 5 personality-test (Hogan et al., 1997), which consists in 50 questions to be answered online on the 5 personality traits: openness to experience, conscientiousness, extraversion, neuroticism and agreeableness. These traits were rated from 1 to 5, and grouped in two classes, higher scorers, class A for the scores from [3-5] and low scorers, class B from [1-2]. This test is presented in the annexes with the translation (annex 5) (www.personality-testing.info/tests/IPIP-BFFM/).
The influence of taste phenotype was evaluated by means of an online questionnaire (www.myvinotype.com) taken in the same room as the tasting test, following the method described by Hanni (2013). The different vinotypes were Sweet, Hypersensitive, Sensitive and Tolerant.
This research also adopted a two-category consumer model: novice consumer and experienced consumer, based on a combination of self-reported consumption, years of experience in drinking wine, wine knowledge, and involvement in the wine industry, consistent with previous research (Melcher & Schooler, 1996). A novice is an individual who has been a wine consumer for less than 10 years, that drinks less than three times a week and who does not self-report as being “knowledgeable”. An experienced consumer is an individual who has been a wine consumer for more than 10 years, drinking at least several times a week and who self-reports as being “interested” or “knowledgeable”. The respondents who reported being wine consumers for less than 10 years but also as “knowledgeable” were also classified as experienced consumers.
2.2 Respondents
One hundred and fourteen participants were recruited from ISA college and other external backgrounds such as medicine, law and engineering. The average age of the participants was 27, ranging from 19 to 56 years old.
2.3 Wine
The wine used to determine the preferred sweetness level came from ISA’s own cellar and was made with the Syrah (80%), Touriga Nacional, Cabernet and Trincadeira varieties (20%). It’s
12
from the 2014 year, from the region of Lisbon. It was spiked with different levels of a solution made up of equal quantities of glucose (ITW company, A1349) and fructose (SIGMA, Aldrich, St.Louis USA). Participants were asked to compare the base wine (control) with the adulterated wines at each glucose and fructose addition level (2, 4, 8, 16, 32 g/L glucose+fructose) and indicate their preference on a scoresheet. Base wine position (left or right) was randomised. Wines were first analyzed on pH, total acidity, volatile acidity, free and total sulfur dioxide, reducing substances and alcohol strength. The characterization of colour and phenolic compounds was performed using the following methods (Somers and Evans methods), in triplicate.
2.4 Colour determination and global phenolic compounds
The five spiked samples were analyzed to determine if there was any difference in the colour and phenolic compounds. Colour intensity, tannic power, total phenols, polymeric pigments, pigment polymerization index, total pigments, total and stained anthocyanins and tonality were all analyzed in the Ferreira da Lapa Laboratory.
a) Colour intensity
The method proposed by Somer and Evans (1977)was used to determine the colour intensity, which is defined as the sum of the absorbances at 420 nm, 520 nm and 620 nm. The results are expressed in absorbance units (ua).
Intensity=A420+A520+A620
b) Tonality
Colour tonality is the division between the absorbance at 420 nm and the absorbance at 520 nm (Sudraud, 1958). The results are expressed in absorbance units (ua).
Tonality=A420/A520 c) Total Pigments
Total Pigments was determined by the absorbance at 520 nm, as described in the Sommers and Evans (1977) method.
Total Pigmentation=AHCL 520
13 d) Polymeric pigments
The method used by Sommers (1971) is to read the absorbance in the presence of the bisulfite ion. The results are expressed in absorbance units (ua).
Polymeric Pigments=ASO 2 520
e) Polymerization Index of the pigments (IPP)
The method proposed by Evans and Sommers (1977) defines this index as the existing proportion of colour in the wine.
IPP=ASO2
520/AHCl520× 100
f) Stained Anthocyanins
Stained anthocyanins are obtained by the difference between absorbance at 520nm before and after discoloration with HSO3- ion, according to the method is proposed by Somers and Evans (1977).
Results are expressed in mg/l of malvidin-3-glucoside.
SA= A520-ASO2520
g) Total Anthocyanins
The method proposed (Sommers and Evans, 1977) defines the determination of total anthocyanins as the difference between the 520 nm absorbance’s in acid medium, before and after the discoloration of ion bisulfite. The results are expressed in mg/l of malvidin-3-glucoside.
TA= [AHCl 520 - ( 𝟓 𝟑×A so2 520)]×20 h) Tannic Power (TP)
Tannic power corresponds to the expression of tannins in the wine which is the capacity of some phenolic compounds to interact with proteins, which gives a more astringent character to the wine tasted. The method used was described by Freitas and Mateus (2001). The results are expressed in NTU/ml, d=solution turbidity, d0=blank solution turbidity.
14 i) Total Phenols
Total phenols are determined by the polyphenols total index, which is obtained from the product of the absorbance at 280nm by the dilution factor of the wine sample. This is a method proposed by Ribéreau-Gayon (1970). Results are expressed in mg/l gallic acid.
Polyphenols Total Index= A280 ×100
2.5 Testing Procedure
Participants were tested individually in a quiet clear room without any noticeable smells. They were told that the research was on the effects of gender, age, years of wine drinking experience, sensitivity and personality types on red wine taste preference. No information was given on the wine such as its variety or origin, as this could influence participant’s choices.
For the tasting 16 bottles of wine each with 0.75 L were used: six bottles with control wine and the remaining ten divided in five pairs, two for each spiked concentration (2 g/L, 4 g/L, 8 g/L, 16 g/L, 32 g/L). The glasses used to taste the wine were the IDEAL 6019 (Shott Zwiesel, Germany) standard tasting glasses.On each table other than the glasses of wine there was a glass of water, a spittoon and a laptop for the respondents to take the personality-test and vinotype test. A translated version of the Big 5 personality-test in paper format was also available.
Participants were presented with two questionnaires, “Big 5 Personality test” and “Myvinotype”. They were required to complete them by replying to the questions as honestly as possible with the first answers that came into their mind. Once the questionnaires had been completed, paired comparison tests in wine tasting were conducted in accordance with the method in ISO-5495 Paired Comparison and as applied in Prescott et al., (2005).
Each paired sample had a control wine and a spiked wine and was presented with in increasing concentration sugar levels in the adulterated wine, so as to prevent palate fatigue. Respondents were instructed to taste the wine, expectorate, rinse their mouth with water and wait 1 min before going on to the next sample. The wine was served in glasses, labelled with a 3-digit numbers code. Participants were given as much time as they needed to complete this test and released after tasting all the samples.
15
2.6 Statistical Analysis
Results obtained from respondents were subjected to variance analyses (α=0.05) with software R (www.r-project.org) to assess the influence of each segmentation type on sweetness preference. Homogeneity of variances was assessed with Bartlett’s test (non parametric data) or Levene’s test (parametric data). When homocedasticity (homogeneity of variances) was verified, factorial analyses combining more than one segmentation type were performed to evaluate interaction effects. For the segmentation types that showed influence on sweetness preference, mean comparisons were performed with Tukey’s test α=0.05.
16
3. Results
3.1 Wine Chemical Analysis
The red wine used in tastings was analyzed to check changes in chemical composition induced by sugar addition. The results, listed in Table 1, show that there was no significant differences between the sample spiked with 32 g/l and the control wine (p<0.05).
Table 1. Chemical analysis of the control wine and the spiked sample with the highest sugar level.
Wine sample
Sulfur dioxide pH Reducing
substances
Alchool Total Acidity
Volatile acidity
free SO2 total SO2 % vol g/L tartaric acid g/L acetic acid
control 36 mg/L 200 mg/L 3.78 1.4 g/L 13.90% 4.5 g/L 0.78 g/L [32g/L] 32 mg/L 190 mg/L 3.76 31.5g/L 13.80% 4.5 g/L 0.78 g/L
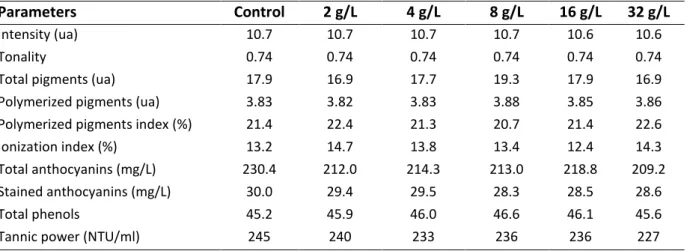
Table 2. Mean values of each chemical parameter of control and wine samples spiked with increasing
concentration of Glucose and Fructose.
Parameters Control 2 g/L 4 g/L 8 g/L 16 g/L 32 g/L
Intensity (ua) 10.7 10.7 10.7 10.7 10.6 10.6 Tonality 0.74 0.74 0.74 0.74 0.74 0.74 Total pigments (ua) 17.9 16.9 17.7 19.3 17.9 16.9 Polymerized pigments (ua) 3.83 3.82 3.83 3.88 3.85 3.86 Polymerized pigments index (%) 21.4 22.4 21.3 20.7 21.4 22.6 Ionization index (%) 13.2 14.7 13.8 13.4 12.4 14.3 Total anthocyanins (mg/L) 230.4 212.0 214.3 213.0 218.8 209.2 Stained anthocyanins (mg/L) 30.0 29.4 29.5 28.3 28.5 28.6 Total phenols 45.2 45.9 46.0 46.6 46.1 45.6 Tannic power (NTU/ml) 245 240 233 236 236 227
Every sample respected the criteria of homogeneity of variance. Variance analysis was then performed and showed that there was no significant difference in any of the parameters for all the six wines. Levene’s test was conducted in some samples in the R program.
3.2 Characterization of consumer segmentation
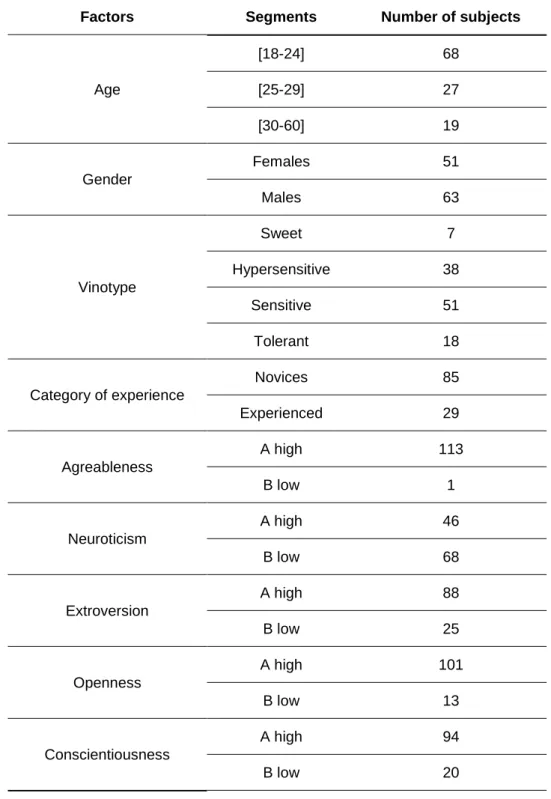
In table 3 is presented the number of subjects for each segment in each factor. It’s clearly that some of the factors did not have the same number of subjects for each segment, and for that reason, the statistical analysis wasn’t possible to be made on the factor agreeableness, for example. It is also shown a large discrepancy between the sweet vinotype subjects and the others vintoypes, and also between the high and low subjects on the openness and conscientiousness factors.
17
Table 3. Characterization of consumer segmentation, total of subjects for each segmentation and class.
Factors Segments Number of subjects
Age [18-24] 68 [25-29] 27 [30-60] 19 Gender Females 51 Males 63 Vinotype Sweet 7 Hypersensitive 38 Sensitive 51 Tolerant 18 Category of experience Novices 85 Experienced 29 Agreableness A high 113 B low 1 Neuroticism A high 46 B low 68 Extroversion A high 88 B low 25 Openness A high 101 B low 13 Conscientiousness A high 94 B low 20
3.3 Hedonic responses to sweetness according to consumer segmentation
The overall preference for sweetness is represented in Figure 1.1 which shows the number of subjects who preferred the glucose and fructose spiked wine sample at each concentration in all
18
consumers segments. Using the 0,05 confidence level for paired comparison tests, the maximum level of glucose that could be added and still preferred by all the subjects in comparison to the control wine was 16 g/L of glucose and fructose. The minimum level of sugar that had to be added for all the subjects start preferring the spiked wine was 4 g/L of sugar. Therefore, the spiked wine samples preferred to the control wine by the entire tested panel were those between 4g/L and 16 g/L. As can be observed the preferences’ curve has an inverted U shape.
When it comes to level of experience in drinking wine, differences were found in the preferences for sweet between the experienced and the novice group. The experienced consumers group did not show any preference for sweet at any concentration, while the novice group show preference for the maximum levels of glucose and fructose at 8, 16 and 32 g/L. Novice consumers showed a clear preference for sweetness in wine as represented in figure 2.
0 10 20 30 40 50 60 70 80 2g/l 4g/l 8g/l 16g/l 32g/l N u m b e r o f co n su m e rs Added sugar (g/L)
Figure 1. Number of subjects (♦) who preferred the spiked sample in preference to the control for
each sugar level. Dotted line (n = 68) represents minimum agreeing judgements necessary to establish preference using α=0,05 for paired comparison tests (total number of tasters N=114).
19
When it comes to gender differences, figure 3 shows that females preferred the spiked sample with up to an additional 32 g/l, whereas there was no significant difference between genders in preference at lower concentrations.
0 5 10 15 20 25 30 35 40 45 2g/l 4g/l 8g/l 16g/l 32g/l N u m b e r o f c o n su m e rs Added sugar (g/L) Male dotline M Female dotline F
Figure 2. Number of novices (♦) and experienced consumers (▲) who preferred the spiked sample
to the control for each glucose level. Dotted line (n=52) represents minimum agreeing judgements necessary to establish preference for novices using α=0,05 for paired comparison tests (N=85). Dotted line (n = 20) represents minimum agreeing judgements necessary to establish preference for experienced consumers using α=0,05 for paired comparison tests (N=29)
Figure 3. Number of females (▲) and males(♦) who preferred the spiked sample in preference to the
control for each glucose level. Dotted line (number of judgements=34) represents minimum agreeing judgements necessary to establish preference using α=0,05 for paired comparison tests (N=51). Dotted line (number of judgements=41), males (N=63).
20
Male on the other hand preferred the 4 and 8 g/L spiked samples, rejected concentrations at 16 g/L and strongly rejected concentrations at 32 g/L. As illustrated in the inverted U shape curve in figure 3.
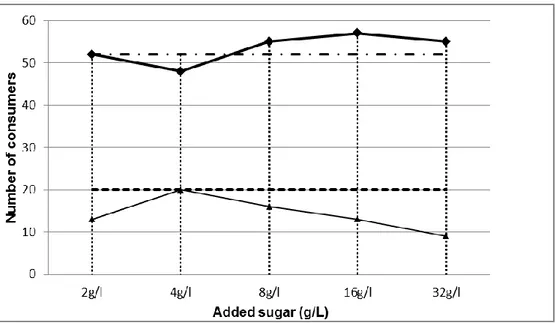
When it comes to the age factor, only class A ([18-24]) revealed significant preference for sweet concentrations. These younger subjects preferred the spiked sample with 8 g/L of sugar and the spiked sample with 32 g/L. This confirms research by Amerine and Ough (1967) where the data followed a bimodal distribution, some judges preferring drier wines and some preferring sweeter wines. The younger judges preferred sweeter wines whereas the older judges preferred dry wines.
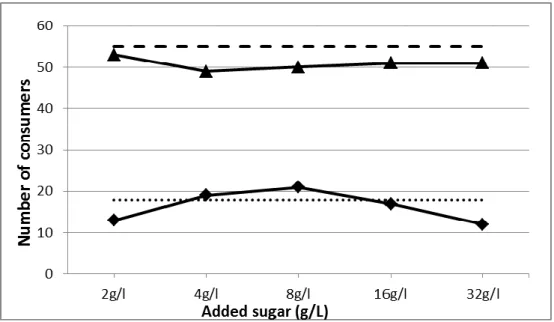
When it comes to vinotype, the Hypersensitive and the Sensitive vinotypes showed a significant difference in preference for sweet concentrations. As shown in figure 5, the hypersensitive subjects rejected concentrations at 4 g/L and at 16 g/L and preferred concentrations at 32 g/L. The sensitive subjects showed a preference for the samples at 4 g/L and 8g/L, and reject at 16 g/L and strongly reject at 32 g/L. The preference curves of these two vinotypes are almost symmetrically inverted, the sensitive having an inverted U and the hypersensitive a U shape as can be seen in figure 5.
Figure 4. Class A [18-24] (♦) and class B [25-29] (■) of ages who preferred the spiked sample in
preference to the control for each glucose level. Dotted line (number of judgements=43) represents minimum agreeing judgements necessary to establish preference using α=0,05 for paired comparison tests (N=68), dotted line (NJ=20) represents minimum agreeing judgements necessary with N=27.
21
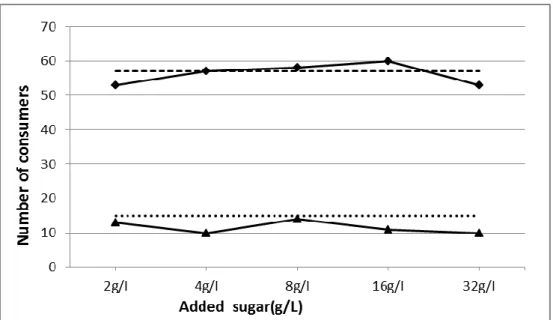
The two other vinotypes, Tolerant and Sweet did not show any significant preference at any concentration of sugar although there was a tendency in the Sweet vinotype to prefer the highest concentration of 32 g/L. However more subjects are required to confirm this tendency. The tolerant vinotype showed a tendency to prefer concentrations at 8 and 16 g/L and a clear rejection but not significant of the highest concentration of sugar. Figure 6 illustrates these findings.
Figure 5. Number of Sensitive(●) and Hypersensitive(♦) consumers who preferred the spiked sample
in preference to the control for each glucose level. Dotted line (number of judgements of Sensitive consumers =34) (Hypersensitive consumers number of judgements= 26) represents minimum agreeing judgements necessary to establish preference using α=0,05 for paired comparison tests (Sensitive vinotype N=51), (hypersensitive vinotype N=38).
Figure 6. Number of Tolerant(♦) and Sweet (▲)consumers who preferred the spiked sample in
preference to the control for each glucose level. Dotted line (number of judgements=14), dotted line (NJ=7), represents minimum agreeing judgements necessary to establish preference using α=0,05 for paired comparison tests (Tolerant vinotype N=18), (Sweet vinotype N=7).
22
When it comes to personality traits, statistical analysis revealed that with so many classes in the segmentation by personality type, there were very few respondents in some classes, which made statistical analysis impossible. Therefore a different classification had to be made in order to group the different scores for each trait. There were 4 possible scores for each trait, high A (4-5), medium M (3-4), low B (2-3) and very low MB (1-2). The scores had to be grouped in two classes, high (A) and low (B). Even the only one respondents scored for agreeableness which meant that there was no variability to study as all subjects rated themselves as agreeable. Consequently the trait agreeableness had to be withdrawn from the statistical analysis.
When it comes to extraversion, the lower scorers, class B, preferred concentrations between 4g/L and 8g/L, and rejected the lowest and the highest concentration. The curve shown in figure 7 has a slight inverted-U shape. The higher scorers, class A, did not show any significant preference for any concentration sugar level, never exceeding the dot line established for those 88 subjects.
When it comes to conscientiousness, the higher scorers, class A, preferred the spiked samples with concentrations between 4 and 16 g/L and rejected the lowest and the highest
concentration. The curve shown in figure 8 has a slight inverted-U shape. For the lower scorers, class B, no significant differences were found.
Figure 7. Number of extroverts, that scored low (Class B ♦) and high (Class A ▲) on these trait, who
preferred the spiked sample in preference to the control for each glucose level. Dotted line (number of judgements=18) represents minimum agreeing judgements necessary to establish preference using α=0,05 for paired comparison tests (N=26) and for class A (n=55) and total N=88.
23
When it comes to neuroticism, the two classes of subjects had significant preferences. Higher scorers, class A, revealed a single preference for the highest spiked sample at 32g/L. This confirms research by Kikuchi and Watanabe (2000) who found that individuals scoring high in neuroticism preferred sweet tastes. It must be noted that study was conducted with junior students from a Nutrition Department at Tokyo University who were predominantly females. In our study the sample was balanced as regards females and males and covered broad age range, which makes it difficult to make comparisons. Further investigation is necessary to draw conclusions. Lower scorers, class B, revealed a curve with an inverted U shape, showing a significant preference for 8 g/L concentration.
Figure 8. Number of conscientiousness consumers who scored low (Class B▲) and high (Class A♦)
on this trait, who preferred the spiked sample in preference to the control for each sugar level. Dotted line (number of judgements for class A=57), (dotted line class B n=15)represents minimum agreeing judgements necessary to establish preference using α=0,05 for paired comparison tests (total of class A consumers N=94, total of class B consumers N=20).
24
When it comes to agreeableness, as stated before only one class could be established on the basis of the findings, the higher scorers who only showed preference for concentration at 8 g/L and rejected concentrations at 16 and 32 g/L.
When it comes to openness, the higher scorers, class A, preferred the sample at 8 g/L concentration and a rejected concentration at 32 g/L. The curve showed in figure 11 has a slight
inverted-Figure 9. Number of consumers with high and low, class A(■) and B(♦) neuroticism trait who
preferred the spiked sample in preference to the control for each sugar level. Dotted line (Class A number of judgements=31, class B number of judgements=43) represents minimum agreeing judgements necessary to establish preference using α=0,05 for paired comparison tests (class A, N=31; class B, N=68).
Figure 10. Number of high class A(♦) agreableness trait consumers who preferred the spiked sample
in preference to the control for each sugar level. Dotted line (number of judgements=69) represents minimum agreeing judgements necessary to establish preference using α=0,05 for paired comparison tests (N=113).
25
U shape. This confirms the research of Saliba et al. (2009) on the sweet taste preference and personality traits in white wine, who found that participants with a sweet taste preference in white wine reported significantly lower levels of openness. In another study individuals scoring high for openness report healthier dietary practices inasmuch as individuals with a preference for non-sweet tastes, or dry tastes seem to be less likely to consume high-sugar products (Goldberg and Strycker, 2002). One explanation would be that infants with a preference for dry taste do not receive sufficient stimulation from their diet and therefore develop higher levels of openness as a result of having to try new experiences in order to generate the kind of stimulation that would come naturally from the diet of an infant with a sweet taste preference (Francis and Williamson, 2015). Further research is needed to test this hypothesis and confirm the link between openness, sweet preference and dietary practice.
Overall, our results showed for the first time, in red a wine, that preference for sweetness follows an inverted U-shape curve. This pattern has been widely reported in foods, across different cultures (Pfaffmann, 1980; Prescott, 1998; Prescott et al., 1992, 1997). Despite the apparently universal acceptance of sweet tastes, individual variations in response to increasing levels of sweetness have been reported (Pangborn, 1970), as shown in the consumer segments defined in our study. Moskovitz (1971) also reported that the perception of pleasantness of sugar was not constant over concentrations and in later research segmented subjects into different clusters by hedonic responses for sweetness (Moskovitz
et al., 1985). Subsequent studies have classified these hedonic responses into sweet likers and dislikers
based of broad groupings of this variation. Sweet likers generally showed monotonic increases in liking
Figure 11. Number of high class A(♦) and low class B(▲)openness trait consumers who preferred
the spiked sample in preference to the control for each sugar level. Dotted line (number of judgements=62) and dotted line (number of judgements=11) represents minimum agreeing judgements necessary to establish preference using α=0,05 for paired comparison tests (class A,N=101)(class B, N=13)

![Figure 4. Class A [18-24] (♦) and class B [25-29] (■) of ages who preferred the spiked sample in preference to the control for each glucose level](https://thumb-eu.123doks.com/thumbv2/123dok_br/15207196.1018965/34.892.168.721.395.714/figure-class-preferred-spiked-sample-preference-control-glucose.webp)