Unders
tand
ing
wha
t
impac
ts
the
Purchase
in
ten
t
ion
for
Pr
iva
te
Labe
l
brands:
Effec
ts
of
Qua
l
i
ty
,
Va
lue
,
Loya
l
ty
,
Promo
t
ions
and
Invo
lvemen
t
,
among
Por
tuguese
consumers
.
Nuno
M
igue
l
Dom
ingues
Fur
tado
Osór
io
Nunes
D
isser
ta
t
ion
wr
i
t
ten
under
the
superv
is
ion
of
Pau
lo
Rome
iro
D
isser
ta
t
ion
subm
i
t
ted
in
par
t
ia
l
fu
lf
i
lmen
t
of
requ
iremen
ts
for
the
MSc
in
Managemen
t
w
i
th
spec
ia
l
iza
t
ion
in
S
tra
teg
ic
Marke
t
ing
,
a
t
the
Un
ivers
idade
2 ABSTRACT
This thesis aims to understand what variables mostly impact the purchase intention for Private Label brands, and if such impact changes with the introduction of product involvement as a moderator effect. Specifically, the goal is to study four different categories, which differ in their involvement level, through a questionnaire based on five constructs, four of which were used in previous research, one created by the author. The information is then used to estimate linear regression models, to understand the relative impact of each of these variables on the purchase intent for private labels, of the product categories chosen.
This study aims to provide information, to both retailers and national brand manufacturers, about what variables assume a more impactful role in the purchase intension, and for them to use this information as a strategic element to improve their performance in these categories, and to possibly extrapolate some of the findings to other categories.
Results have shown that Quality (both its perceived level and its level of variability in a product category) in general remains as the most impactful variable. Besides Quality, Loyalty (to a specific private label and consequently retailer) and Promotions, also stand as significant variables. This means that retailers, essentially must improve the quality of their brands, in order place their brands closer to national brands, as a credible alternative.
3 SUMÁRIO
Esta tese tem como objetivo compreender quais as variáveis que afetam predominantemente a intenção de compra de produtos de marca própria, e se esse impacto se altera significativamente com a introdução do envolvimento com o produto, como efeito moderador. Especificamente, o objetivo é estudar quatro categorias diferentes, que diferem no seu nível de envolvimento, através de um questionário baseado em cinco constructos, quatro dos quais foram utilizados em pesquisas anteriores, um criado pelo autor. A informação obtida é então usada para estimar modelos de regressão linear, para entender o impacto relativo de cada uma dessas variáveis na intenção de compra de produtos de marca própria.
Este estudo pretende fornecer informação, tanto para os retalhistas como para os fabricantes de marcas nacionais, sobre quais as variáveis que assumem um papel mais impactante na intenção de compra por produtos de marca própria, de modo a que eles usem estas informações como um elemento estratégico para melhorar seu desempenho nas categorias analisadas nesta tese, e possivelmente extrapolar algumas das conclusões para outras categorias.
Os resultados mostraram que a Qualidade (o seu nível percebido e o seu nível de variabilidade numa categoria de produto) permanece, em geral, como a variável mais impactante. Além de Qualidade, Lealdade (para uma marca própria particular e, consequentemente, um retalhista) e Promoções, também se destacam como variáveis significativas. Isto significa que os retalhistas, essencialmente devem melhorar a qualidade das suas marcas, de modo a aproximá-las das marcas nacionais, constituindo assim uma alternativa credível.
4 ACKNOWLEDGEMENTS
This thesis constitutes the last step in completing my master degree, an enriching and unforgettable journey ends with the completion of this thesis. Thorough out this road a lot of people contributed to its outcome, without them, reaching this stage would not have been possible. First of all I would like to thank my family: My father, my mother, my sister, all my uncles, aunts and cousins, whose support was fundamental for me to accomplish what I have accomplished so far.
Secondly, I would like to thank my thesis supervisor Paulo Romeiro, without his supervision and guidance this thesis would have not been written. Additionally, I would to thank all my professors that have crossed my academic path, with a special mention to Professor Rita Coelho do Vale and Professor Isabel Moreira, whose valuable input helped me along the way of writing this thesis, and was key for its completion.
Finally, I would like to acknowledge the contribution of my colleagues, some of whom I have shared the endeavor of writing this thesis. The concerns, the doubts, the advices, the motivation we have shared made this last step an enriching and unforgettable one in my life. To Mónica, Duarte, Manel, Miguel, Francisco, Raquel, Joana, Diana, Beatriz, Mariana, Fernando, Carlos, José, André, Pedro, Vasco, Alex and all my other friends, as well as my master and dissertation seminar colleagues (too many to name them all), thank you for your presence in this step of my academic career and my life, you are part of an unforgettable part of it.
5 TABLE OF CONTENTS CHAPTER 1: INTRODUCTION ... 9 1.1. Background ... 9 1.2. Problem Statement ... 10 1.3. Research methods ... 10 1.4. Relevance ... 11 1.5. Dissertation outline... 12
CHAPTER 2: LITERATURE REVIEW AND CONCEPTUAL FRAMEWORK ... 13
2.1. Private Labels and retail industry. ... 13
2.2. Purchase intention ... 14
2.3. Conceptual framework and Hypothesis development ... 15
2.3.1. Perceived Quality ... 15
2.3.2. Value consciousness ... 16
2.3.3. Perceived Risk: Risk as Quality Variability in the Category ... 16
2.3.4. Loyalty and Promotions Schemes ... 19
2.3.5. The Moderator: Level of Involvement with the Product ... 19
CHAPTER 3: METHODOLOGY ... 22
CHAPTER 4: RESULTS AND DISCUSSION ... 27
4.1. Preliminary Analysis ... 27 4.1.1. Sample Characterization ... 27 4.1.2 Data Reliability ... 28 4.1.3 Descriptive Statistics ... 29 4.2. In-depth Analysis ... 31 4.2.1. Laundry Detergents ... 31 4.2.2. Instant Coffee ... 34 4.2.3. Breakfast Cereal ... 36
4.3. Independent Samples T-test ... 38
CHAPTER 5: CONCLUSIONS AND LIMITATIONS ... 40
5.1. Conclusions ... 40
5.2. Discussion and Recommendations ... 42
5.2.1. Limitations... 43
5.2.2. Further Research ... 44
REFERENCES ... 45
7 TABLE OF ANNEXES
Appendix Table 1: Questionnaire Constructs in detail
Appendix Table 2: Laundry Detergents Exploratory Factor Analysis SPSS Output
Appendix Table 3: Laundry Detergents Linear Regression (without effect of product involvement) SPSS output
Appendix Table 4: Laundry Detergents Linear Regression (with the effect of product involvement) SPSS output
Appendix Table 5: Instant Coffee Exploratory Factor Analysis SPSS output
Appendix Table 6: Instant Coffee Linear Regression (without effect of product involvement) SPSS output
Appendix Table 7: Instant Coffee Linear Regression (with the effect of product involvement) SPSS output
Appendix Table 8: Breakfast Cereal Exploratory Factor Analysis SPSS output
Appendix Table 9: Breakfast Cereal Linear Regression (without effect of product involvement) SPSS output
Appendix Table 10: Breakfast Cereal Linear Regression (with the effect of product involvement) SPSS output
8 GLOSSARY
Private Label- PL National Brand- NB
9
CHAPTER 1: INTRODUCTION
1.1. Background
Globalization, along with technology development has impacted the world in a massive way, altering society’s way of living, directly impacting consumption patterns, changing preferences and the way we as consumers make decisions. With time, consumers’ level of involvement with different product categories has changed dramatically, where once a certain National Brand (NB) played a major role as a leader and an anchor for purchase decision, nowadays consumers buy and relate to products in a different way. This change in the level of involvement and preferences has resulted in consumers disregarding certain product categories, allocating their expenditure differently, prioritizing different products and searching for cheaper alternatives across certain product categories.
This new paradigm meant a new challenge for retailers, which saw their business model change significantly in recent years. The main consequences of this new paradigm were consumers with increasingly complex preferences, and a higher focus from retailers into differentiation and price competition, that in turn led to a more competitive environment.
One of the instruments used by retailers in this new paradigm were Store Brands, also known as Private Labels (PL). These can be defined as a retailer owned brands which can be present across different categories, competing directly with NB’s. The introduction of this type of brands has impacted the retail environment in a major way, mainly the competition between suppliers of NB’s which saw the entrance of a new player in their categories, offering a cheaper alternative to their products, but also the relation between suppliers/manufacturers and retailers has entered into a new dynamic.
This new type of brand started out as a low-piece alternative to NB’s, being in a limited amount of product categories, with time, they changed, and today they are no longer positioned as a low-price alternative, in fact, they became (in some cases) viewed by consumers as a good quality alternative to NB’s, changing their positioning to a status-orientation one, extracting benefits from the retailers’ image (J. E. M. Steenkamp, Heerde, & Geyskens, 2010). This allowed PL’s to grow, their market share and penetration level across different European countries: 45% for consumer packaged goods in Switzerland, 41% in the UK, 41% in Spain and 33% in Portugal according to Nielsen,(2014)
Today, PL’s are present in almost every product category, which means that consumers are constantly choosing between a PL and a NB in most of their purchase decisions. Therefore it
10 becomes relevant to understand what specific drivers of purchase influence consumers’ purchase intention. It is also relevant to make this analysis across different product categories, because as it was mentioned before, our preferences and the way we relate to products changes according to the category, which influences how much we are willing to pay for a certain product.´
It is the purpose of this research to understand which variables influence consumers’ decision the most, when faced with a situation where they have a category where there are National Brands and one or more Private Labels present.
1.2. Problem Statement
The scope of this research is to understand how and what are the main drivers (variables) of purchase intent, that is, what affects/moderates consumers’ decision to buy Private label brands instead of National Brands. Understanding how these drivers might change according to different product categories, and to a specific moderating effect. Essentially, the problem statement for this research could be summarized as:
Understanding what impacts the Purchase intention for Private Label brands: Effects of Quality, Value, Loyalty, Promotion and Involvement, among Portuguese consumers.
This problem statement it substantiates itself in the following research questions:
RQ1: What are the main purchase drivers for consumers purchase decision? What are the relative weights of each driver in the consumer purchase intention of private labels?
RQ2: Do the relative weight of purchase drivers vary across product category?
RQ3: Does level of involvement influence the relative weight of the purchase drivers for PL across different categories?
1.3. Research methods
With the purpose of researching the problem previously stated, and also to answer the research questions in which the problem consubstantiates itself into, a two stage approach. In a first stage, a detailed literature review mainly based on previous research, although with some contribution of a few market studies, to assert the academic validity of the concepts being
11 studied, and consequently their righteousness in being chosen for this kind of study. This first stage will answer to the first part of the first research question, with the rest of the research questions being answered through the second stage described below.
In a second stage, a questionnaire based on its majority on previously used constructs, will be used to test the hypothesis formulated throughout the literature review. With the results obtained through this primary data will be used for specific statistical procedures to determine the acceptance, or rejection, of the hypothesis formulated in this dissertation.
The questionnaire will be answered exclusively by Portuguese consumers, given that the understanding central to the study are the Portuguese consumers. In the questionnaire some screening questions will be inserted to guarantee that the respondents are frequent shoppers, and that they have purchased at least once, one private label brand in one of the product categories chosen for the study.
The statistical procedures utilized to analyze the primary data obtained will be: Factor Analysis and Multiple Linear regressions. These two procedures are chosen because previous research that analyzed similar subjects used these methodology, and obtained statistically, and overall, relevant results.
1.4. Relevance
This research has both academic and managerial relevance. In academic terms, it aims to be a contribution to the fields of consumer behavior, retail and brand management.
The first field benefits by the fact that this research aims to understand what drives consumers’ purchase intent, that is, what are the most influential dimensions for a consumer when making a purchase decision. The second benefits from the conclusions it hopes to achieve, which could infer what product dimensions, to some extent controllable by retailers, may influence consumers’ purchase decisions. Lastly, it contributes to the field of brand management, by providing insights to what affects consumers’ decision to purchase a Private label brand, in detriment of a National brand. In general, this research hopes to achieve insights that could make for new research topics that would further develop those areas, expanding the overall understanding of such topics and contributing for the growth of Marketing as an academic research area.
The managerial relevance of this research lies in the fact that knowing what drives consumers to purchase Private Label brands will help both retailers and National Brand manufacturers.
12 Retailers benefit from it because it allows them to improve their Segmentation, Targeting and Positioning (STP) strategies, since they know what drives consumer purchase intent, they can improve specific product features, which in turn will render their approach towards the consumers more effective.
National Brand manufacturers benefit, because knowing what drives consumers’ purchase intent may inform them of what are the most important, hence most valued, dimensions for a customer when making a purchase decision. Knowing this information, National Brand manufacturers can also improve their STP strategies, adopting new strategic actions, impacting the variables that concern the product itself in the category (specifically Perceived Quality and Quality Variability in the category) that could alter the competitive landscape between Private Labels and National Brands.
Having worked previously in a company that dealt with these phenomenon, and due to my particular passion for the academic topics previously mentioned, I wanted to make this research in order to allow me to understand what influences consumers in their purchase decisions when deciding in product categories that contain one or more Private Labels as options of purchase.
1.5. Dissertation outline
The next chapter presents a literature review and the development of the hypothesis that will guide the study. The literature review will explain and describe how relevant and impactful each of the variables are for the purchase intent for Private Labels. The third chapter presents the methodology through which the study will answer to the hypothesis. The constructs that constitute the questionnaire and the procedure, on how each statistical test will be applied to the data obtained, will be detailed in this chapter. The fourth chapter will make an analysis (both general and in-depth) to the results obtained thorough the questionnaire, and based on these results, there will be some considerations as to the effective meaning of such results. The final chapter addresses the conclusions of this dissertation, as well as its limitations and the indications for further research in this area of study.
13
CHAPTER 2: LITERATURE REVIEW AND CONCEPTUAL
FRAMEWORK
2.1. Private Labels and retail industry.
The retail industry has gone through significant changes in recent years (Ailawadi & Keller, 2004; Steenkamp & Geyskens, 2014), these changes have implied new models, a more competitive environment, between players, which has made retailers adopt new strategies, in order to sustain their position in the market (Coelho do Vale and Verga Matos, 2015).
One of the main changes was the creation/introduction of Private Labels (PL), which can be defined as brands owned and distributed by a single retailer. Initially, they represented a lower-price and lower-quality alternative to National Brands (NB) (Goldsmith, Flynn, Goldsmith, & Stacey, 2010). During the 1980s, private labels improved in terms of quality, matching the national brands offering, but at a lower price (International Markets Bureau, 2010). In the 1990s and 2000s, private labels started to differentiate and further sophisticate their offering, and started being present in a wide range of product categories, from fast-moving consumer goods to clothing, home-care products and others (Liljander, Polsa, & van Riel, (2009); Rossi, Borges, & Bakpayev, (2015)).
Nowadays, private labels are not merely generic alternatives to national brands, they cover different categories and target different segments (Hoch, 1996). From this initial focus on low-price, PL have changed their positioning, moving towards a quality positioning, and more recently to a status-oriented one, capitalizing on the retailers’ image (J. E. M. Steenkamp et al., 2010). This change in their positioning is intrinsically connected to the way consumers perceive this type of brands, nine out of ten American consumers consider private labels to be as good as national brands (Deloitte, 2014). Private label development varies dramatically across the world (Nielsen N.V., 2014), reaching a global average dollar share of 16,5%, with Europe standing as the continent where private label the highest dollar share (Switzerland 45%, Spain and UK 41%, Germany 34%, Portugal 33%).
Since private labels now have a similar quality to that of national brands (Sethuraman and Gielens, 2014), and that retailers position their private labels at different quality levels, directly competing with national brands, it becomes relevant to understand how consumers act when faced with this type of offer, namely, how this situation affects their purchase intent, and what factors/ drivers mediate their decision.
14
2.2. Purchase intention
Consumers’ decision-making process is a complex one, it varies from consumer to consumer, because the different variables that compose a purchase decision are intrinsically linked with our own preferences and tastes as a consumer. Many drivers influence our purchase decision, and they vary across product category because we prioritize products according to our own preferences, therefore it is interesting to analyze how our purchase drivers change, not necessarily their composition, they may be the same, but the relative weight we attribute to each of them when considering different products.
Purchase intention is defined as the possibility that consumers will plan to, or be willing to purchase a certain product or service in the future (Wu, Yeh and Hsiao, 2011). It is considered a relevant measurement, both academically and managerially, since it seen as step that precedes a concrete buying behavior(de Magistris and Gracia, 2008).
Understanding what influences purchase intention is key for both retailers and manufacturers, since it is an indication of future behavior (Grewal et al., 1998), which could have strategic implications for both of them, because knowing it allows them to analyze future trends, which in turn leads to a better planning of their future strategic actions, specifically segmentation decisions, which directly related to consumer characteristics, that in turn influence targeting and positioning decisions.
In order to understand what drives purchase intention for private labels, it is important to realize that buying decisions are influenced by various needs, including physiological and/or socio-psychological ones that shape the customer attitudes towards private label products. (Kakkos et al., 2015).
After a careful research of different articles, I decided to select the following as the drivers that influence the purchase decision for private label brands. Such research included both studies that had a similar purpose to the one of this thesis, namely Kakkos et al.,(2015) and Vipul and Kishor (2016), and other articles that studied factors related to the interaction between consumers and private labels, like Batra and Sinha (2000), plus all the others that are referenced and quoted in the following paragraphs, as well as my own view of the retail market/environment in Portugal, compose the theoretical background that sustain the choice of such drivers for the purpose of this research.
15
2.3. Conceptual framework and Hypothesis development
2.3.1. Perceived Quality
The perceived quality of a product is one of the key criteria for the evaluation of it. Previous research states that quality endorses all the product attributes and features that are responsible for satisfying users’ needs (Méndez, Oubiña, & Rubio, 2008). Quality has such a strong effect on the consumers, that it influences their buying decisions and behavior, and consequently, their purchase intentions (Cronin, Brady, & Hult, 2000). If a product meets or exceeds the quality expectations that a consumer has, it will strongly motivate repurchase behavior and inhibit switching behavior(Deng, Lu, Wei, & Zhang, 2010), therefore, perceived quality assumes a key role as a variable influencing purchase intention.
When private label brands were created, they were seen as a lower price and lower quality alternative to national brands (as referenced previously), in fact, previous research highlights that consumers who are reluctant to buy private labels are more inclined to believe that they offer lower quality compared to national brands. (Baltas & Argouslidis, 2007). Perceived quality plays an important role in the decision between a private label and a national brand, according to Batra & Sinha (2000), perceived quality variation indirectly impact on private label purchase. Previous research also points out that a perceived quality difference is an important reason for consumers to pay more for a national brand (Sethuraman & Cole, 1999).
However, and as mentioned before, the perceived quality of private label brands has changed, in fact, according to the consumers’ perception, quality is the dimension that has had the biggest improvement, since the creation of private labels. Today, consumers see them as direct competitors with national brands, due to their similar quality levels. As previous research highlighted the fact that a difference in perceived quality had an effect in the purchase of private label, it is pertinent to hypothesize that if such a difference in perceived quality has diminished, consumers that have a good quality perception of private label will be inclined to purchase it in detriment of a national brand, hence:
Hypothesis 1: Perceived quality has a positive impact on the purchase intention for private labels.
16 2.3.2. Value consciousness
Value consciousness, is academically defined as the concern consumers have for the price paid, relatively to the quality received in a purchase transaction (Burton et al.,1998; Lichtenstein et al., 1993)
Consumers do not judge or evaluate the quality of a certain product, as an isolated attribute, that evaluation is made in relation to another variable, an objective one, in this case price, therefore, a lower priced product that has desirable features, may be viewed as an offer of greater value for money, than another brand sold at the same price but comprised of less appealing attributes (Richardson et al., 1996).
This consideration of the relation between price and quality renders consumers as value conscious (Burton et al., 1998). The balance of this ratio is key for the attitudes towards private labels, we know that value conscious consumers seek low prices for a given product quality (Burton et al., 1998), and for a given price level, higher quality leads to higher value (Bao, et al., 2011). Therefore, we can conclude, as it has been shown by existing research, namely Hoch and Banerji, (1993), that quality is a determinant factor of private labels market share, whereas price does not have an effect.
Consumers do not purchase private labels because they are cheap, the value they obtain with their purchase is a key factor for their decision, and as it was mentioned before in this thesis, the perception of private label quality has changed, it is closer to the national brands’ quality level, hence, private label became an offer with a good value proposition, they still offer a lower price than national brands, but with perceived similar levels of quality. This kind of offer it is more appealing to value conscious customers, and as stated by Bao et al.(2011), for private labels, the effect of perceived quality is expected to be stronger on value conscious consumers, than those who are not, based on this it is hypothesized that:
Hypothesis 2: Value consciousness has a positive impact in the purchase intention for private labels.
2.3.3. Perceived Risk: Risk as Quality Variability in the Category
When a consumer makes a purchase decision, he or she cannot be sure if it will be the right choice or not, a consumer always faces a certain degree of uncertainty when making a purchase decision, thus, perceived risk becomes a key factor in private label purchases, as evidenced by
17 previous research (Bettman, 1974; Richardson et al., 1996). This has a significant impact for private labels, because as argued by Narasimhan and Wilcox (1998), consumers will prefer national brands if the level of perceived risk in buying private label brands in a certain category seems high.
When the level of perceived risk is high, consumers will prefer brands of enhanced image in order to reduce it (Wu et al., 2011), and to some of them, those brands are still national brands, because they perceive them as bearing a smaller risk in comparison with private label brands (Liljander et al., 2009).
As showcased by Mieres, Martín and Gutiérrez (2006), the first studies that researched the influence of brand in perceived risk by comparing a generic alternative to a national brand (which were conducted in the late 1970’s and beginning of the 1980’s), all conclude that consumers perceive more risk in generic alternatives than in national brands. Later research that either incorporated a private label brand in the aforementioned comparison (Dunn, Murphy, & Skelly, 1986), or that made the comparison directly between private labels and national brands (Dick, Jain, & Richardson, 1995; Richardson et al., 1996), although recognizing that the gap in perceived risk is smaller between private labels and national brands (compared to generic alternatives and national brands), they still maintained the same conclusion, that consumers perceived risk towards private label brands is higher than towards national brands.
In order to maintain a consistent analysis of perceived risk as a factor that influences purchase intention, it is key to bear in mind that this is a concept of a multidimensional nature (Mieres et al., 2006). According to Jacoby and Kaplan (1972), there are five underlying dimensions associated to the perceived risk to a purchase: Functional (associated to the performance of the product), financial (related with the potential monetary loss), social (relative to the perception of other individuals about the consumer), physical (relative to the health or physical well-being), psychological risk (associated to the individuals self-esteem).
For the purpose of this study, I decided to focus mainly on the functional dimension associated to perceived risk. I chose this because in terms of financial risk, it has been evidenced previously that consumers don’t buy private labels because of the price, therefore financial risk does not seem to be a factor. Regarding the social, physical and psychological risk, given that in the Portuguese market, the penetration figures to be among the highest in Europe, and the fact that every major retailer in the country offers them in a wide range of product categories, it seems irrelevant to focus the research on these dimensions because they don’t seem to affect the
18 Portuguese consumer, given the proliferation and the performance of private labels in this specific market.
Risk as quality variability within the product category
Previous research highlights that one of the exact determinants of the level of perceived risk is the “degree of inconvenience of making a mistake” (Dunn et al., 1986). The severity of a mistake depends on the product category where it is made, in other words, to make a mistake in a category like baby food is much more severe than in toiletries or groceries (Batra & Sinha, 2000). Besides the category where the mistake is made, there is another key factor concerning the consequences of such mistake, which is the likelihood of it being made.
According to Dunn, Murphy and Skelly (1986), the expected value of any decision is the product of its consequences times its likelihood. This highlights the role that the perceived degree of quality variability in a category, further explained by Batra and Sinha (2000) , this concept is different from the perceived quality of private label brands (detailed previously in this chapter), it concerns the variability between product alternatives within a category, which according with the last aforementioned authors, such variability should create greater uncertainty and doubt, thus increasing the perceived risk.
This notion is also supported by Narasimhan and Wilcox (1998), who argue that the degree of perceived risk increases with the degree of perceived quality variation across brands in a specific category. Previous research also points out that the share of private label brands is lower in categories where the quality variability of store brands was high (Hoch & Banerji, 1993).
This last concept shows that perceived quality is closely related with perceived risk, consumers are not willing to buy private labels if they perceive the quality variation to be too high between private labels and national brands, previous research by Richardson, Jain and Dick (1996) found, through an analysis of aggregate across-category data, that perceived quality variation led to a decrease in the perceived value-for-money of private label brands, which eventually lead to a reduced private label proneness.
Therefore, the lower the quality variability in the category, the higher the purchase intent would be, thus it hypothesized the following:
Hypothesis 3: Risk as Quality Variability in the Category will have a positive impact on the purchase intention for private labels.
19 2.3.4. Loyalty and Promotions Schemes
Retailers use private labels as a mean of differentiation in the consumers’ market, currently offering them in a wide range of categories and with a quality level increasingly closer to their competitors in these categories.
Given the nature of private labels, they are retailer-specific, and can’t be purchased elsewhere (Ailawadi et al., 2008), this fact will likely affect loyalty towards the retailer in which the purchase is made (Martos-Partal and González-Benito, 2009). Loyalty is defined as a pattern of repeated behavior of a specific brand that can lead to a relationship with it (Blut et al., 2007), however, store loyalty remains as a concept that academically has no universally agreed definition (Blut et al., 2007), but the drivers related to them have been deeply studied and used in previous research.
According to Coelho do Vale, Verga Matos and Caiado (2016) study, there are ten commonly used store loyalty driving factors, six of an in-store nature, four of an economic one. For the purpose of this research, I am focusing on one of the economic factors quoted, specifically loyalty schemes. I focus on this specific fact because it is often referred as a potentially critical store loyalty driving-factor (Bridson et al. 2008; Demoulin and Zidda, 2008; Dorotic et al.,2012), they accelerate consumers’ loyalty life cycle (Liu, 2007), encouraging enduring repeat purchase (Coelho do Vale et al., 2016).
It is therefore relevant to analyze if the loyalty card schemes used by retailers have any influence on consumers purchase intention of private label, for two main reasons: Firstly, according to Marktest (2015), two out of three Portuguese consumers have a loyalty card, and secondly, because two major retailers in Portugal (Pingo Doce and Jumbo) already use them as a tool to offer specific discounts for private label purchase, thus it is hypothesized that:
Hypothesis 4: Loyalty schemes and discounts have a positive effect in the purchase intention of private labels.
2.3.5. The Moderator: Level of Involvement with the Product
For the purpose of this research, and acting a moderating variable, I decided to include Level of involvement with the Product. This moderator variable, alongside with the number of brands present in the category, served as the criteria through which the product categories used in the
20 questionnaire were chosen. The Level of involvement with the Product will consubstantiate into a hypothesis, which will be presented in the following paragraph.
Involvement is a concept that has been consistently studied in the field of consumer behavior, normally as a moderating or explanatory variable (Dholakia, 1997), however, it has been difficult to find an universally accepted academic definition of such concept, some authors, namely Zaichkowsky (1985), highlight the fact that the literature suggests different applications of the term, people might be involved with advertisements (Krugman, 1965, 1967, 1977), with products (Howard and Sheth, 1970; Hupfer and Gardner, 1971) or with purchase decisions (Clarke and Belk, 1979).
For the purpose of this research, I am focusing on product involvement, since it has been hypothesized to lead to greater perception of attribute differences, perception of greater product importance, and greater commitment to brand choice (Howard and Sheth, 1970), which seems relevant, given that the purpose of this research is to measure the purchase intent for private labels across different product categories.
Academically, product involvement is defined as a concept directly related to a consumer’s inherent needs, values, and interests, thus reflecting a personal phenomenon that expresses the consumer’s beliefs and feelings about an object in a specific situation (Zaichkowsky, 1985). It is important to clarify, as (VonRiesen and Herndon, 2011) stated, the concept does not apply to the object itself but to the way in which the person responds to the object, this definition portrays an idea that has been adopted multiple times in previous research (Greenwald and Leavitt, 1984; Krugman, 1967; Mitchell, 1979; Rothschild, 1984), which is that involvement focuses on personal relevance.
Through this definition, involvement is a measurable concept, in other words, a consumer relates at different levels with different products, therefore, it is possible to make a distinction between high and low involvement. Based on the definition of involvement previously presented by Zaichkowsky (1985), it is inferable that the level of involvement is determined by how much a product relates to the consumers’ inherent needs, values, and interests, thus influencing the personal expression of such beliefs and feelings about it.
Different levels of involvement have repercussions in several aspects, one of them is the perception of brand differences, as proposed by Zaichkowsky (1985), consumers with high involvement would perceive greater differences among brands in the product class than low
21 involvement scorers. Such proposition is based on the research of Robertson (1976), who suggests that high involvement implies that beliefs about product attributes are strongly held, whereas low involvement individuals do not hold strong beliefs about product attributes. Thus, the strength of the belief system to the attributes emphasizes the perception of differences among brands on the attributes where beliefs are strongly held (Zaichkowsky, 1985).
By having a better perception of differences among brands, consumers highly involved with a product category are expected to have a preferred brand in such category because, as it was previously established, a highly involved consumer is able to perceive greater differences regarding product attributes, hence, a specific preference is expected, based on that differentiation (Zaichkowsky, 1985).
Bearing in mind the implications that a high level of involvement has on the consumers, and the fact that national brand manufacturers have bigger resources to spend in communication, assuring that their brands convey a consistent message about their values, attributes and what they represent, they achieve an effective positioning, which according to Kotler and Keller (2012), is helpful to guide marketing strategy by clarifying the brand’s essence, what goals it helps the consumer achieve, and how it does so in a unique way. Previous research highlights the role of positioning as a source of competitive advantage (Cronshaw et al., 1990), the fact that consumers seem, in general, to be more familiar with national brands than private label brands (Garretson et al., 2002) and that the brand that is easier to recall, is the one more likely to be bought (Radder & Huang, 2008), it is thus hypothesized that:
22
CHAPTER 3: METHODOLOGY
In the previous chapter, after a detailed literature review, several hypothesis were made, the following section showcases how they will be tested, specifically through which technique the data will be collected and also which statistical test will be employed to test all the hypothesis.
For a more convenient reading, the hypothesis enunciated previously and their impact on the purchase intention for private labels are summarized in the following table.
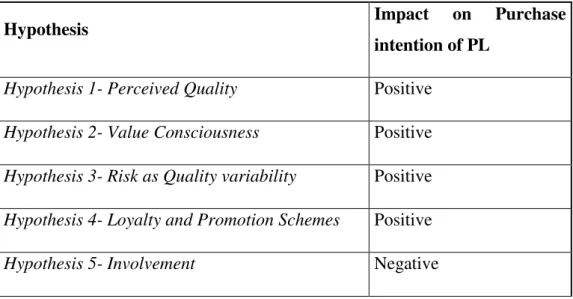
Table 1: Summary of the hypothesis and their impact on the dependent variable
Hypothesis Impact on Purchase
intention of PL
Hypothesis 1- Perceived Quality Positive
Hypothesis 2- Value Consciousness Positive
Hypothesis 3- Risk as Quality variability Positive
Hypothesis 4- Loyalty and Promotion Schemes Positive
Hypothesis 5- Involvement Negative
In order to test these hypotheses, I designed a questionnaire that was distributed exclusively to Portuguese consumers, through both email and social media outlets.
Most of the constructs used to design the questionnaire were taken from previous literature, which strengthens their academic foundation and justify their choice. The only exception concerns the items that are supposed to evaluate the independent variable of Promotions and Store Loyalty programs, whose three items, contain two developed by me, that concern a specific situation on the Portuguese retail market, mentioned previously in the literature review.
23 Table 2: Questionnaire Constructs
Measures Items / Questions References
Dependent variable Customer’s
purchase intention
1 From Dodds, Monroe, and Grewal (1991)
Independent variables
Perceived quality 5 4 Items from Aaker & Keller, (1990) and Grewal, Krishnan, Baker & Borin(1998).
1 Item from Do Vale, Verga Matos & Caiado (2016).
Promotions and store loyalty programs
3 3 Items from own development
Value
Consciousness
7 Extracted From Bao, Bao, and Sheng, (2011), originally from Burton, Lichtenstein, Netemeyer, and Garretson, (1998) and Lichtenstein, Ridgway, and Netemeyer, (1993)
Risk as quality variability in the category
4 From Batra and Sinha (2000)
Moderator
Involvement 4 From Zaichkowsky (1985)
All these constructs were measured through a seven-point Likert scale, including the ones developed by me, to maintain the consistency across the study, since all the other constructs used the same scale when they were originally published.
24 The questionnaire aimed to analyze four categories. These four categories were selected based on the moderators chosen for this study: Involvement and the number of brands present on each category.
Out of the four categories, two were considered to be of high involvement levels, and two of low involvement levels, as determined by Zaichkowsky (1985). The criteria of the number of brands in the category was applied through a quick search on the biggest retailers in the Portuguese market, and defining five as the borderline number of main brands in the category, that could be found in all these retailers.
Table 3: Product Categories chosen for the study
Involvement Level
High Low
Number of brands in the category
High Laundry Detergents Breakfast cereal
Low Fruit Juices Instant Coffee.
Applying the aforementioned criteria, the product categories chosen are summarized in the above table. According to my research, laundry detergents has more than nine brands in the Portuguese market, and breakfast cereal has more than six brands, and in some cases one brand has many sub-brands, contributing for the width of the category. Fruit juices accounted for four brands, and instant coffee for three brands in the Portuguese market.
The questionnaire has the following structure: One block of screening questions, a second block of the same involvement questions, applied to the four categories in question. The third block where the constructs of both the dependent variable and the independent variables were asked to the respondents, specifically to two of the four categories in question. Respondents were then randomly assigned to a pair of categories, always containing a high and a low involvement category. Finally, a set of demographic questions. (All the items /questions can be consulted in detail in the appendix Table 1).
In total 319 people opened the survey, out of this group, a total of 243 valid answers were registered, which results in a response rate of 76,18%. Of the valid answers, 42 respondents were excluded, because they did not pass the screening questions of the questionnaire, leaving
25 a final sample of 201 respondents, which results in a response rate of 63%. The exclusion of the 42 respondents is because they stated that they had never bought a private label in (at least) one of the four categories in question, hence, I considered that their insight is not relevant for the study.
In order to analyze the findings statistically, I resorted to an exploratory factor analysis and subsequently, with the factors obtained, a linear regression with those same factors.
The factors were obtained through the Principal Components method, through Varimax rotation, and extracted based on Eigenvalues larger than 1. According to Field,(2005), communalities after the extraction should be higher than 0,5, therefore all the communalities present in the SPSS output, that had values below 0,5 were excluded from the analysis. After this procedure, the factor analysis was repeated, saving the resulting factors, in order to use them in a linear regression. The linear regression was made, to understand, how each factor affected the purchase intention of private labels, and their relative weight in the model.
In a second stage, I tested the moderating effect of the level of involvement, by establishing one dummy variable for each product category, one where “1” represented high involvement, and “0” represented low involvement. I decided to this in order to understand how each regression model changed with the level of involvement of the respondents in that specific product category. As it is shown in the results section of this study there were variations that are worth analyzing. The criteria to establish the cut-off value to determine what was considered high and low involvement, was based on the mean of the answers to the four questions of the involvement construct by all 201 respondents. After establishing this value for each product category, respondents had their involvement score (that is their mean of the answers to the questions of the involvement construct) converted into a “1” and a “0”.
Once this involvement score variable was created, I computed a new variable, to measure the interaction between the involvement level, and each of the factors produced by the exploratory factor analysis. These new variables were subsequently used as independent variables in a second linear regression, along with the involvement level of each respondent, and the factors previously extracted, to assess the moderating effect of the involvement level in the model.
Through these two statistical procedures, the acceptance or rejection of all the hypothesis with the exception of the last one which relates to the involvement, will be answered.
26 The acceptance (or rejection) of the last hypothesis will be evaluated through an Independent Samples T-test, which will compare the mean score, of high and low involvement respondents of each category, of the question that measures the purchase intention. The distinction of high and low involvement was made through the same dummy variable previously explained. The grouping variable of the test was a cut point that was equivalent to the mean score of all the respondents to the question that measured the purchase intent.
27
CHAPTER 4: RESULTS AND DISCUSSION
This section of the thesis will be divided in two parts: Preliminary and In-depth analysis. The first part contains a sample characterization, mainly based in the demographic questions present in the questionnaire. Moreover, this part also contains a section about the reliability of the data obtained, where the Cronbach Alphas for the questionnaire are demonstrated, and quickly analyzed. This first part finishes with a section on the descriptive statistics of both the moderator and independent variables questions.
The second part, contains a detailed analysis, of the statistical procedures used to determine if the first four hypothesis previously enunciated are accepted or rejected. Specifically, this section will detail, per product category both the Exploratory Factor Analysis and the Linear Regression models estimated for each product category. The in-depth analysis finishes with a T-test for independent samples to either accept or reject the fifth hypothesis, regarding involvement.
4.1. Preliminary Analysis
4.1.1. Sample Characterization
As mentioned before in the methodology section, I obtained 201 valid answers, out of a total of 243 responses, that is, 201 respondents that have for sure bought a private label product in at least one of the four categories analyzed by this study.
The majority of respondents are women (57,7%), between the ages of 36 and 65 (50,8%), and 18- and 25 (34,8%), with a monthly income level of less than 1499€ (56,7%). Most of the respondents also state that they are frequent shoppers, with 73,2% declaring that they go shopping at least four times a month, that is, at least once a week. Moreover, the majority of respondents chooses Pingo Doce and Continente as their preferred retailers (80,1%), with Pingo Doce having a slight edge in the preference of the respondents (43,8% against 36,3% respectively).
In terms of which of the three product categories being tested the respondents had previously purchased, we can see that Breakfast cereal has been chosen by 64,2% of the respondents, while Laundry detergents was chosen by 44,8%, fruit juices by 64,2% and instant coffee was chosen
28 by 35,8%,and as mentioned before, 17,3% of the people that completed the survey, stated that they had never purchased a private label in the product categories being analyzed by this study.
4.1.2 Data Reliability
To understand how reliable each scale used to measure each construct used in the questionnaire, it is used as a measure the Cronbach Alpha, which specifically assesses the internal validity and consistency of each scale used for each questionnaire construct.
In the following table the values for the Cronbach Alpha, for each construct, are presented per product category, because respondents only answered to specific pair of categories, thus making it impossible for SPSS to calculate a unique Cronbach Alpha for each of the five constructs. The only one that is presented transversally for all product categories is the value for the involvement construct, which all respondents answered to every item of it.
Table 4: Reliability Statistics (Cronbach Alpha)
Questionnaire Constructs Number
of Items Laundry Detergent Instant Coffee Breakfast Cereal Fruit Juices Perceived Quality 5 0,851 0,92 0,923 0,862
Loyalty and PromotionSchemes 3 0,675 0,751 0,641 0,318
Value Consciouness 7 0,792 0,882 0,907 0,789
Risk Quality Variability 4 0,854 0,886 0,92 0,803
Involvement 16 0,82
According to George, D., and Mallery, P., (2003), the values for the Cronbach Alpha that are below 0,5 are unacceptable, between 0,5 and 0,6 they are poor, between 0,6 and 0,7 are questionable, between 0,7 and 0,8 they are acceptable, between 0,8 and 0,9 they are good, and above 0,9 they are excellent.
In a general way, with exception for the Loyalty and Promotion Schemes construct, the values obtained are good and can attest to a good reliability of the scales used in this questionnaire. Such a result was expected, given that most of these scales had been used in previous studies,
29 with good values for internal consistency, for instance, the construct used for Value Consciousness, originally by Batra and Sinha, (2000), had presented a Cronbach Alpha of 0,88.
The Loyalty and Promotion Schemes construct presents the lowest values from all the constructs, this may be because of its small number of items, or because what it tries to asses is too complex that requires a study on its own. It is important to mention that, in the category of fruit juices, due to the value of this construct, rendering it unacceptable according to the scale suggested by the literature, only a descriptive analysis will be made. In fact, the category of fruit juices will not be featured in the in-depth analysis section of this thesis because of the aforementioned reason, and also because the Loyalty and Promotion Schemes construct was not extracted automatically, by SPSS, as a factor in the exploratory factor analysis, as all the other constructs for all the other product categories were. Therefore, in order to maintain the consistency of the analysis, this category is excluded, and will only be featured in the descriptive statistics section of the thesis.
4.1.3 Descriptive Statistics
Involvement construct
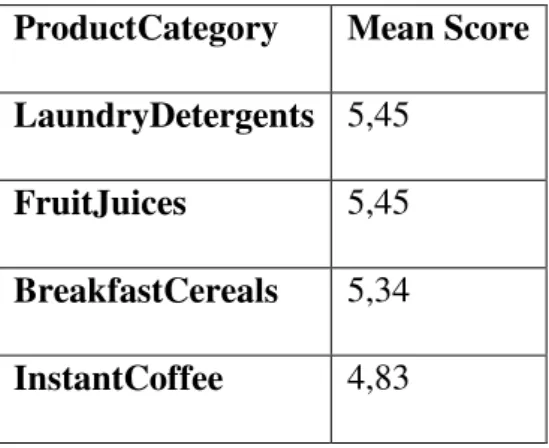
As mentioned in the methodology section, the product categories were chosen based on the findings of Zaichkowsky (1985), the following table shows the mean score of the involvement questions, for each product category:
Table 5: Involvement Construct mean score per product category
ProductCategory Mean Score
LaundryDetergents 5,45
FruitJuices 5,45
BreakfastCereals 5,34
InstantCoffee 4,83
These results support the reasoning for the choice of these categories, with the highest involvement scores going for the categories that were deemed as high involvement ones. It is also interesting to notice that breakfast cereal has a relatively high score, when compared to the
30 high involvement categories, this may be because of cultural preferences or the fact that the study was made more than thirty years ago.
Other Constructs
Regarding the other constructs, the following table shows the mean score of each of them, per product category.
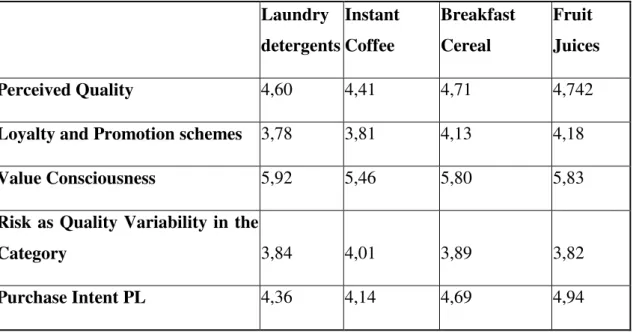
Table 6: Mean score of the Independent Variables’ constructs
Laundry detergents Instant Coffee Breakfast Cereal Fruit Juices Perceived Quality 4,60 4,41 4,71 4,742
Loyalty and Promotion schemes 3,78 3,81 4,13 4,18
Value Consciousness 5,92 5,46 5,80 5,83
Risk as Quality Variability in the
Category 3,84 4,01 3,89 3,82
Purchase Intent PL 4,36 4,14 4,69 4,94
The two constructs that yield the highest mean score on every category are Value Consciousness and Perceived Quality, this result allows for two important notes: Firstly, the respondents consider themselves to have a high value conscience, in the sense that they search a good balance between quality and price, in order to extract the most value possible of every purchase. This is a trait that became more prominent in the Portuguese consumer, mainly due to the recent economic crisis the country has been through. Secondly the mean scores for Perceived Quality are all bellow five (which in the scale corresponds to a partially agree), which means that, overall, private labels are not perceived as high quality products. This is also supported by the low mean scores of the Risk Quality Variability construct where, on average, respondents either partially disagree or are neutral, to the idea that there are no major differences in quality between the brands of the category.
Regarding the purchase intent for private labels, the two product categories that yield the higher mean scores are Fruit Juices and Breakfast Cereal, interestingly, these are the same categories
31 where Perceived Quality presents a higher score than any other category, and all the other mean scores are higher, with exception for the Value Consciousness construct for both of the categories, and Risk Quality Variability for Fruit Juices.
From this point onwards, the analysis will be made according to the product category in question, while maintaining a broad focus in terms of the conclusions and recommendations pointed out.
4.2. In-depth Analysis
4.2.1. Laundry Detergents
Exploratory Factor Analysis (EFA)
Firstly, in order to analyze how each construct impacted purchase intent for private labels in this category, I resorted to an EFA, using as extraction method Principal components, based on eigenvalues greater than one.
The first component of the EFA output produced by SPSS (Appendix Table 2) is the Kaiser-Meyer-Olkin Measure of Sampling Adequacy and the Bartlett's Test of Sphericity. The first measures the adequacy of the sample, in order to obtain a satisfactory factor analysis. According to Kaiser and Rice, (1974), a minimum value of 0,5 is required, but values between 0,7-0,8 are acceptable, and values above 0,9 are excellent. The second element is an indication of the strength of the relationship among the variables used in the factor analysis, this tests the null hypothesis that the correlation matrix is an identity matrix, meaning that all its diagonal elements are 1, and all the other elements are 0. The desired outcome is that the significance level of this test is below 0,05, which rejects the null hypothesis, meaning that the correlation matrix is not an identity one.
32 Table 7: Kaiser-Meyer-Olkin Measure of sampling adequacy and Bartlett’s test of sphericity for the exploratory factor analysis for Laundry Detergents
KMO and Bartlett's Test
Kaiser-Meyer-Olkin Measure of Sampling Adequacy. ,765
Bartlett's Test of Sphericity Approx. Chi-Square 635,473
df 91
Sig. ,000
The previous table shows that the sample used for this EFA is adequate: The Kaiser-Meyer-Olkin Measure of sampling adequacy value is above 0,5, and the value obtained is in the interval of acceptable values mentioned previously. Moreover, the Bartlett’s Test of Sphericity is statistically significant (Sig. <0,05).
The second component of the output produced by SPSS is the table of communalities, this table shows how much of the variance in the variables used for the analysis, is accounted by the extracted factors. As mentioned in the Methodology section, these values should be higher than 0,5 (Field, 2005). The table with the communalities above 0,4 is
This EFA resulted in four factors, which is the number of components above an eigenvalue of 1. The eigenvalue represents the amount of variance in the original variables associated with a factor. These four factors account for 72,57% of the variance.
Analyzing the Rotated Component Matrix allows for an easier interpretation of what composes each of the factors. The resulting factors are:
Factor 1: Perceived Quality;
Factor 2: Risk as Quality Variability in the Category; Factor 3: Value Consciousness;
Factor 4: Loyalty and Promotion Schemes.
Linear Regression without the effect of product involvement
These resulting factors were subsequently introduced in a linear regression model, as independent variables, with the dependent variable being the purchase intention for private
33 labels in the Laundry Detergents category. The method chosen for this regression was enter, to “force” the entry of all the variables, in order to analyze their impact and relative weight in the model.
Analyzing the regression output (Appendix Table 3), we can see that the regression explains 46,6% (Adjusted R square) of the variance, which is the proportion of variance in the dependent variable (purchase intention for private labels in the laundry detergents category) that is explained by the independent variables. The model has a standard error of approximately 1,29, which could be interpreted as the average distance of the data points from the fitted line of the model. Looking at the correlations table, there are no traces of collinearity between the variables (all Pearson Correlation terms outside the diagonal are below 0,8) This regression is statistically significant, as evidenced by the ANOVA table of the output.
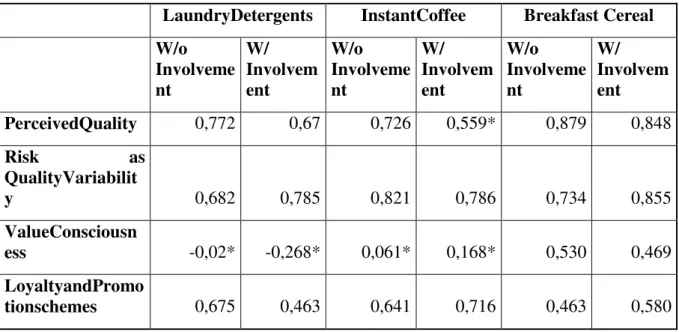
Regarding the coefficients, all but Value Consciousness (Factor 3), enter the model and are statistically significant. The highest coefficient is the one of Perceived Quality (Factor 1), followed by Risk as Quality Variability in the Category (Factor 2) and Loyalty and Promotion Schemes (Factor 4). We can conclude that the most impacting variable in the purchase intention for private labels in the Laundry Detergents category is Perceived Quality. If there is an increase of one unit in this dimension, it is predicted that he increase in purchase intention for private labels in the category would increase by 0,772. It is also important to notice that, although insignificant statistically speaking, Value Consciousness has a negative impact on the dependent variable.
Linear Regression with the effect of product involvement
At this stage of the analysis, I wanted to assess the moderating effect of involvement in the variables of the model. Following the procedure that was explained in detail in the Methodology section of the thesis, a new linear regression was estimated, this time using the originally extracted factors, together with the involvement level of each respondent and the new interaction variables, between involvement and each of the originally extracted factors.
This second regression explains 48,4% of the variance and has a standard error of approximately 1,27, which means that this second regression explains more variance and is slightly more precise than the first regression model estimated (Appendix Table 4). Regarding traces of collinearity, besides the interaction variables (whose collinearity is expectable given that they partly explain the same thing), all the Pearson Correlation terms, outside the diagonal,
34 are below 0,8. This regression model is also statistically significant, as evidenced by the ANOVA table present in the output.
The introduction of the interaction between the factors and the level of involvement impacts the coefficients. Looking at the output of the second regression (Appendix Table 4), we can see that Perceived Quality is no longer the most impacting independent variable, it is Risk as Quality Variability in the Category, with a coefficient of 0,785. The coefficient of Perceived quality suffers slight change with the introduction of involvement (went from a coefficient of 0,772 to one of 0,670), while the coefficient for the Loyalty and Promotion Schemes loses some of its importance in the model (a decrease from 0,645 to 0,463 from the first to the second regression model).
It is also important to notice that the only statistically significant interaction between the factors and involvement, is the one with the Value Consciousness (Factor 3), which has a positive coefficient, meaning that even though this Factor alone is non-significant in the model, it is a significant dimension for highly involved customers in this product category. Also interesting to point out that the only interaction variable with a negative coefficient, hence it would negatively influence the purchase intent if the consumer is a highly involved one (taking the first derivative of this component in order to the factor, the result will be a negative term, which multiplied by the “1” representing high involvement renders the whole term negative), is the one between involvement and Risk as Quality Variability in the Category, which understandable, a consumer that is involved in this category, would in theory be more knowledgeable of the product’s characteristics, so the risk of making the wrong choice would be lower, and therefore not such a concern on the decision.
4.2.2. Instant Coffee
Exploratory Factor Analysis (EFA)
Following the same reasoning described in the Laundry Detergents category section, we can state, based on the table below, that the sample used for this EFA is adequate, given the value obtained in the Kaiser-Meyer-Olkin Measure of Sampling Adequacy, of 0,839. We can also state that there is evidence of a strong relationship between the variables used in the EFA, given the statistical significance of the Bartlett's Test of Sphericity.
Table 8: Kaiser-Meyer-Olkin Measure of sampling adequacy and Bartlett’s test of sphericity for the exploratory factor analysis for Instant Coffee
35 KMO and Bartlett's Test
Kaiser-Meyer-Olkin Measure of Sampling Adequacy. ,839
Bartlett's Test of Sphericity Approx. Chi-Square 962,143
df 136
Sig. ,000
I followed the same procedure regarding the communalities (Appendix Table 5), as I did for the previous category, and once again after eliminating all the one that had a value below 0,5, the EFA extracted four factors, based on the criteria of eigenvalue higher than 1. These four extracted factors accounted for 73,93% of the variance. Through the Interpretation of the Rotated Component Matrix, the following factors are identified:
Factor 1: Value Consciousness; Factor 2: Perceived Quality;
Factor 3: Risk as Quality Variability in the Category; Factor 4: Loyalty and Promotion Schemes.
Linear Regression without the effect of product involvement
Once obtained, these factors were introduced as independent variables in a linear regression, following the same reasoning explained in the previous category, the model obtained (Appendix Table 6), explained 46,2% of the variance in the dependent value, and has a standard error of approximately 1,33. There are no traces of collinearity, given that the Pearson correlation terms outside the diagonal, are all below 0,8. This linear regression model is also statistically significant as the ANOVA table of the output proves it.
Regarding the coefficients of each variable in the model, can see that all but Value Consciousness (Factor 1) stand as statistically significant. The variable that mostly impacts the dependent variable is Risk as Quality Variability in the Category, with a coefficient of 0,821. The other variables also yield high coefficients in the model: Perceived Quality (Factor 2) with a coefficient of 0,726, and Loyalty and Promotion Schemes with a coefficient of 0,641. Unlike the previous category, even though it is statistically non-significant, Value Consciousness positively impacts the dependent variable.
36 Linear Regression with the effect of product involvement
In order to test the effect of involvement in the dependent variable, once again repeating the procedure previously described in the Methodology section, a new regression model was estimated (Appendix Table 7). This second regression has an adjusted R square of 0,445 and a standard error of the estimate of approximately 1,35, which means that this second model explains less variance and is slightly less precise than the first one. Once again, besides the interaction variables, there are no traces of collinearity (based on the Pearson correlation table), and the estimated model is statistically significant (based on the ANOVA table).
Regarding the coefficients of the model, only two variables stand as statistically significant: Risk as Quality Variability in the Category and Loyalty and Promotion Schemes, with coefficients of 0,786 and 0,716 respectively. It is important to notice that with the introduction of involvement, the variable Perceived Quality, which was previously the second most impacting variable in the model, lost its statistical significance in the new regression model. Also, all the interactions between the variables and the involvement level are statistically non-significant, with two of them presenting negative coefficients, in this case, those variables are Value Consciousness and Loyalty and Promotion Schemes, meaning that these would impact negatively the purchase intent if the consumer in question is highly involved.
4.2.3.Breakfast Cereal
Exploratory Factor Analysis (EFA)
As mentioned previously, this was the category where most respondents stated that they had purchased at least once, a private label product, so the in-depth analysis of this may be crucial for the overall understanding of the central theme of this study.
Once again following the same procedure previously described, an EFA was undertaken for this category.