Evaluation of plaque characteristics in coronary
artery patients with impaired glucose tolerance
through optical coherence tomography
Shenhong Jing ¹
Xuan Gao ²
Bo Yu ³ Hong Qiao4
1. Department of Cardiovascular, the 2nd Affiliated Hospital of Harbin Medical University ,Heilongjiang Province,150086, China
2. Department of Gynecology and Obstetrics, the 1st Affiliated Hospital of Harbin Medical University, Heilongjiang Province150086,China
3. Department of Cardiovascular, the 2nd Affiliated Hospital of Harbin Medical University, Heilongjiang Province,150086,China
4 . Department of Endocrinology, the 2nd Affiliated Hospital of Harbin Medical University, 246 Xuefu Road ,Harbin,Heilongjiang Province,150086, China
http://dx.doi.org/10.1590/1806-9282.64.05.433
SUMMARY
OBJECTIVE: With the adoption of optical coherence tomography (OCT), this study targets the impacts on plaque characteristics brought
about by impaired glucose tolerance (IGT) in patients with coronary artery disease.
METHODS: For this study, 150 patients with coronary artery disease were recruited. Regarding glycosylated hemoglobin (HbAlc), the
patients were sectioned into normal glucose tolerance (NGT), impaired fasting glucose (IFG), impaired glucose tolerance (IGT), and diabetes mellitus (DM) groups. Coronary angiography (CAG) and OCT were conducted for 150 patients.
RESULTS: There were 186 plaques discovered in 150 patients (37, 40, 44, and 65 in the NGT, IFG, IGT, and DM groups, respectively).
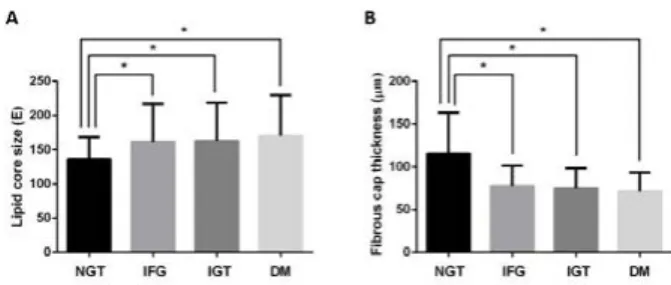
Compared to the NGT group, the lipid core size, which is presented as the average angle of the lipid arc, was markedly larger in the IFG,IGT and DM groups ( 135.7 ± 32.7 Ê, 161.2 ± 55.7 Ê, 162.5 ± 55.8 Ê, and 170.2 ± 59.7 Ê, respectively, all P values< 0.05). Meanwhile, the fibrous cap over the lipid core in the NGT group was remarkably thicker than that in the IFG, IGT, and DM groups (115.7 ± 47.7 μm vs. 77.7 ± 23.5 μm, 75.1 ± 23.2 µm, 71.2 ± 22.1 µm, all P values<0.05).
CONCLUSION: Coronary plaques in coronary artery patients with NDT are more stable than in those with IGT and DM. KEYWORDS: Tomography, Optical Coherence. Diabetes Mellitus. Coronary Disease. Coronary Artery Disease. Atherosclerosis.
DATE OF SUBMISSION: 26-Jul-2017 DATE OF ACCEPTANCE: 05-Aug-2017
CORRESPONDING AUTHOR: Hong Qiao Harbin, Heilongjiang Province Heilongjiang – 150086 - China
E-mail: HongQiaoaikan@163.com
In recent years, the prevalence and mortality of coronary heart disease (CAD) were increasing. In addition, two of its highest risk factors are diabetes mellitus (DM) and impaired glucose tolerance (IGT)1, 2. Diabetic patients are 2 to 4 times more likely to suffer from cardiovascular disease than non-diabetic patients. Furthermore, the stability of the coronary plaque is also considered to be a significant risk fac-tor for cardiovascular events 3,4. According to previ-ous studies, unstable coronary plaques are closely
atherosclerotic plaque and the thickness of the lip-id plaque fibrous cap, so as to determine the plaque morphology.
1. RESEARCH PARTICIPANTS AND METHODOLOGY
1.1 Research participants
A total of 150 patients with unstable angina (UA) and T2DM were included in this study between Jan-uary of 2011 and December of 2014, out of which 79 were males and 71 females, with a mean age of 64.68 ± 7.89 years. According to CAG examination results, one or more coronary artery with stenotic lesion(s) ≥ 50% diameter of the lumen was selected as a diagnos-tic criterion for CAD. WHO (1999) diagnosdiagnos-tic criteria were chosen for T2DM diagnosis [11]. Exclusion cri-teria included history of smoking, hypertension, con-genital heart disease, pulmonary heart disease, rheu-matic heart disease, cardiomyopathy, acute heart myocardial infarction, heart failure, severe anemia, aortic dissection, acute cerebrovascular disease, and severe liver and kidney dysfunction.
1.2 Image-producing and analyzing of OCT
The technique of OCT was utilized to generate pictures on OCT. The 6-Fr guiding catheter that can access radial line or femoral artery was also employed. The contrast media was injected into coronary arteries at 4 mL per second. The OCT started to record images with a speed of 15 mm per second. Those captured images were them studied with C7-XR Imaging Program by two independent radiologists. A thin-cap fibroatheroma or TCFA was taken as the sheerest fibrous cap. Its thickness was no more than 65 μm in a fat-ample condition
on interconnected image-producing. Macrophage infiltration refers to signal-ample discrete punctu-ate areas that outweigh the concentration of back-ground fleck noise12-14. Plaque disruption refers to fibrous cap incoherence with significant creation of hole in the condition15. Microchannel structures mean signal-bad cavities that are marked in sev-eral adjoining settings14. Calcification refers to well-marked and low backscattered mixed areas14. A thrombus is a well-marked substance with good signal connected to the luminal surface or moving inside the lumen14, 15.
1.3 Grouping
Based on the outcomes of a 75-g oral glucose le-nience trial, four groups of patients were formed. In such trial, NGT was prescribed with a fasting plasma glucose (FPG) level that was no more than 110 mg/dL and 2-h plasma glucose (PG) level no more than 140 mg/dL. IFG was observed with a 2-h PG level higher than 110 mg/dL, but lower than 126 mg/dL. IGT has a 2-h PG level higher than 140 mg/dL, but lower than 200 mg/dL. DM was observed as a prefigure of DM, hemoglobin A1c value no less than 6.5%, and FPG lev-el no less than 126 mg/dL or 2-h PG levlev-el no less than 200 mg/dL11.
1.4 Statistical studies
IBM SPSS 17.0 statistical program was employed to analyze the data. Continuous data were repre-sented as the mean ± standard deviation (SD). And categorical stats were described as proportions. All the trials were performed using a two-sided test of difference, in which the inspection level α of 0.05 and a difference with P < 0.05 were seen as statistically relevant.
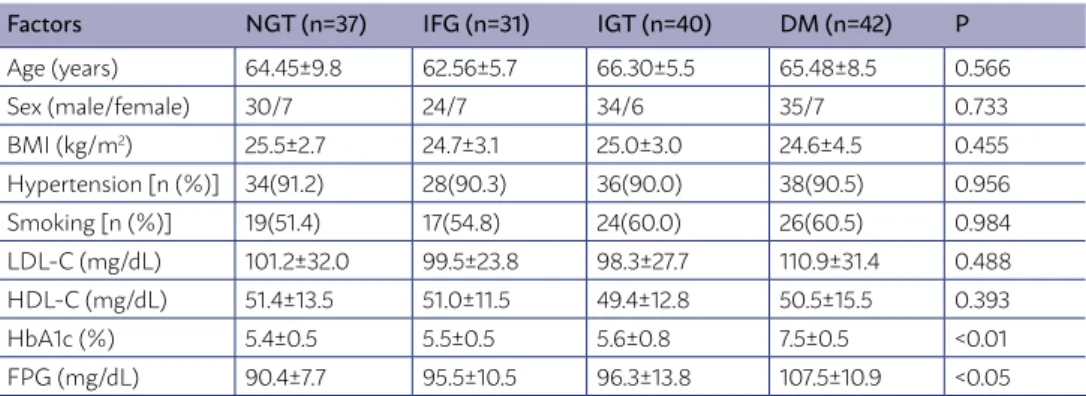
TABLE 1 - ESSENTIAL FEATURES OF THE FOUR GROUP PATIENTS.
Factors NGT (n=37) IFG (n=31) IGT (n=40) DM (n=42) P
Age (years) 64.45±9.8 62.56±5.7 66.30±5.5 65.48±8.5 0.566
Sex (male/female) 30/7 24/7 34/6 35/7 0.733
BMI (kg/m2) 25.5±2.7 24.7±3.1 25.0±3.0 24.6±4.5 0.455
Hypertension [n (%)] 34(91.2) 28(90.3) 36(90.0) 38(90.5) 0.956
Smoking [n (%)] 19(51.4) 17(54.8) 24(60.0) 26(60.5) 0.984
LDL-C (mg/dL) 101.2±32.0 99.5±23.8 98.3±27.7 110.9±31.4 0.488
HDL-C (mg/dL) 51.4±13.5 51.0±11.5 49.4±12.8 50.5±15.5 0.393
HbA1c (%) 5.4±0.5 5.5±0.5 5.6±0.8 7.5±0.5 <0.01
2. OUTCOMES
2.1 Essential features
Gender, age, BMI, blood pressure, level of LDL-C and HDL-C, as well as statin intake barely differs in the 4 units. The HbA1c level was significantly higher in the DM unit compared to those in IFG, IGT as well as NGT units. The FPG standards were significantly higher in DM, IFG, and IGT units compared to that in the NGT unit.
2.2 The characteristics of coronary plaques from OCT findings
A total of 186 plaques were discovered among 150 diseased patients (37, 40, 44, and 65 in NGT, IFG, IGT, and DM units, respectively). The percentages of calcification plaques, fat-ample plaques, as well as fi-brous plaques were the same (Table 2).
2.3 Plaque quantitative analysis
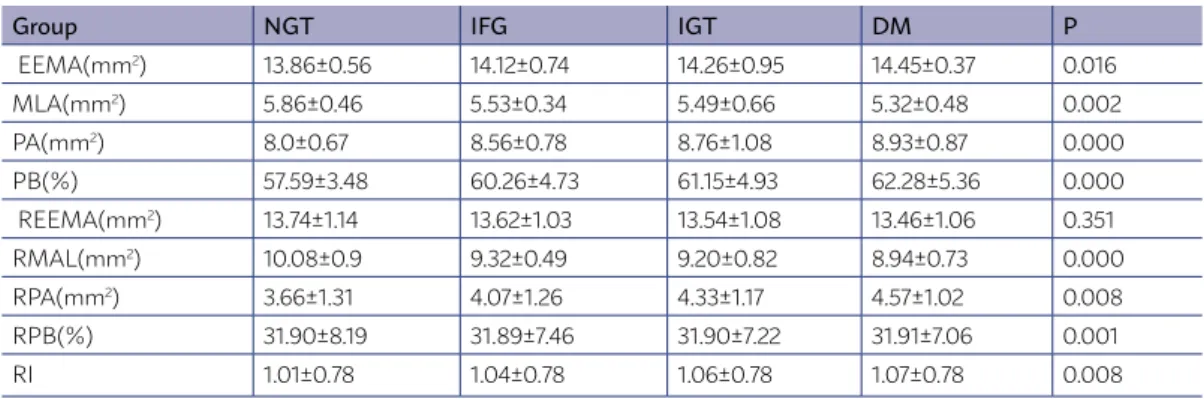
For 186 lesions, IGT group MLA < NGT group, and EEMA, PA and PB were significantly more than in the group NGT (P < 0.05), RMAL was substantially less than in group NGT, RPB > NGT (P < 0.05)
2.4 Comparison of plaque parameters from OCT findings
The lipid core’s size represented as the norm point of the lipid arc is remarkably larger in IFG, IGT, and DM units in comparison to that in the NGT unit (161.2 ± 55.7 Ê, 162.5 ± 55.8 Ê, 170.2 ± 59.7 Ê, and 135.7 ± 32.7 Ê, respectively, all P values < 0.05). The thickness of the fibrous cap on the lipid core is small-er in the formsmall-er units than in the lattsmall-er one (77.7 ± 23.5 μm, 75.1 ± 23.2 µm, 71.2 ± 22.1 µm vs. 115.7 ± 47.7 μm, all P values<0.05) .
3. DISCUSSION
A previous analysis found that the proportion of CAD patients combined with DM and IGT is as high as 30.0% and 40.0%, respectively. In addition, the
in-TABLE 2 - THE CHARACTERISTICS OF CORONARY PLAQUES FROM OCT FINDINGS
Variable NGT (n=37) IFG (n=40) IGT (n=44) DM (n=65) X2 P
Calcification plaques [n (%)] 13 (35.1) 10 (25.0) 17 (38.6) 22 (33.8) 0.58 0.75 Lipid-rich plaques [n (%)] 8 (21.6) 9 (22.5) 13 (29.5) 22 (33.8) 0.76 0.98 Fibrous plaques [n (%)] 16 (43.3) 21 (52.5) 14 (31.9) 21 (32.4) 0.64 0.77
cidence of abnormal glucose metabolism among CAD patients in China is approximately 80.0%, which is much higher than that in the Western population. Previous studies have shown that about 60.0~75.0%
of diabetic patients’ mortality is caused by cardiovas-cular complications. Furthermore, CAD brings about the highest death rate among people with diabetes. Yeboah et al.16 have found that approximately 3/4 of diabetic patients without CAD clinical symptoms have a reduction of more than 75.0% of the cross-sec-tional area of the coronary artery lumen. Even after the coronary artery revascularization, CAD causes more death among people suffering from DM than of those with no diabetes.
The HbA1c test result can accurately reflect the normal levels for the past 60 to 90 days for diabetic patients. It is not affected by diet, insulin injections and lifestyle changes, thus making it a reliable clini-cal indicator for assessing long-term glycemic control in diabetic patients. OCT can produce intravascular images with high resolutions, which has a significant correlation with pathological study results. It can clearly show the structural features of atherosclerot-ic conditions as well as accurately gauge the fatness of the fibrous cap, which is known as “in vivo histol-ogy microscopy” 17.
In the present study, we found that the percentag-es of calcification plaqupercentag-es, fat-ample plaqupercentag-es, as well
as fibrous plaques are the same. However, IFG, IGT, and DM units have larger lipid cores than those of the NGT unit. Additionally, the thickness of fibrous cap on the lipid core in the IFG, IGT, and DM groups decreases compared with that of the NGT unit. If the lipid core grows and the fibrous cap becomes thin-ner, it can lead to the instability of atherosclerotic plaques and, eventually, result in the onset of ACS. This research used 75g OGTT to identify those with IFG and IGT aiming to determine whether athero-sclerotic plaques are more unstable in CAD patients combined with IFG and IGT, compared to those with NGT using OCT. The results showed that, compared to CAD patients with NGT, those with IFG and IGT have significantly larger lipid cores and a thinner fi-brous cap.
Katoet al. 18 found that, in comparison to diseased patients with no diabetes, people with diabetes have plaques that are more fat-rich fibrous, which does not coincide with the results from the present study. This can be due to the fact that the present
analy-sis has a limited sample size. However, studies also found that the lipid core grows, and the fibrous cap becomes thinner among IFG, IGT, and DM patients, which is consistent with the results from Kato et al. 18. The underlying development structures of unsta-ble atherosclerotic conditions in diabetic patients have not been fully recognized. The reason may be that long-term hyperglycemia can cause coronary ar-tery vascular endothelial dysfunction, the loss of bal-ance between contraction and relaxation of the coro-nary artery, and increased plaque local inflammatory cell activities, therefore increasing the vulnerability and instability of atherosclerotic plaques 19, 20.
It is concluded that the instability of CAD victims suffering from atherosclerotic conditions combined with IFG, IGT, or DM presents more advantages than when compared to that of CAD patients with NGT. These findings may indicate that patients with ab-normal glucose metabolism might be more prone to cardiovascular-related diseases, in comparison to CAD patients with healthy glucose metabolism.
TABLE 3 - QUANTITATIVE ANALYSIS OF CORONARY PLAQUES IN 4 GROUPS
Group NGT IFG IGT DM P
EEMA(mm2) 13.86±0.56 14.12±0.74 14.26±0.95 14.45±0.37 0.016
MLA(mm2) 5.86±0.46 5.53±0.34 5.49±0.66 5.32±0.48 0.002
PA(mm2) 8.0±0.67 8.56±0.78 8.76±1.08 8.93±0.87 0.000
PB(%) 57.59±3.48 60.26±4.73 61.15±4.93 62.28±5.36 0.000
REEMA(mm2) 13.74±1.14 13.62±1.03 13.54±1.08 13.46±1.06 0.351
RMAL(mm2) 10.08±0.9 9.32±0.49 9.20±0.82 8.94±0.73 0.000
RPA(mm2) 3.66±1.31 4.07±1.26 4.33±1.17 4.57±1.02 0.008
RPB(%) 31.90±8.19 31.89±7.46 31.90±7.22 31.91±7.06 0.001
RI 1.01±0.78 1.04±0.78 1.06±0.78 1.07±0.78 0.008
RESUMO
OBJETIVO: Com a adoção da tomografia de coerência óptica (OCT), o presente estudo visa as características dos impactos na placa
trazidos pela tolerância diminuída à glicose (IGT) em pacientes com doença na artéria coronária.
MÉTODOS: Cento e cinquenta doentes com doença arterial coronária foram recrutados para este estudo. De acordo com a hemoglobina
glicosilada (HbAlc), os pacientes foram divididos em grupos: tolerância normal à glicose (NGT), diminuição da glicemia de jejum (IFG), diminuição da tolerância à glicose (IGT) e diabetes mellitus (DM). Angiografia coronária (CAG) e OCT foram conduzidas para 150 doentes.
RESULTADOS: Existem 186 placas descobertas em 150 doentes (37, 40, 44 e 65 nos grupos NGT, IFG, IGT e DM, respectivamente). Em
relação ao grupo NGT, o tamanho do núcleo lipídico, que é apresentado como o ângulo médio do arco lipídico, foi significativamente maior nos grupos IFG, IGT e DM (135,7 ± 32,7 Ê, 161,2 ± 55,7 Ê, 162,5 ± 55,8 Ê, e 170,2 ± 59,7 Ê, separadamente, os valores de P<0,05). Entretanto, a tampa sobre o núcleo de lipídios fibrosos no grupo NGT estava bem mais grossa do que nos grupos IFG, IGT e DM (115,7 ± 47,7μm vs. 77,7 ± 23,5 μm, 75,1 ± 23,2 µm, 71,2 ± 22,1 µm, todos os valores de P<0,05).
CONCLUSÃO: Placas coronárias na artéria coronária de pacientes com NDT são mais estáveis do que em doentes com IGT e DM.
PALAVRAS-CHAVE: Tomografia de coerência óptica. Diabetes mellitus. Doença das coronárias. Doença da artéria coronariana.
REFERENCES
1. Kannel WB, McGee DL. Diabetes and cardiovascular disease. The Fram-ingham study. JAMA. 1979;241(19):2035-8.
2. DECODE Study Group, the European Diabetes Epidemiology Group. Glucose tolerance and cardiovascular mortality: comparison of fasting and 2-hour diagnostic criteria. Arch Intern Med. 2001;161(3):397-405.
3. Arbustini E, Dal Bello B, Morbini P, Burke AP, Bocciarelli M, Specchia G, et al. Plaque erosion is a major substrate for coronary thrombosis in acute myocardial infarction. Heart. 1999;82(3):269-72.
4. Farb A, Burke AP, Tang AL, Liang TY, Mannan P, Smialek J, et al. Coronary plaque erosion without rupture into a lipid core. A frequent cause of cor-onary thrombosis in sudden corcor-onary death. Circulation. 1996;93(7):1354-63.
5. Falk E, Shah PK, Fuster V. Coronary plaque disruption. Circulation. 1995;92(3):657-71.
6. Sharkey SW, Maron BJ. Epidemiology and clinical profile of Takotsubo car-diomyopathy. Circ J. 2014;78(9):2119-28.
7. Capaldo B, Di Bonito P, Iaccarino M, Roman MJ, Lee ET, Devereux RB, et al. Cardiovascular characteristics in subjects with increasing levels of abnormal glucose regulation: the Strong Heart Study. Diabetes Care. 2013;36(4):992-7.
8. Stiermaier T, Moeller C, Oehler K, Desch S, Graf T, Eitel C, et al. Long-term excess mortality in Takotsubo cardiomyopathy: predictors, causes and clinical consequences. Eur J Heart Fail. 2016;18(6):650-6.
9. Narula J, Garg P, Achenbach S, Motoyama S, Virmani R, Strauss HW. Arithmetic of vulnerable plaques for noninvasive imaging. Nat Clin Pract Cardiovasc Med. 2008;5(Suppl 2):S2-10.
10. Kume T, Akasaka T, Kawamoto T, Okura H, Watanabe N, Toyota E, et al. Measurement of the thickness of the fibrous cap by optical coherence to-mography. Am Heart J. 2006;152(4):755 e1-4.
11. Rydén L, Grant PJ, Anker SD, Berne C, Cosentino F, Danchin N, et al. ESC Guidelines on diabetes, pre-diabetes, and cardiovascular diseases devel-oped in collaboration with the EASD: the Task Force on diabetes, pre-dia-betes, and cardiovascular diseases of the European Society of Cardiology
(ESC) and developed in collaboration with the European Association for the Study of Diabetes (EASD). Eur Heart J. 2013;34(39):3035-87.
12. Tearney GJ, Yabushita H, Houser SL, Aretz HT, Jang IK, Schlendorf KH, et al. Quantification of macrophage content in atherosclerotic plaques by optical coherence tomography. Circulation. 2003;107(1):113-9.
13. MacNeill BD, Jang IK, Bouma BE, Iftimia N, Takano M, Yabushita H, et al. Focal and multi-focal plaque macrophage distributions in patients with acute and stable presentations of coronary artery disease. J Am Coll Car-diol. 2004;44(5):972-9.
14. Tearney GJ, Regar E, Akasaka T, Adriaenssens T, Barlis P, Bezerra HG, et al. Consensus standards for acquisition, measurement, and reporting of in-travascular optical coherence tomography studies: a report from the Inter-national Working Group for Intravascular Optical Coherence Tomography Standardization and Validation. J Am Coll Cardiol. 2012;59(12):1058-72.
15. Jang IK, Tearney GJ, MacNeill B, Takano M, Moselewski F, Iftima N, et al. In vivo characterization of coronary atherosclerotic plaque by use of optical coherence tomography. Circulation. 2005;111(12):1551-5.
16. Yeboah J, Erbel R, Delaney JC, Nance R, Guo M, Bertoni AG, et al. Devel-opment of a new diabetes risk prediction tool for incident coronary heart disease events: the Multi-Ethnic Study of Atherosclerosis and the Heinz Nixdorf Recall Study. Atherosclerosis.2014;236(2):411-7.
17. Patel PM, Kern MJ. Comparing imaging lipid plaque with NIRS and OCT: “All that’s yellow is not gold (a vulnerable plaque)”. Catheter Cardiovasc Interv. 2014;84(5):718-9.
18. Kato K, Yonetsu T, Kim SJ, Xing L, Lee H, McNulty I, et al. Comparison of nonculprit coronary plaque characteristics between patients with and without diabetes: a 3-vessel optical coherence tomography study. JACC Cardiovasc Interv. 2012;5(11):1150-8.
19. Geng J, Hu T, Wang B, Lu W, Ma S. Thyroid stimulating hormone levels and risk of coronary heart disease in patients with type 2 diabetes mellitus. Int J Cardiol. 2014;174(3):851-3.