TEMAS LIVRES FREE THEMES
1 Centro das Ciências Biológicas e da Saúde, Universidade Federal do Oeste da Bahia. R. Professor José Seabra de Lemos lado par, Recanto dos Pássaros. 47808-021 Barreiras BA Brasil.
[email protected] 2 Faculdade Governador Ozanam Coelho. Ubá MG Brasil.
3 Departamento de Nutrição e Saúde, Universidade Federal de Viçosa. Viçosa MG Brasil.
4 Escola de Enfermagem, Universidade Federal de Minas Gerais. Belo Horizonte MG Brasil.
Risk and protective factors for chronic diseases in adults:
a population-based study
Fatores de risco e de proteção para doenças crônicas em adultos:
um estudo de base populacional
Resumo Este artigo descreve a frequência relati-va de comportamentos de risco e de proteção para doenças crônicas não transmissíveis (DCNT) em adultos de Viçosa, Brasil. Foi realizado um estudo transversal de base populacional, incluindo 1226 adultos residentes do município. Utilizou-se um questionário estruturado, contendo questões so-ciodemográficas e comportamentais. Os fatores de risco/proteção avaliados foram: tabagismo, práti-ca de atividade físipráti-ca, consumo abusivo de bebida alcóolica e consumo alimentar. A proporção dos fatores de risco/proteção foi calculada na popula-ção total, de acordo com sexo, escolaridade e nível socioeconômico. A população avaliada apresenta elevada frequência de fatores de risco para DCNT, como consumo abusivo de bebidas alcoólicas, há-bito de consumir leite integral, ingerir carnes com gorduras visíveis, consumo regular de refrigerantes e 78,5% não atingiram a recomendação mínima para atividade física no lazer. Em relação aos fa-tores de proteção, 86,2% da população relataram consumir regularmente frutas e vegetais, e 73%, feijões. Verificou-se a maior frequência de fatores de riscos no sexo masculino, em indivíduos de me-nor idade e nível socioeconômico intermediário. Nesta população há urgência nas políticas pú-blicas de planejamento municipal para mudar o atual cenário.
Palavras-chave Fatores de risco, Doenças crôni-cas, Inquéritos epidemiológicos
Abstract The article describes the relative fre-quency ok of risk and protective behaviors for chronic non-communicable diseases (NCDs) in adults residing in Viçosa, Brazil. A cross-section-al population-based study including 1,226 adults living in the municipality. We used a structured questionnaire containing questions sociodemo-graphic and behavioral The risk and protection factors evaluated were: smoking, physical activity, excessive consumption of alcohol and food con-sumption. The proportion of risk and protection factors was calculated in the total population, according to gender, education and socioeco-nomic status. The studied population has a high frequency of risk factors for NCDs, such as exces-sive consumption of alcoholic beverages, habit of consuming whole milk, habit of eating meat with visible fat, regular consumption of soft drinks and 78.5% did not achieve the minimum recommen-dation for physical activity in leisure time. With regard to protective factors, 86.2% of the popula-tion reported regular consumppopula-tion of fruits and vegetables, and 73%, of beans. It was found the highest frequency of risk factors in among males, in younger people and middle socioeconomic sta-tus. This population has an urgent need for public policy of municipal planning to change this cur-rent scenario.
Key words Risk factors, Chronic disease, Health surveys
Danielle Cristina Guimarães da Silva 1
Wellington Segheto 2
France Araújo Coelho 3
Vanessa Guimarães Reis 3
Sílvia Helena Oliveira Morais 3
Milene Cristine Pessoa 4
Sil
va D
Introduction
Concern about the inluence of modern eating habits, physical inactivity and tobacco and alco-hol use in the development of chronic non-com-municable diseases (NCD) has increased in many countries. Epidemiological studies have conirmed the association between these major risk factors and the rise of NCDs1-4. Important-ly, these diseases have been the leading causes of death in both developed and developing coun-tries5,6.
In the last two decades, the dietary pattern of the Brazilian population has been changing with the predominance of high saturated-fat, high-sugar and low-iber foods. The Consum-er Expenditure Survey (2008-2009) published alarming data on the excessive consumption of sugar and saturated fat, which was reported by 61% and 82% participants of the survey, respec-tively, and low iber intake reported by 68% of the participants7. Besides these mentioned as-pects, national estimates reveal that physical in-activity and alcohol and tobacco use have a high prevalence in the country8-10.
To modify this scenario, the World Health Organization launched the Global Strategy on Diet, Physical Activity and Health to promote health through public health actions and preven-tive measures11. In Brazil, the Ministry of Health launched the Strategic Action Plan for the Fight of Chronic Non-communicable Diseases, 2011-2022, aiming at promoting the development and implementation of integrated public policies and evidence-based prevention and control of NCDs and their risk factors12. The recent update and publication of the Dietary Guidelines for the Brazilian Population, in 2014, complements the strategies to face the current health scenario13.
The identiication of factors associated with the risk or protection for the development of NCDs in a population is a requirement in order to assist in the planning of actions to improve public health14, since the modiiable risk factors such as smoking, physical inactivity, unhealthy diet and the harmful use of alcohol are possible to be minimized by seeking healthy behaviors8,15.
Therefore, the objective of this study was to describe the frequency of risk and protective be-haviors for the development of NCDs in adults between 20 and 59 years of age, living in the ur-ban area of the municipality of Viçosa, Minas Gerais, Brazil.
Materials and methods
This is a descriptive epidemiological, cross-sec-tional study conducted by the study group on health and nutrition of Viçosa (ESA/Viçosa), using a population-based household survey in the urban area of Viçosa - Minas Gerais. The population of the city according to the census of 2010 was 72.220 habitants, 93% in the urban area. Related to gender, there is a predominance of women, constituting 51.5% of the popula-tion. Regarding the age distribution, children correspond to 6.05% of the population, teen-agers 16.18%, adults 60.13%, and 17.34% are elderly people. About the ethnic composition they are: white, Asian, Indians, black and brown, spread over 46.60%, 0.82%, 00.12%, 15.50% and 36.96%, respectively. The municipal human de-velopment index (MHDI) is 0.775, placing it in 11th place among all cities in the state and has an average per capita income of R$ 521.6716. Viçosa has unique characteristics compared to other cit-ies with the same size because of the large num-ber of college students residing in it. The study population consisted of adults aged between 20 and 59 years of age at the time of the survey, men and women living in the urban area of the mu-nicipality.
Data were collected between September 2012 and March 2014, involving a team of interviewers and supervisors previously trained to apply the questionnaire.
The sample size was calculated by the formu-la for prevalence estimates, considering the total number of individuals aged between 20 and 59 years living in the urban area of Viçosa, amount-ing to 43,431 people16. Prevalence was estimated at 50%, as a result of this study be part of a larger project consisting of other outcomes and associ-ated factors, 95% conidence level, the sampling error of 4.1 percent and deff (design effect) 1.55. There was a 20% increase in losses and refusals. Calculations using the software Epi-Info 3.5.2®17 showed a minimum sample size (n) of 1049 par-ticipants. Exclusion criteria included: pregnant women, postpartum women, individuals that were bedridden or unable to take measurements, individuals with cognitive/intellectual dificulty or found it dificult to respond to the question-naire.
aúd
e C
ole
tiv
a,
22(12):4041-4050,
2017
a starting point from which to choose the homes to be visited and include all eligible participants from each household.
A structured, standardized questionnaire was used to collect sociodemographic, and behavior-al data. This study evbehavior-aluates the frequency of risk and protective factors in adults living in Viçosa. Among the risk factors, the following variables were evaluated: smoking, physical inactivity, al-cohol abuse, habitual consumption of whole milk and fat meats (red meat with visible fat and / or chicken with skin) and regular consumption of soft drink. Protective factors evaluated were: suficient physical activity during leisure time (leisure) and regular consumption of beans, fruits and vegetables.
The sociodemographic variables were: age in completed years and categorized into ten-year periods (20-29, 30-39, 40-49 and 50-59 years), schooling in completed years of study and set to 0-3 4-7 and ≥ 8 years of study and socioeconomic status, according to the Brazilian Association of Research Companies18 and classiied into socio-economic levels A and B, C and D and E. Behav-ioral variables included smoking data, physical activity level and abuse of alcohol.
The smoking data were categorized in two groups: smokers and ex-smokers; and non-smok-ers19. The physical activity level (PAL) was as-sessed using the International Physical Activity Questionnaire (IPAQ), long version, validated for the Brazilian population20. This instrument is divided into four domains (physical activity at work; physical activity as a means of transporta-tion; physical activity at home and physical activ-ity for recreation, sport, exercise and leisure). In this study only the fourth domain (physical ac-tivity recreation, sport, exercise and leisure) was used to identify the PAL, which was calculated by adding the time spent on moderate physical activities more twice the time with vigorous ac-tivities. We used the cutoff point 150 minutes / week (“reach the recommendation” ≥ 150 min-utes / week; “does not reach the recommenda-tion” <150 minutes / week)21. The abuse of alco-hol was considered present if there was ingestion of more than ive drinks on a single occasion in the last thirty days for men, and more than four drinks for women. The standard dose set on half a bottle or a can of beer, a glass of wine or a shot of spirits22.
The characteristics related to the eating hab-its of the participants were based on a structured questionnaire consisting of direct questions re-lating to food consumption, proposed by the
Risk and Protective Factors Surveillance System for Chronic Diseases by Telephone Interviews (VIGITEL)23. Thus, the consumption of fruits, vegetables, beans and soft drinks was considered regular when respondents reported consumption of these foods more than ive times a week. The habit of consuming whole milk and meat with visible fat (red meat with visible fat and / or chicken with skin) was also investigated.
Quality control was conducted by the ran-dom application of questions in the question-naire in 10% of the sample through telephone contact and double entry of the questionnaire by previously trained typists. After checking the data consistency, analyses were performed using the statistical software STATA 13.1, taking into account the sample design effect using the svy tab commands. Sample weights considering the variables sex, age and education were calculat-ed to equalize differences in socio-demograph-ic composition of the sample in relation to the composition of the adult population of the city, according to the census distribution of 201016. The proportions and respective intervals with 95% conidence level were calculated for the risk and protective factors for chronic diseases of the overall sample and stratiied according to the variables: gender, age and socioeconomic status. The statistical signiicance was veriied with the ² test, considering p <0.05.
The project was approved by the Ethics Com-mittee of the Federal University of Viçosa, pro-tocol number 008/12. Free consent signatures were requested and the survey participants were informed previously to data collection.
Results
The response rate was 95.64%, getting the full 1226 eligible adults that were interviewed. With respect to sociodemographic characteristics, the sample was predominantly composed of wom-en, corresponding to 50.8%. Most of the subjects were in the age group 20-29 years, with 8 or more years of schooling and middle socioeconomic status (class C) (Table 1).
men-Sil
va D
tioned the regular consumption of soft drinks. The consumption of bean for ive or more days a week was reported by 86.25% of the sample and of fruits and vegetables by 73%.
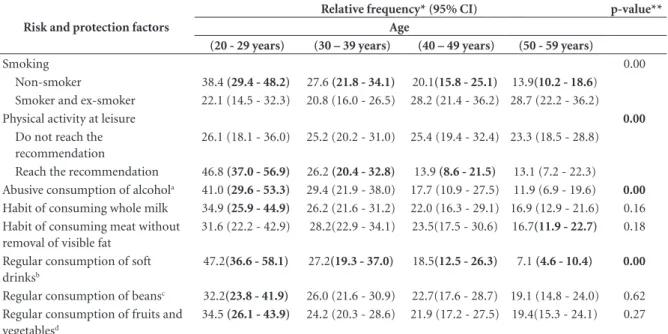
Tables 2, 3 and 4 show the proportions and the respective intervals with 95% conidence for the risk and protection factors for NCDs in this population, according to sex, age and so-cioeconomic status. Among the behavioral and socio demographic factors studied, smoking and ex-smoking were more common in males, slight-ly higher in individuals aged between 20 and 29, with differences between ages and higher in indi-viduals of socioeconomic class C. The dificulty in reaching the minimum recommendation of physical activity was predominant in females and
more frequently in individuals aged between 20 and 29 and socioeconomic class C, with statisti-cal differences detected between socioeconomic levels.
Abusive consumption of alcohol was more frequently related to male participants (54.4%), with differences between the sexes, predominant in individuals aged between 20 and 29, with dif-ferences between age and socioeconomic class C. In relation to characteristics of food con-sumption, men showed more behaviors consid-ered risk factors than women, with more frequent habitual consumption of whole milk, 51.7%, meat with visible fat, 58.2%, with signiicant dif-ferences between sexes (p < 0.001) and consump-tion of soft drinks for ive or more days a week, Table 1. Demographic, socioeconomic, behavioral and food consumption characteristics of the population, Viçosa, MG, 2012-2014.
Variable Relative Frequency* (%)
Confidence interval (95% CI)
Sex
Male 49.2 (45.7 - 52.7)
Female 50.8 (47.3 - 54.3)
Age (years)
20 – 29 32.8 (24.3 - 42.5)
30 – 39 25.3 (21.1 - 29.9)
40 – 49 22.9 (18.3 - 28.3)
50 – 59 19.0 (15.1 - 23.7)
Education (years)
0 – 3 12.3 (7.3 – 19.7)
4 – 7 16.0 (11.8 – 21.4)
>=8 71.7 (61.1 – 80.3)
Socioeconomic level (ABEP)
High (A and B) 24.5 (19.0 - 31.1)
Middle (C) 64.7 (59.9 - 69.2)
Low (D and E) 10.8 (7.3 - 15.6)
Smoking
Non-smoker 65.4 (59.9 - 70.6)
Smoker and ex-smoker 34.6 (29.3 - 40.1)
Physical activity at leisure
Do not reach the recommendation 78.5 (71.3 - 84.3)
Reach the recommendation 21.5 (15.7 - 28.6)
Abusive consumption of alcohola 39.3 (35.4 - 43.4)
Habit of consuming whole milk 59.0 (54.7- 63.1) Habit of consuming meat without removal of visible fat 55.4 (50.3 - 60.3) Regular consumption of soft drinksb 27.8 (23.8 - 32.3)
Regular consumption of beansc 86.2 (83.2 - 88.8)
Regular consumption of fruits and vegetablesd 73.0 (67.3 - 77.9)
aúd
e C
ole
tiv
a,
22(12):4041-4050,
2017
56.2%, with signiicant differences between sexes (p < 0.001). The regular consumption of beans was higher for males, with signiicant differenc-es between the sexdifferenc-es. All consumption variabldifferenc-es were observed with higher frequency in
individ-uals aged between 20 and 29 years and middle socioeconomic status. The habitual consumption of milk and regular consumption of soft drink showed signiicant differences between the age groups.
Table 2. Distribution of risk and protective factors for chronic diseases in the population, according to sex, Viçosa, MG, 2012-2014.
Risk and protection factors Relative frequency* (95% CI) p-value**
Men Women
Smoking 0.09
Non-smoker 45.9 (41.9 – 50.0) 54.1 (50.0 – 58.1) Smoker and ex-smoker 55.4 (46.0 - 64.4) 44.5 (35.5 - 53.9)
Physical activity at leisure 0.07
Do not reach the recommendation 46.1 (41.7 - 50.5) 53.9 (49.5 - 58.3) Reach the recommendation 66.7 (59.8 - 72.9) 33.3 (27.0 - 40.2)
Abusive consumption of alcohola 54.4 (48.9 - 60.1) 24.6 (21.6 - 28.0) 0.00
Habit of consuming whole milk 51.7 (46.6 - 56.8) 48.3 (43.2 - 53.4) 0.13 Habit of consuming meat without removal
of visible fat
58.2 (52.6 - 63.5) 41.8 (36.5 - 47.4) 0.00
Regular consumption of soft drinksb 56.2 (50.8 - 61.4) 43.8 (38.6 - 49.1) 0.00
Regular consumption of beansc 50.4 (46.5 - 54.2) 49.6 (45.7 - 53.5) 0.04
Regular consumption of fruits and vegetablesd 47.3 (42.4 - 52.2) 52.7 (47.8 - 57.5) 0.07
* Frequency weighted by sex, age and education. ** Chi-square test (p < 0.05). a More than ive (men) or more than four (women) doses at least one occasion in the last 30 days. b Consumption of soft drinks in 5 or more days per week. c Consumption of bean 5 or more days a week. d Consumption of fruits and vegetables 5 or more days a week.
Table 3. Distribution of risk and protective factors for chronic diseases in the population, by age group, Viçosa, MG, 2012-2014.
Risk and protection factors
Relative frequency* (95% CI) p-value** Age
(20 - 29 years) (30 – 39 years) (40 – 49 years) (50 - 59 years)
Smoking 0.00
Non-smoker 38.4 (29.4 - 48.2) 27.6 (21.8 - 34.1) 20.1(15.8 - 25.1) 13.9(10.2 - 18.6) Smoker and ex-smoker 22.1 (14.5 - 32.3) 20.8 (16.0 - 26.5) 28.2 (21.4 - 36.2) 28.7 (22.2 - 36.2)
Physical activity at leisure 0.00
Do not reach the recommendation
26.1 (18.1 - 36.0) 25.2 (20.2 - 31.0) 25.4 (19.4 - 32.4) 23.3 (18.5 - 28.8)
Reach the recommendation 46.8 (37.0 - 56.9) 26.2 (20.4 - 32.8) 13.9 (8.6 - 21.5) 13.1 (7.2 - 22.3) Abusive consumption of alcohola 41.0 (29.6 - 53.3) 29.4 (21.9 - 38.0) 17.7 (10.9 - 27.5) 11.9 (6.9 - 19.6) 0.00
Habit of consuming whole milk 34.9 (25.9 - 44.9) 26.2 (21.6 - 31.2) 22.0 (16.3 - 29.1) 16.9 (12.9 - 21.6) 0.16 Habit of consuming meat without
removal of visible fat
31.6 (22.2 - 42.9) 28.2(22.9 - 34.1) 23.5(17.5 - 30.6) 16.7(11.9 - 22.7) 0.18
Regular consumption of soft drinksb
47.2(36.6 - 58.1) 27.2(19.3 - 37.0) 18.5(12.5 - 26.3) 7.1 (4.6 - 10.4) 0.00
Regular consumption of beansc 32.2(23.8 - 41.9) 26.0 (21.6 - 30.9) 22.7(17.6 - 28.7) 19.1 (14.8 - 24.0) 0.62
Regular consumption of fruits and vegetablesd
34.5 (26.1 - 43.9) 24.2 (20.3 - 28.6) 21.9 (17.2 - 27.5) 19.4(15.3 - 24.1) 0.27
Sil
va D
Discussion
Chronic non-communicable diseases have an important role in the current health proile of the population. In Brazil, there is an increase in the prevalence of these diseases, causing many complaints. There are important national and international population studies on the rela-tionship between demographic, socioeconomic and behavioral aspects and the rates of risk fac-tors for NCDs24-26. However, though there are population-based studies that aim to determine the prevalence of risk and protective factors for NCDs in small cities27, they are scarce. In addi-tion, as previously mentioned, this survey was conducted in a university town and may have pe-culiar results due to the proile of the population.
The descriptive analysis of the participants’ lifestyles in this study shows that this population has a high risk of developing NCDs because of the high prevalence of abusive consumption of alcohol, habit of consuming whole milk and eat-ing meat with visible fat, regular consumption of soft drinks and predominant physical inactivity. Such behaviors are typical of college students, es-pecially those who live without living parents, as in our sample.
The nationwide telephone surveys carried out in Brazil have shown a tendency to reduction in the use of cigarettes10,23,28. The prevalence of smoking in this study was described as inferior to some population-based surveys9,29, however, higher than the most recent data published by VIGITEL10. In addition, the highest frequency of smoking was demonstrated in men, in younger individuals and in the middle socioeconomic class. These indings point out the importance of evaluating the effectiveness of awareness cam-paigns and regulatory and restrictive measures adopted in the municipality, since the tobacco constitutes the most important risk factor for NCDs29.
Although the Global Strategy on Diet, Physical Activity and Health11 recommends that individuals engage in adequate levels of physical activity throughout their lives, in Brazil, the fre-quency of physical activity during leisure shown by VIGITEL data in 201310 is only 33.8%. This may result in increased risk of overweight and cardiovascular diseases in a population4. Simi-lar to reports of other Brazilian studies3,30,31, we found high rates of physical inactivity and that men are more active than women, hence, the latter group should receive greater attention, to Table 4 Distribution of risk and protective factors for chronic diseases in the population, according to the
socioeconomic level, Viçosa, MG, 2012-2014.
Risk and protection factors
Relative frequency* (95% CI) p-value** High socioeconomic
status (A and B)
Middle socioeconomic status (C)
Low socioeconomic status (D and E)
Smoking 0.63
Non-smoker 25.5 (19.8 - 32.0) 64.7 (59.1 - 70.0) 9.8 (6.2 - 15.1)
Smoker and ex-smoker 22.8 (15.8 - 31.6) 64.6 (56.2 - 72.1) 12.5 (6.0 - 24.4)
Physical activity at leisure 0.00
Do not reach the recommendation
19.7 (14.4 - 25.7) 66.6 (61.8 - 71.0) 13.7 (9.2 - 20.5)
Reach the recommendation 34.7 (27.6 - 42.5) 61.1 (52.0 - 69.4) 4.2 (2.1 - 8.2)
Abusive consumption of alcohola 27.6 (20.8 - 35.5) 64.4 (56.1 - 72.0) 7.9 (4.4 - 14.0) 0.16
Habit of consuming whole milk 23.1(17.8 - 29.4) 67.3 (62.3 - 72.0) 9.5 (5.8 - 15.1) 0.15 Habit of consuming meat
without removal of visible fat
23.5 (17.8 - 30.4) 69.0 (62.7 - 74.7) 7.5 (3.6 - 14.8) 0.06
Regular consumption of soft drinksb
24.2 (17.4 - 32.5) 68.1 (60.8 - 74.6) 7.7 (4.0 - 14.5) 0.37
Regular consumption of beansc 24.1 (18.5 - 30.8) 64.4 (59.2 - 69.2) 11.5 (7.6 - 17.0) 0.24
Regular consumption of fruits and vegetablesd
29.5 (23.4 - 36.4) 61.5 (56.4 - 66.5) 9.0 (5.7 - 13.9) 0.00
aúd
e C
ole
tiv
a,
22(12):4041-4050,
2017
ight inactivity. The low frequency of physically active individuals is also in agreement with the indings of Rombaldi et al.32.
Alcohol consumption has been demonstrated across diverse populations33, and the frequency of Brazilians that report abusive alcohol consump-tion is 16.4%10. Cibeira et al.34 found association between alcohol consumption and sociodemo-graphic factors in a sample of women from Porto Alegre, RS. The authors reported that 30% of the group stated to consume alcoholic beverages on a regular basis, and the better-educated and high-er income whigh-ere associated with consumption of higher amounts of alcohol.
In this study, we investigated the reported al-cohol consumption in the last 30 days, from this point, we found that 39.3% of adults residents in Viçosa, who were interviewed in the survey, re-ported abusive alcohol consumption, showing that the expectations and goals for reducing al-cohol prevalence outlined in the Action Plan of the Ministry of Health12 have not been achieved in the municipality. One possible explanation for this scenario is the demographic proile of the city’s population, which is made up of a high number of young university students. Another important result was the highest alcohol con-sumption among men. VIGITEL10 reported in its latest publication that alcohol abuse is greater in younger individuals (18-34 years), corroborating our indings. Heavy alcohol consumption was investigated by Alexandre et al.1; Moura et al.3; Laranjeira et al.33 and, similarly, men reported greater consumption than women.
In a study to identify sociodemographic and behavioral factors related to adult eating hab-its in the city of Goiania, GO, Alexandre et al.1, showed that regular consumption of whole milk was similar for both sexes, corroborating what was detected in this study. Data of the last VIG-ITEL reports10,23 indicated higher frequencies of whole milk consumption in the male popula-tion. It is noteworthy that these frequencies are considered high in view of the beneits obtained with healthier food choices such as skim milk35, as the habitual consumption of animal products such as whole milk is considered an important risk factor for the development of cardiovascular diseases and certain types of cancer36. This study also found more frequent consumption of whole milk in the younger group, who also reported middle economic level.
Rombaldi et al.32 presented data from a pop-ulation-based study conducted in the city of Pelotas, RS, where 32.7% of the assessed adults
reported regular consumption of fatty meats. International population-based studies also re-ported the habitual fat consumption of 33.7%37 and between 34 and 36%38. We found higher percentages than those reported, however, they were consistent, when evaluating the distribution of fat consumption by gender, since men usual-ly consume more fatty foods than women39. The proportion in the usual intake of meat with vis-ible fat was higher in individuals of the middle economic class.
In relation to soft drink consumption, it has been found that the frequency of consumption investigated in this study was similar to that found by Longo et al.9 in a population-based study in Lages, SC. In addition, the increased consump-tion of soft drinks reported by young men is con-sistent with studies that had the same focus9,10,32. We also found that the individuals belonging to socioeconomic level C reported the highest con-sumption of these products. According to data of the Household Budget Survey (POF 2002-2003), there was a 400% increase in the soft drink par-ticipation in household food purchases by Bra-zilians, which is higher in lower income classes40. Brazilian studies have shown that this scenario is repeated with college students41,42.
Information collected by the World Health Survey43 shows that the frequency of daily con-sumption of fruits and vegetables among the Bra-zilian adult population is around 41% and 30%, respectively, with a higher consumption found in the higher socioeconomic groups. According to data from the Household Budget Survey and VIGITEL7,23 low consumption of fruits and veg-etables have become a recurring phenomenon in Brazil and in Latin-American countries44.
Several epidemiological studies have shown that consumption of fruits and vegetables may be associated with lower incidence and mortal-ity related to chronic non-communicable
diseas-es45,46. In this study, the prevalence in the regular
Sil
va D
the prevalence of consumption is higher among young adults and low educational levels10.
A baseline study conducted in Anchieta, Bra-zil, to determine the prevalence of risk and pro-tective factors for NCDs through a household survey detected a high prevalence in the con-sumption of meat with visible fat, low prevalence of physical activity during leisure time and con-sumption of ive servings of fruits and vegetables on ive or more days of the week27. These results show that the observed risk factors indicate sim-ilar favorable conditions for the rise of NCDs in the group investigated by this study, requiring an intervention by the municipality to modify these factors which are preventable. A comparison with the study of Sousa et al.42 on students from the State University of Santa Cruz, BA, shows similar scenarios between the populations, which is characterized by inadequate consumption of fruits and vegetables, lower levels of physical ac-tivity at leisure and excessive alcohol consump-tion and smoking.
The implementation of small cities in uni-versities promotes the economic, cultural and urban education development, the part of the population, however, can modify the different determinants of risk and protection for chronic diseases. Therefore, the adoption of integrated and sustainable actions to reduce the prevalence of risk factors associated with chronic diseases is critical to the development of effective strategies to promote the health of the population.
As a limiting factor of this study, there is the possible occurrence of recall bias on respondents’ answers relating to months prior to the applica-tion of the quesapplica-tionnaire, which can underesti-mate the prevalence of some factors evaluated, as the prevalence of abusive consumption of alco-hol. It is noteworthy that the use of eating mark-ers recommended by the VIGITEL may appear different when comparing with the publication of the Food Guide for the Brazilian population, which recommended the preferential consump-tion of food raw or minimally processed as healthy consumption markers. However, con-sumer indicators discussed in this work have sat-isfactory validity and reliability, tested in previ-ous studies47,48, showing they can be used.
Conclusion
The prevalence of consumption of fruits, veg-etables and beans was high, however, there was a prevalence of risk factors for the development of chronic diseases, including high prevalence of abusive consumption of alcohol, habit of con-suming whole milk and eating meat with visi-ble fat, regular consumption of soft drinks and physical inactivity. It is of utmost importance to disseminate these indings to health professionals and the general public, aiming at better planning of programs for the prevention and reduction of such diseases in this municipality.
Collaborations
aúd
e C
ole
tiv
a,
22(12):4041-4050,
2017
References
1. Alexandre VP, Peixoto MRG, Schmitz BAS, Moura EC. Fatores associados às práticas alimentares da popula-ção adulta de Goiânia, Goiás, Brasil. Rev bras epide-miol 2014; 17(1):267-280.
2. Jaime PC, Figueiredo ICR, Moura EC, Malta DC. Fa-tores associados ao consumo de frutas e hortaliças no Brasil, 2006. Rev Saude Publica 2009; 43(Supl. 2):57-64. 3. Moura EC, Silva SA, Malta DC, Morais Neto OL. Fato-res de risco e proteção para doenças crônicas: vigilân-cia por meio de inquérito telefônico, VIGITEL, Brasil, 2007. Cad Saude Publica 2011; 27(3):486-496. 4. World Health Organization (WHO). Diet, nutrition
and prevention of chronic diseases. Report of a Joint WHO/FAO Expert Consultation. Geneva: WHO; 2003. (WHO Technical Report Series 916).
5. Oliveira-Campos M, Rodrigues-Neto JF, Silveira MF, Neves DMR, Vilhena JM, Oliveira JF, Magalhães JC, Drumond D. Impacto dos fatores de risco para doenças crônicas não transmissíveis na qualidade de vida. Cien Saude Colet 2013; 18(3):873-882.
6. Malta DC, Morais Neto OL, Silva JB. Plano de ações estratégicas para enfrentamento das doenças crônicas não transmissíveis (DCNT) no Brasil: 2011-2022. Epi-demiol Serv Saude 2011; 20(4):425-438.
7. Instituto Brasileiro de Geograia e Estatística (IBGE).
Pesquisa de orçamentos familiares 2008-2009: Análise do consumo alimentar pessoal no Brasil. Rio de Janeiro: IBGE; 2011.
8. Brunori EHFR, Cavalcante AMRZ, Lopes CT, Lopes JL, Barros ALBL. Tabagismo, consumo de álcool e ativida-de física: associações na síndrome coronariana aguda.
Acta Paul Enferm 2014; 27(2):165-172.
9. Longo GZ, Neves J, Castro TG, Pedroso, MRO, Matos IB. Prevalência e distribuição dos fatores de risco para doenças crônicas não transmissíveis entre adultos da cidade de Lages (SC), sul do Brasil, 2007. Rev bras epi-demiol 2011; 14(4):698-708.
10. Brasil. Ministério da Saúde (MS). Secretaria de Vigilân-cia em Saúde. Vigitel Brasil 2014: Vigilância de fatores de risco e proteção para doenças crônicas por inquérito telefônico. Brasília: MS; 2015.
11. World Health Organization (WHO). Global strategy on diet, physical activity and health. Geneva: WHO; 2004. (Fifty-Seventh World Health Assembly WHA 57.17). 12. Brasil. Ministério da Saúde (MS). Secretaria de
Vigilân-cia em Saúde. Departamento de Análise de Situação de Saúde. Plano de Ações Estratégicas para o Enfrentamento das Doenças Crônicas Não Transmissíveis (DCNT) no Brasil 2011-2022. Brasília: MS; 2011.
13. Brasil. Ministério da saúde (MS). Secretaria de atenção à saúde. Departamento de Atenção Básica. Guia ali-mentar para a população brasileira. 2ª ed. Brasília: MS; 2014.
14. Lopes ACS, Caiaffa WT, Sichieri R, Mingoti SA, Lima-Costa MF. Consumo de nutrientes em adultos e idosos em estudo de base populacional: projeto Bambuí. Cad Saude Publica 2005; 21(4):1201-1209.
15. Marrero SL, Bloom DE, Adashi EY. Noncommunicable diseases. A global health crisis in a new world order. J Am Med Assoc 2012; 307(19):2037-2038.
16. Instituto Brasileiro de Geograia e Estatística (IBGE). Censo Demográico 2010. Características da população e dos domicílios. Rio de Janeiro: IBGE; 2010.
17. Dean AG, Dean JA, Colombier D, Brendel KA, Smith DC, Burton AH, Dicker RC, Sullivan K, Fagan RF, Arner TG. Epi Info, version 6: a word processing, data-base, and statistics program for epidemiology on micro-computers. Atlanta: Centers for Disease Control and Prevention; 1994.
18. Associação Brasileira de Empresas de Pesquisa (ABEP).
Critério de classificação econômica Brasil. [Internet]. [acessado 2013 Dez 10].Disponível em: http://www. abep.org/codigosguias/CCEB2012.
19. Menezes AMB, Victora CG, Perez-Padilla R. The Pla-tino project: methodology of a multicenter prevalence survey of chronic obstructive pulmonary disease in major latinamerican cities. BMC Med Res Methodol
2004; 4(15):1-17.
20. Pardini R, Matsudo SM, Araújo T, Matsudo V, Andra-de E, Braggion G, AndraAndra-de D, Oliveira L, Figueira Jr A, Raso V. Validação do questionário internacional de nível de atividade física (IPAQ - versão 6): estudo pilo-to em adulpilo-tos jovens brasileiros. Rev Bras Ciên e Mov
2001; 9(3):45-51.
21. Haskell WL, Lee IM, Pate RR, Powell KE, Blair SN, Franklin BA, Macera CA, Heath GW, Thompson PD, Bauman A. Physical Activity and Public Health: Up-dated Recommendation for Adults from the American College of Sports Medicine and the American Heart Association. Med Sci Sport Exer 2007; 39(8):1423-1434. 22. Furlan-Viebig R, Pastor-Valero M. Desenvolvimento de um questionário de frequência alimentar para o estudo de dieta e doenças não transmissíveis. Rev Saude Publi-ca 2004; 38(4):581-584.
23. Brasil. Ministério da Saúde (MS). Secretaria de Vigi-lância em Saúde. Vigitel Brasil 2012: Vigitel Brasil 2011: Vigilância de fatores de risco e proteção para doenças crô-nicas por inquérito telefônico.Brasília: MS; 2012. 24. Instituto Nacional de Câncer (INCA). Inquérito
domi-ciliar sobre comportamentos de risco e morbidade refe-rida de doenças e agravos não transmissíveis: Brasil, 15 capitais e Distrito Federal, 2002-2003. Rio de Janeiro: INCA; 2004.
25. Borges MC, Santos LP, Zago AM, Silva BG, Silva SG, Mola CL. Socioeconomic development of cities and risk factors for non-communicable diseases: a compar-ative study across Brazilian state capitals. J Public Heal-th 2016; 38(4):653-359.
26. Moodie R, Stuckler D, Monteiro C, Sheron N, Neal B, Thamarangsi T, Lincoln P, Casswell S. Proits and pandemics: prevention of harmful effects of tobacco, alcohol, and ultra-processed food and drink industries.
Lancet 2013; 381(9867):670-679.
27. Yokota RTC, Iser BPM, Andrade RLM, Santos J, Mei-ners MMMA, Assis DM, Bernal RTI, Malta DC, Moura L. Vigilância de fatores de risco e proteção para doen-ças e agravos não transmissíveis em município de pe-queno porte, Brasil, 2010. Epidemiol Serv Saude 2012; 21(1):55-68.
Sil
va D
29. Malta DC, Iser BPM, Sá NNB, YokotaRTC, MouraL, ClaroRM, LuzMGC, Bernal RIT. Tendências temporais no consumo de tabaco nas capitais brasileiras, segun-do dasegun-dos segun-do VIGITEL, 2006 a 2011. Cad Saude Publica
2013; 29(4):812-822.
30. Mielke GI, Hallal PC, Rodrigues GBA, Szwarcwald CL, Santos FV, Malta DC. Prática de atividade física e hábi-to de assistir à televisão entre adulhábi-tos no Brasil: Pesqui-sa Nacional de Saúde 2013. Epidemiol Serv Saude 2015; 24(2):277-286.
31. Hallal PC, Dumith SC, Bastos JP, Reichert FF, Siqueira FV, Azevedo MR. Evolução da pesquisa epidemiológica em atividade física no Brasil: revisão sistemática. Rev Saude Publica 2007; 41(3):453-460.
32. Rombaldi AJ, Silva MC, Neutzling MB, Azevedo MR, Hallal PC. Fatores associados ao consumo de dietas ri-cas em gordura em adultos de uma cidade no sul do Brasil. Cien Saude Colet 2014; 19(5):1513-1521. 33. Laranjeira R, Pinsky I, Zaleski M, Caetano R. I
Levan-tamento Nacional sobre os padrões de consumo de álcool na população brasileira. Brasília: Secretaria Nacional Antidrogas; 2007.
34. Cibeira GH, Muller C, Lazzaretti R, Nader GA, Calefi M. Consumo de bebida alcoólica, fatores socioeconô-micos e excesso de peso: um estudo transversal no sul do Brasil. Cien Saude Colet 2013; 18(12):3577-3584. 35. Brasil. Ministério da Saúde (MS). Guia alimentar para
a população brasileira: promovendo a alimentação sau-dável. Brasília: MS; 2006.
36. García-Arenzana N, Navarrete-Muñoz EM, Lope V, Moreo P, Vidal C, Laso-Pablos S., Ascunce N, Casa-nova-Gómez F, Sánchez-Contador C, Santamariña C, Aragonés N, Gómez BP, Vioque J, Pollán M. Calorie intake, olive oil consumption and mammographic density among Spanish women. Int J Cancer 2014; 134(8):1916-1925.
37. Austin GL, Ogden LG, Hill JO. Trends in carbohydrate, fat, and protein intakes and association with energy in-take in normal-weight, overweight, and obese individ-uals: 1971-2006. Am J Clin Nutr 2011; 93(4):836-843. 38. Pot GK, Prynne CJ, Roberts C, Olson A, Nicholson SK,
Whitton C, Teucher B, Bates B, Henderson H, Pigott S, Swan G, Stephen AM. National diet and nutrition survey: fat and fatty acid intake from the irst year of the rolling programme and comparison with previous surveys. Br J Nutr 2011; 107(3):405-415.
39. Monteiro CA, Moura EC, Jaime PC, Claro RM. Valida-de Valida-de indicadores do consumo Valida-de alimentos e bebidas obtidos por inquérito telefônico. Rev Saude Publica
2008; 42(4):582-589.
40. Levy-Costa RB, Sichieri R, Pontes NS, Monteiro CA. Disponibilidade domiciliar de alimentos no Brasil: dis-tribuição e evolução (1974-2003). Rev Saude Publica
2005; 39(4):530-540.
41. Marcondelli P, Costa THM, Schmitz BAS. Nível de atividade física e hábitos alimentares de universitários do 3º ao 5º semestres da área da saúde. Rev Nutr 2008; 21(1):39-47.
42. Sousa TF, José HM, Barbosa AR. Condutas negativas à saúde em estudantes universitários brasileiros. Cien Saude Colet 2013; 18(12):3563-3575.
43. Jaime PC, Monteiro CA. Fruit and vegetable in take by Brazilian adults, 2003. Cad Saude Publica 2005; 21(Supl. 1):S19-S24.
44. Finucane MM, Stevens GA, Cowan MJ, Danaei G, Lin JK, Paciorek CJ, Singh GM, Gutierrez HR, Lu Y, Baha-lim AN, Farzadfar F, Riley LM, Ezzati M; Global Burden of Metabolic Risk Factors of Chronic Diseases Collab-orating Group (Body Mass Index). National, region-al, and global trends in body-mass index since 1980: systematic analysis of health examination surveys and epidemiological studies with 960 country-years and 9.1 million participants. Lancet 2011; 377(9765):557-567. 45. Bazzano LA. The high cost of not consuming fruits and
vegetables. J Am Diet Assoc 2006; 106(9):1364-1368. 46. Genkinger JM, Platz EA, Hoffman SC, Comstock GW,
Helzlsouer KJ. Fruit, vegetable, and antioxidant in-take and all-cause, cancer, and cardiovascular disease mortality in a community-dwelling population in Washington County, Maryland. Am J Epidemiol 2004; 160(12):1223-1233.
47. Mendes LL, Campos SF, Malta DC, Bernal RTI, Sá NNBD, Velásquez-Meléndez G. Validade e reprodutibi-lidade de marcadores do consumo de alimentos e bebi-das de um inquérito telefônico realizado na cidade de Belo Horizonte (MG), Brasil. Rev Bras Epidemiol 2011; 14(Supl. 1):80-89.
48. Monteiro CA, Moura EC, Jaime PC, Claro RM. Valida-de Valida-de indicadores do consumo Valida-de alimentos e bebidas obtidos por inquérito telefônico. Rev Saude Publica
2008; 42(4):582-589.
Artigo apresentado em 13/12/2015 Aprovado em 03/04/2016