online | memorias.ioc.fiocruz.br
Effect of vegetation on cutaneous leishmaniasis in Paraná, Brazil
Helen Aline Melo1/+, Diogo Francisco Rossoni2, Ueslei Teodoro1
1Universidade Estadual de Maringá, Programa de Pós-Graduação em Ciências da Saúde, Maringá, PR, Brasil 2Universidade Estadual de Maringá, Departamento de Estatística, Maringá, PR, Brasil
BACKGROUND Cutaneous leishmaniasis (CL) is endemic in the state of Paraná, Brazil.
OBJECTIVE This study aimed at analysing the influence of the remaining native vegetation on the prevalence of CL in Paraná.
METHODS Global testing was used for spatial autocorrelation along with simultaneous autoregressive model (SAR). The regression was based on the CL coefficient (cases/100,000 inhabitants) as a function of the percentage of natural vegetation cover, altitude, total number of cases, and spatial density (SD) per km2; the location data of the Paraná state municipalities and the detection coefficient (DC) (cases/100,000 inhabitants) of autochthonous cases of CL were obtained from the SINAN in 2012 and 2016. Data on the remaining forests were collected from the Fundação SOS Mata Atlântica and Instituto Nacional de Pesquisas Espaciais.
FINDINGS The spatial regression of DC revealed statistical significance for SD (Z = 24.1359, p < 0.05, 2012-2013; Z = 24.0817, p < 0.05, 2013-2014; Z = 33.4824, p < 0.05, 2014-2015; and Z = 27.1515, p < 0.05, 2015-2016.
CONCLUSIONS CL cases are reported in areas with native vegetation, such as in riparian forests. However, vegetation is not the only variable that influences the incidence of CL.
Key words: cutaneous leishmaniasis - zoonoses - environmental health - spatial analysis - spatial regression
doi: 10.1590/0074-02760170505
+ Corresponding author: [email protected] Received 17 November 2017
Accepted 13 April 2018
The prevalence of cutaneous leishmaniasis (CL) is reported in 97 countries, including America and those in Europe, Africa, and Asia, with 0.7-1.3 million new cases registered annually (WHO 2017). This disease is one of the six most severe infectious diseases worldwide due to its high detection coefficient (DC) and capabil-ity to cause deformations in patients (MS 2016). In Bra-zil, from 1993 to 2016, the annual average number of CL cases was 22,140, with a DC of 9.8 cases/100,000 inhabitants (MS 2016). CL is endemic in Brazil. In the early 1980s, autochthon cases were reported in 19 states. Moreover, in 2003, there are registered cases in every state of the country (MS 2016).
According to Luz et al. (2000), between 1930 and 1950, CL reached epidemic proportions to the north of Paraná during the colonisation period due to the re-placement of native vegetation with coffee plantations. In the 1950s, the incidence of this zoonotic disease rap-idly decreased due to the indirect effect of the malaria control campaigns about chlorinated insecticides (Luz et al. 2000). However, since 1980, CL has been endemic in Paraná (Lima et al. 2002). From 1980 to 2016, 16,464 cases were reported in the northern, western, and south-western parts of the state (MS 2017).
In the state of Paraná, the natural life cycle of Leish-mania is significantly associated with the natural forest areas that are close to the traditional agricultural produc-tion areas. The number of CL cases is highest in areas located in the basins of the Ivaí and Pirapó rivers, where there are native residual forests (Lima et al. 2002,
Mon-teiro et al. 2008, MonMon-teiro et al. 2009) as well as in the urban areas of Maringá (Teodoro et al. 1998, Lima et al. 2002) and Cianorte (Lima et al. 2002). Despite the sub-stitution of native forest vegetation for coffee, soybean, corn, cotton, and pasture crops, the persistent incidence of CL in Paraná is the result of the successful adaptation of the vectors and reservoirs of parasites in the areas af-fected by human activities (Lima et al. 2002).
Data on the occupation of agrarian and urban spaces, vegetation cover, and the geographical distribution of CL allow the formulation of hypotheses and the planning of health services that control CL, particularly its vector (King et al. 2004, Monteiro et al. 2008). Therefore, the factors that influence the geographical distribution of CL were used in our statistical analysis using georeferencing, which will be extremely valuable in the planning of health initiatives (Medronho et al. 2003, Eisen and Eisen 2008, Magalhães 2012). The present study aimed at evaluating the associa-tion between CL and residual native vegetaassocia-tion, which is considered a risk factor for the prevalence of the disease, in the state of Paraná. Statistical analysis using georeferencing was carried out to assess this association.
MATERIALS AND METHODS
Description of the state of Paraná - The state of Paraná is in southern Brazil (22º30’58” and 28º43’00” S; 48º05’37” and 54º37’08” W), with an area of 199,307.945 km2. It has 399 municipalities that are distributed across
than 18ºC. Second, the humid subtropical climate (meso-thermal, Cfa), which is the most common type of climate in the state, has an average temperature of 22ºC and can reach up to 40ºC in the North, Central-West, and the Ri-beira River Valley regions during their warmest months. Meanwhile, its lowest average temperature is 18ºC. Final-ly, the temperature oceanic climate (mesothermal, Cfb) has an average temperature of 18-22ºC (IAPAR 2002).
Data collection - To analyse the influence of native vegetation on autochthonous cases of CL in the state of Paraná, data were obtained from the Sistema de Infor-mação de Agravos de Notificação (SINAN; Informa-tion System for Notifiable Diseases) from January 2012 to December 2016. For the DC (autochthonous cases per 100,000 inhabitants), spatial density (SD) (cases per km2), altitude, and territorial area, the population and
ter-ritorial data of each municipality were used based on the Instituto Brasileiro de Geografia e Estatística (Brazilian Institute for Geography and Statistics; IBGE 2010, IBGE 2016). Moreover, data on the residual native vegetation, river basins, and phytogeographical regions were provid-ed by Fundação SOS Mata Atlântica (SOS Mata Atlântica Foundation) and Instituto Nacional de Pesquisas Espaci-ais (National Institute of Space Research, INPE; SOSMA 2017). Information on gender, age, clinical form, and the proportion of patients with CL who were cured was col-lected. In the present study, we focused on municipalities
with SD values ≥ 0.010, which were considered as
high-risk areas for disease transmission.
Geographical and statistical analyses - Geographi-cal analysis was performed using the simultaneous au-toregressive model (SAR) model (Bivandet al. 2008) that calculates the regression of values from several areas to model spatial dependence. Regression was based on the coefficient of the detection of CL (cases/100,000
inhabit-Fig. 1: distribution of cutaneous leishmaniosis cases in terms of detection coefficient (cases per 100,000 inhabitants) in the state of Paraná, Brazil, from 2012 to 2016.
TABLE I
Demographic and clinical characteristics of cutaneous leishmaniasis (CL) cases in the state of Paraná, Brazil, from 2012 to 2016 obtained using the chi-squared test
Characteristics of the participants n % p-value
Sex < 0.001
Male 1,187 74.19
Female 413 25.81
Age group (years) < 0.001
> 1 10 0.63
1-4 8 0.50
5-9 32 2.00
10-14 54 3.38
15-19 86 5.38
20-39 500 31.25
40-59 561 35.06
60-64 106 6.63
65-69 102 6.38
70-79 107 6.69
≥ 80 34 2.13
Clinical form < 0.001
Cutaneous 1,445 90.31
Mucocutaneous 154 9.61
Not informed 1 0.06
Case outcome < 0.001
Clinical cure 1,029 64.31
Abandonment of treatment 17 1.06
Death related to CL 5 0.31
Death from other causes 26 1.63
Transfer 14 0.88
Change of diagnosis 2 1.44
Data on the native vegetation in the state of Paraná from 2012 to 2016 revealed that only 11.6% of the origi-nal vegetation cover remains (Figs 2-3). Spatial regres-sion of DC revealed statistical significance only for SD (cases per km2) (Z = 24.1359, p < 0.05, 2012-2013; Z =
24.0817, p < 0.05, 2013-2014; Z = 33.4824, p < 0.05, 2014-2015; and Z = 27.1515, p < 0.05, 2015-2016) and the total number of cases (Z = 2.1146, p < 0.05, 2015-2016). Mean-while, the values of other variables were as follows: for altitude, Z = -0.4840, p > 0.05, 2012-2013; Z = -0.9054, p > 0.05, 2013-2014; Z = -1.5980, p > 0.05, 2014-2015; Z = -1.6127, p > 0.05, 2015-2016; for the total number of cases, Z = -1.2357, p > 0.05, 2012-2013; Z = 1.1118, p > 0.05, 2013-2014; Z = 0.1938, p > 0.05, 2014-2015.
DISCUSSION
Despite the significance of CL based on the expres-sive number of cases reported annually and its occur-rence in all the states of Brazil, this disease continues to be neglected (Monteiroet al. 2008, MS 2016). More-over, regardless of the increasing number of human in-terventions, the natural foci of CL are still found in rural and urban areas during the recent and past colonization (Lima et al. 2002, MS 2016).
Based on the regression analysis, a statistically sig-nificant difference (p < 0.05) was observed in terms of the SD of Ivatuba, Cianorte, Corumbataí do Sul, Dou-tor Camargo, Japurá, Jussara, Lunardelli, Mandaguaçu, Maringá, Moreira Sale, Paraíso do Norte, São Tomé, Terra Boa, Tuneiras do Oeste, and Umuarama, all of which are located in the CL generation hub, referred to as Ivaí-Pirapó hub by Monteiro et al. (2009). The semi-deciduous forest areas in these municipalities are rep-resented by the fragments of natural vegetation cover ants) as a function of the percentage of natural
vegeta-tion, altitude, the total number of cases, and SD (cases per km2). This result shows that the error is modeled based on
its dependence on other errors. It is defined as
where bij represents the values of spatial dependence between the areas and ɛi represents the residual error that is considered independent and identically distributed ac-cording to normal with zero mean and constant variance. All statistical analyses were performed with R soft-ware (environment), with 95% confidence interval (CI). The collinearity between variables was evaluated, and the variables that were unstable were not used in the study (Development Core Team 2014).
RESULTS
From 2012 to 2016, there were 1600 (54.39%) reported cases of CL across 217 municipalities in the state of Paraná (Fig. 1, Table I). Among these, 8 (3.69%), 37 (17.05%), 102
(47.00%), and 70 (32.26%) municipalities had a DC of ≥ 71.0, ≥ 10.0 < 71.0, ≥ 2.5 < 10.0, and < 2.5, respectively. The
following municipalities had the highest number of cases: Cianorte, Umuarama, Londrina, Jussara, Cerro Azul, and Maringá. Approximately 30.13% of CL cases were report-ed in these municipalities in 2012 and 2016. The following municipalities had the highest DC: Ivatuba, Jussara, São Jorge do Ivaí, Adrianópolis, Doutor Camargo, and Japurá
(Table II), whereas 39 other municipalities had a DC ≥
10.0, which include areas with high or extremely high CL transmission potential. Based on the analysis, municipali-ties, such as Ivatuba, Jussara, Japurá, Doutor Camargo, and Cianorte, had a significant SD (Table II).
ei =
Ʃ
bijei + ɛi ,m
i=1
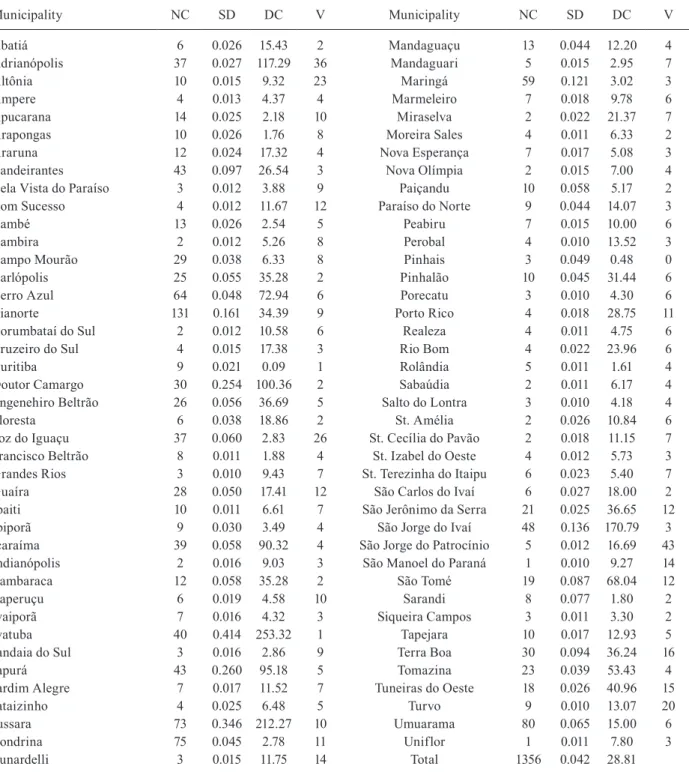
TABLE II
Number, spatial density (SD), and detection coefficient (DC) of cutaneous leishmaniasis (CL) cases as well as natural
vegetation covers in the municipalities with SD ≥ 0.010 in the state of Paraná, Brazil, from 2012 to 2016
Municipality NC SD DC V Municipality NC SD DC V
Abatiá 6 0.026 15.43 2 Mandaguaçu 13 0.044 12.20 4
Adrianópolis 37 0.027 117.29 36 Mandaguari 5 0.015 2.95 7
Altônia 10 0.015 9.32 23 Maringá 59 0.121 3.02 3
Âmpere 4 0.013 4.37 4 Marmeleiro 7 0.018 9.78 6
Apucarana 14 0.025 2.18 10 Miraselva 2 0.022 21.37 7
Arapongas 10 0.026 1.76 8 Moreira Sales 4 0.011 6.33 2
Araruna 12 0.024 17.32 4 Nova Esperança 7 0.017 5.08 3
Bandeirantes 43 0.097 26.54 3 Nova Olímpia 2 0.015 7.00 4
Bela Vista do Paraíso 3 0.012 3.88 9 Paiçandu 10 0.058 5.17 2
Bom Sucesso 4 0.012 11.67 12 Paraíso do Norte 9 0.044 14.07 3
Cambé 13 0.026 2.54 5 Peabiru 7 0.015 10.00 6
Cambira 2 0.012 5.26 8 Perobal 4 0.010 13.52 3
Campo Mourão 29 0.038 6.33 8 Pinhais 3 0.049 0.48 0
Carlópolis 25 0.055 35.28 2 Pinhalão 10 0.045 31.44 6
Cerro Azul 64 0.048 72.94 6 Porecatu 3 0.010 4.30 6
Cianorte 131 0.161 34.39 9 Porto Rico 4 0.018 28.75 11
Corumbataí do Sul 2 0.012 10.58 6 Realeza 4 0.011 4.75 6
Cruzeiro do Sul 4 0.015 17.38 3 Rio Bom 4 0.022 23.96 6
Curitiba 9 0.021 0.09 1 Rolândia 5 0.011 1.61 4
Doutor Camargo 30 0.254 100.36 2 Sabaúdia 2 0.011 6.17 4
Engenehiro Beltrão 26 0.056 36.69 5 Salto do Lontra 3 0.010 4.18 4
Floresta 6 0.038 18.86 2 St. Amélia 2 0.026 10.84 6
Foz do Iguaçu 37 0.060 2.83 26 St. Cecília do Pavão 2 0.018 11.15 7
Francisco Beltrão 8 0.011 1.88 4 St. Izabel do Oeste 4 0.012 5.73 3
Grandes Rios 3 0.010 9.43 7 St. Terezinha do Itaipu 6 0.023 5.40 7
Guaíra 28 0.050 17.41 12 São Carlos do Ivaí 6 0.027 18.00 2
Ibaiti 10 0.011 6.61 7 São Jerônimo da Serra 21 0.025 36.65 12
Ibiporã 9 0.030 3.49 4 São Jorge do Ivaí 48 0.136 170.79 3
Icaraíma 39 0.058 90.32 4 São Jorge do Patrocínio 5 0.012 16.69 43
Indianópolis 2 0.016 9.03 3 São Manoel do Paraná 1 0.010 9.27 14
Itambaraca 12 0.058 35.28 2 São Tomé 19 0.087 68.04 12
Itaperuçu 6 0.019 4.58 10 Sarandi 8 0.077 1.80 2
Ivaiporã 7 0.016 4.32 3 Siqueira Campos 3 0.011 3.30 2
Ivatuba 40 0.414 253.32 1 Tapejara 10 0.017 12.93 5
Jandaia do Sul 3 0.016 2.86 9 Terra Boa 30 0.094 36.24 16
Japurá 43 0.260 95.18 5 Tomazina 23 0.039 53.43 4
Jardim Alegre 7 0.017 11.52 7 Tuneiras do Oeste 18 0.026 40.96 15
Jataizinho 4 0.025 6.48 5 Turvo 9 0.010 13.07 20
Jussara 73 0.346 212.27 10 Umuarama 80 0.065 15.00 6
Londrina 75 0.045 2.78 11 Uniflor 1 0.011 7.80 3
Lunardelli 3 0.015 11.75 14 Total 1356 0.042 28.81
NC: number of cases; V: natural vegetation covers (%).
that is moderately or severely altered (Limaet al. 2002, Monteiroet al. 2008, Monteiroet al. 2009). No statistical significance (p > 0.05) was observed in terms of the veg-etation factor per km2 and the percentage. Table II shows
that Adrianópolis has 36% residual vegetation, with a high DC (117.29), whereas the municipality of Jussara
has only 10%, with a high DC (212.27). Therefore, the life cycle of Leishmania is maintained regardless of the vegetation area in both the municipalities.
Cinzas-Fig. 3: residual vegetation cover in the state of Paraná from 2012 to 2013 (A) and from 2015 to 2016 (B) (SOSMA 2017).
Laranjinha CL hub, in terms of SD data (p < 0.05) and natural vegetation cover (percentage and km2) (p > 0.05),
these municipalities are located in the hydrography cor-ridors of areas that are covered with semi-deciduous for-est remnants, with conditions suitable for the transmission of Leishmania (Monteiro et al. 2009). The riparian forests are considered by the Brazilian Forest Code as a perma-nent preservation area, with several environmental func-tions and must respect an extension according to a river, lake, dam, or spring width. When damaged, the landown-ers must immediately restore the area. The situation is similar to that in the Tibagi hub, which includes the mu-nicipalities of Londrina and São Gerônimo da Serra, and a statistically significant difference was observed among these municipalities in term of SD data (p < 0.05) and nat-ural vegetation cover factor (p > 0.05) (percentage).
In the Alto Ribeira hub, the municipalities of Adri-anópolis and Cerro Azul, where the hydrography corri-dors exist, had statistically significant SD data (p < 0.05) and vegetation factor (p > 0.05) (per km2 and
percent-age). These corridors are covered by the Atlantic forest,
which allows the coexistence of Leishmania, vectors, and reservoirs. The life cycle of Leishmania is main-tained irrespective of the size of the natural vegetation that covers of the municipalities.
Although the municipalities with SD < 0.010 are not shown in Table II, all municipalities contribute in estab-lishing the Paraná-Paranapanema and Ribeira circuits.
In the areas of the state of Paraná where the native vegetation was replaced by coffee crops in the 1930s and 1950s as well as by soy, maize, or pasture crops more re-cently (Lima et al. 2002, Monteiro et al. 2008, Monteiro et al. 2009), domestic and wild animal infection due to
environmental and climatic variables may influence CL incidence over the time variables investigated at Santa Catarina. However, these variables cannot be identified using the methodology used in the present study.
The SINAN data used in the georeferencing provided a broad coverage of the population in 399 municipalities in the state, which facilitates the future continuity of the longitudinal study of CL epidemiology in Paraná, to assist with the health surveillance. The professionals who par-ticipated in the surveillance must be trained to improve the completeness of the SINAN data because errors were still observed during the completion of the notification forms. However, the georeferencing instruments must be cautiously used because the enforcement of variables alone and other computational models, without consider-ing the local factors that affect the exposed population and their habitat, and the association between them, can cause technicians, managers, and researchers to obtain inaccu-rate results in case of multifactorial diseases (particularly CL) (Lovelock 2010). Therefore, other local factors, such as the influence of the work of individuals in agrarian and urban spaces, migratory behavior, and vegetation cover, that may influence the risk factors for CL occurrence must be investigated. These factors can determine spatial distribution, thus contributing to the occurrence of this disease in endemic areas (Monteiroet al. 2009).
In conclusion - Due to the significant association be-tween vegetation areas and the ecology of vectors and reservoirs of CL, these areas have a significant influence on the prevalence of the disease. Thus, concentration of LT cases are commonly reported in the production hubs of this disease, which are areas with native vegetation, such as riparian forests. However, vegetation is not the only factor that influences the incidence of CL. Other factors, such as temperature, rainfall, and floating popu-lation, may also affect the prevalence of the disease.
AUTHORS’ CONTRIBUTION
HAM and UE formulated the study and wrote the manu-script; DFR contributed to the statistical analyses. All authors read and approved the final manuscript.
REFERENCES
Bivand RS, Pebesma E, Gómez-Rubio V. Applied spatial data Analy-sis with R. 1. New York: Springer-Verlag New York; 2008.
Cella W, Melo SCCSD, Legriffon CMDO, Freitas JSD, Kuhl JB, Teo-doro U, et al. Sandflies in rural localities in northwest Paraná state, Brazil. Cad Saude Publica. 2011; 27(12): 2461-68.
Cruz CFR, Cruz MFR, Galati EAB. Sandflies (Diptera: Psychodidae) in rural and urban environments in an endemic area of cutaneous leishmaniasis in southern Brazil. Mem Inst Oswaldo Cruz. 2013; 108(3): 303-11.
Development Core Team. R: a language and environment for statisti-cal computing. 2014.
Eisen RJ, Eisen L. Spatial modeling of human risk of exposure to vec-tor-borne pathogens based on epidemiological versus arthropod vector data. J Med Entomol. 2008; 45(2): 181-92.
IAPAR – Instituto Agronômico do Paraná. Cartas climáticas do Paraná. 2002. Available from: http://www.iapar.br/modules/con-teudo/conteudo.php?conteudo=677.
IBGE - Instituto Brasileiro de Geografia e Estatística. Censo De-mográfico. 2010. [Internet]; cited 2016, March 01. Available from: http://www.ibge.gov.br/estadosat/perfil.php?sigla=pr.
IBGE - Instituto Brasileiro de Geografia e Estatística. Estimativas populacionais. [Internet]; cited 2016, March 01. Available from: http://www.ibge.gov.br/estadosat/perfil.php?sigla=pr.
King RJ, Campbell-Lendrum DH, Davies CR. Predicting geograph-ic variation in cutaneous leishmaniasis, Colombia. Emerg Infect
Dis. 2004; 10(4): 598-607.
Lima AP, Minelli L, Teodoro U, Comunello E. Tegumentary leishma-niasis distribution by satellite remote sensing imagery, in Paraná state, Brazil. An Bras Dermatol. 2002; 77(7): 681-92.
Lonardoni MVC, Silveira TGV, Alves WA, Maia-Elkhoury ANS, Membrive UA, Membrive NA, et al. Human and canine Ameri-can cutaneous leishmaniasis in Mariluz, Paraná state, Brazil. Cad Saude Publica. 2006; 22(12): 2713-16.
Lovelock J. Gaia: alerta final. Rio de Janeiro: Intrínseca; 2010. 264 pp.
Luz E, Membrive N, Castro EA, Dereure J, Pratlong F, Dedet JA, et al.
Lutzomyia whitmani (Diptera: Psychodidae) as vector of Leish-mania (V.) braziliensis in Parana state, southern Brazil. Ann Trop Med Parasitol. 2000; 94(6): 623-31.
Maack R. Geografia física do estado do Paraná. Curitiba: Banco de Desenvolvimento do Paraná; 1968.
Magalhães GBO. The use of geoprocessing and statistic in ecological studies of epidemiology: the case of dengue in 2008 in the metro-politan area of Fortaleza. Hygeia. 2012; 8(15): 63-77.
Marlow MA, da Silva MM, Makowiecky ME, Eger I, Rossetto AL, Grisard EC, et al. Divergent profile of emerging cutaneous leish-maniasis in subtropical Brazil: new endemic areas in the southern frontier. PLoS One. 2013; 8(2): e56177.
Massafera R, Silva AM, Carvalho AP, Santos DR, Galati EAB, Teo-doro U. Phlebotomine sandflies of southern Brazil. Rev Saude Publica. 2005; 39(4): 571-7.
Medronho RDA, Valencia LIO, Fortes BDPMD, Braga RCC, Ribeiro SDV. Spatial analysis of hepatitis A seroprevalence in children of a poor region of Duque de Caxias, Rio de Janeiro, Brazil. Rev Bras Epidemiol. 2003; 6(4): 328-34.
Membrive NA, Rodrigues G, Gualda KP, Bernal MVZ, Oliveira DM, Lo-nardoni MVC, et al. Environmental and animal characteristics as fac-tors associated with American cutaneous leishmaniasis in rural loca-tions with presence of dogs, Brazil. PLoS One. 2012; 7(11): e47050.
Monteiro WM, Neitzke HC, Lonardoni MVC, Silveira TGV, Ferreira MEMC, Teodoro U. Geographic distribution and epidemiologi-cal features of American tegumentary leishmaniasis in old rural settlements in Paraná state, southern Brazil. Cad Saude Publica. 2008; 24(6): 1291-303.
Monteiro WM, Neitzke HC, Silveira TGV, Lonardoni MVC, Teodoro U, Ferreira MEMC. Poles of American tegumentary leishmania-sis production in northern Paraná state, Brazil. Cad Saude Publi-ca. 2009; 25(5): 1083-92.
MS - Ministério da Saúde. Guia de vigilância em saúde. 2016. Avail-able from: http://portalarquivos2.saude.gov.br/images/pdf/2016/ agosto/25/GVS-online.pdf.
MS - Ministério da Saúde. Leishmaniose tegumentar americana - dis-tribuição de casos confirmados de LTA de 1980 a 2005. [Internet]; cited 2017, January 15. Available from: https://goo.gl/m1tzTz.
Teodoro U, Kühl JB, Rodrigues M, Santos ES, Santos DR, Maróstica LMF. Phlebotomines collected in remaining forests and wild an-imal shelters in zoological garden in the urban area of Maringá, Paraná state, southern Brazil. Preliminary study. Rev Soc Bras Med Trop. 1998; 31(6): 517-22.
Teodoro U, Silveira TGV, Santos DR, Santos ES, Santos AR, Oliveira O, et al. Frequency of phlebotomine fauna at home and in domes-tic shelters in the peridomicile, in the municipalities of Cianorte
and Doutor Camargo - state of Paraná - Brazil. Rev Pat Trop. 2001; 30(2): 209-23.
Truppel JH, Otomura F, Teodoro U, Massafera R, Costa-Ribeiro MCV, Catarino CM, et al. Can equids be a reservoir of Leishma-nia braziliensis in endemic areas? PLoS One. 2014; 9(4): e93731.