C
IENCIAS
A
DMINISTRATIVAS
A.C.
(ACACIA)
Tourism Demand in Northern Portugal: Application of a
Multivariate Model
MESA DE TRABAJO:Finanzas y Economía
Natália dos Santos;
[email protected]
; ESTiG-IPB.
Paula Fernandes (responsable);
[email protected]
; ESTiG-IPB.
NECE-Research Unit inBusiness Sciences, Universidade da Beira Inteira. (Telf.: +351.273.303103; Fax: +351.273.313051) Escola Superior de Tecnologia e Gestão (ESTiG)
Instituto Politécnico de Bragança (IPB) Campus de Sta. Apolónia, Apartado 1134
5301-857 Bragança, Portugal.
Multivariate Model
Summary
The northern region of Portugal has revealed some potential in the tourism sector over the last few years and capable of attracting tourist to this region. The reason of being of this work is to qualify the flow of tourists that come to the study region and verify the determining factors that influence tourist demand.
Thus the main aim of this work is to model tourist demand in the Northern Region of Portugal using econometric models based on stochastic general linear model. With that in mind, the tourism temporal series “Monthly Nights in Hotels in the Northern Region of Portugal”, recorded for the period Jan. 1996 - Dec. 2009, taking into consideration the main countries of origin of tourists.
The results obtained revealed that the model found produced satisfactory results, guarantying the basic hypothesis of the general linear model, showing its capabilities to explain the behaviour of tourist demand in the Northern region of Portugal.
KEYWORDS: Tourist Demand, Econometric Models, Stochastic General Linear Model.
Introduction
Tourist demand brings various amounts of goods and services that visitors, residents and non-residents acquire at a given moment. From this point of view, tourist demand is a set of goods and services that those who travel purchase in order to travel, expressed in terms of quantities (Cunha, 2003).
From this point of view tourist demand has as a main objective to explain consumer behaviour, bearing in mind their purchase decisions concerning goods and services available on the tourism market.
Just like the rest of Portugal, the Northern region is a rather differentiated region that offers an interesting alternative to the so called mass tourism, banking on offering a great variety of
tourism products, from beach to mountain, including spas and rural tourism, the latter registering a significant grow in the last few years.
According to the World Tourism Organization (WTO), Portugal will reach 18.3 million foreign visitors in 2020. Tourism is at present one of the most important activities. Apart from its impact on the balance of payments and GDP, and its role on employment generation, investment and revenue, it is also recognized a the “engine” for development and other economic activities (http://unwto.org, 2011).
Even though seasonality is one of the main characteristics of Portuguese tourism, it also depends on the source markets, the main ones being Spain, France, Germany and UK. These four source countries are also the main sources of tourists that visit the North of Portugal. In 2009 and on the whole, they accounted 41% of total hotel stays of foreign tourists (Daniel & Rodrigues, 2010).
Based on the above, this article aims to present a model that allows the modelling of tourist demand in the Northern Region of Portugal using the general linear model. With that in mind the tourism temporal series “Monthly stays in hotels in the North of Portugal” between Jan. 1996 and Dec. 2009 was used, as the dependent variable, and for the explanation were used, as explanatory variables, the following variables: average stays, consumer price index in Portugal, Spain, Germany, France and UK, the number of unemployed in Portugal, Spain, Germany, France and UK and GDP Portugal, Spain, Germany, France and UK. It must be pointed out that only explanatory variables from source countries with significant weight on tourism demand in the study area were taken into account.
1. Importance of the Tourism Sector in the Northern Region of Portugal
The tourism sector takes an undeniable relevance in the economy of the Northern region of Portugal. Nowadays tourism is one of the fastest growing activities and has turned out to be an important part of the economic structure of our country. Even though the tourism activity is a relatively recent economic activity in northern Portugal it already presents a significant diversification and fragmentation.Tourism has a major importance due to the following positive aspects (www.aicopa.pt, 2011):
• Important source of revenue that contributes to the stability of the balance of payments
of the recipient economies;
• Contributes towards the diversification of the local economy; • Need for work force;
• Favours infrastructure and additional services development; • Helps balancing public accounts via taxes collected.
The tourism sector in the northern region of Portugal has an impact at various levels: indigenization of local resources, natural, human, historical or cultural adding value to the rural environment and to the natural and cultural heritage. The sale of regional products will help to promote and expand both regional goods and services. Tourism establishments serve not just tourists but also the local population. In this sense tourism will contribute to the dynamization and modernization of the local production by supporting and valuing regional customs and traditions. It will also contribute towards diversification and preservation of economic activities in the farming sector and towards creation and preservation of jobs. The activity can even constitute a factor of diversification and preservation of farming activities by dynamizing a set of different interrelated and secondary economic activities.
Schwartz, 2006; Moutinho et al., 2008; Fernandes et al., 2008; Guizzardi & Azzocchi, 2010;
Kairat, 2010).
2.1. Model Variables Presentation and Behaviour
In this study the option was chosen to work with variables that influence tourism demand, such as: Average Stays (for the source market Portugal); Harmonized Index of Consumer Prices (for Portugal and the four main source markets: Spain, Germany, France and UK); No. of unemployed (for Portugal and the four main source markets: Spain, Germany, France and UK) and GDP (for Portugal and the four main source markets: Spain, Germany, France and UK). Then the analysis of each one of these variables will take place, including the variable of stays in the accommodation establishments of Northern Portugal.
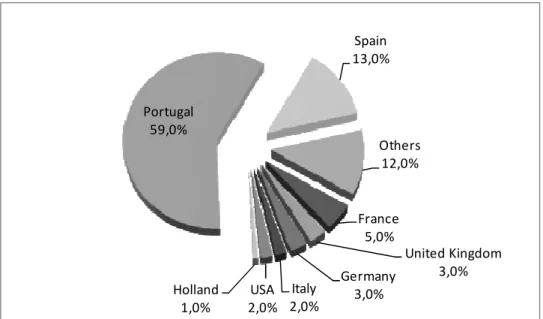
It must be pointed out that the choice of Spain, Germany, France and UK as main source markets for Portugal was based on the important position that these source markets hold, as in 2009 they accounted for approximately 13%, 5%, 3% e 3% respectively of the total stays in the Northern Region, this being their share of the market (Figure 1).
Figure 1:Main Source Markets, No. of Stays in 2009.
Stays in the Northern Region of Portugal consist of an individual stay in an accommodation establishment for the period between 12 noon to 12 noon the following day (INE, 2010), i.e. it is the number of sleepovers recorded in the study regions. The variable stays in the Northern Region of Portugal has sleepovers as the measuring unit, that is to say the number of nights a guest stayed in the region. The results obtained and presented in Figure 2 relate to the period between Jan. 1996 to Dec. 2009, from 168 monthly data during 14 years. Analysing the behaviour of the series it can be verified that there is seasonality (higher figures during the summer months and lower figures in winter). It is also clear that there is a progressive increase
!
over the period in question. A stronger growth from 1998 to 2001 is also apparent, and then there is a slight decrease until 2004, and then a significant growth from 2005 to 2008. This growth may be the result of investments made in marketing variables that promoted the region both nationally and internationally.
Figure 2: Stays in Accommodation Units in Northern Portugal [Jan 96 - Dec 09].
Average stays is the relation between the number of stays in the Northern region of Portugal and the number of guests involved in those stays. The measuring unit of this variable is the number of days an individual stays in an accommodation establishment (INE, 2010). So with this in mind and after analysing Figure 3, it can be verified that guest spent an average 2 nights in the study area (1.8 nights), although the figures vary between 1.6 nights in January 2006, the lowest figure present in the series, and 2.1 nights in June 2004, the highest figure. This latest situation may be justified by the sports event held EURO 2004, and 4 of the 10 football stadia used are in the Northern region. It must be noted that the introduction of the stay variable is applicable and justifiable due to the weight that the markets have in the total of stays in the Northern Region of Portugal.
Figure 3: Average Stays[Jan 96 - Dec 09].
The Consumer Price Index (IPC) is an indicator that measures the change over time in the prices paid for a set of goods and services considered representative of the consuming structure of the population residing in the main source markets (INE, 2010). The Harmonized Consumer Price Index (IHPC) was chosen as the most appropriate inflation indicator for comparing different countries, in this case within the EU. Figure 4, presents the behaviour of the IHPC series05 for the source market Spain, where a growing tendency can be seen for the study period, reflecting a rise in prices of consumer goods basket, which indicates a decrease in purchase power. Data obtained from EUROSTAT’s database.
Figure 4: Harmonized Consumer Price Index for Portugal and Source Markets, [Jan 96 - Dec 09].
% & ' ( ) * & * & + * ' " * ' + * ( , -* ( ) * .* * / * 0 . * ) * ) * * + * % " * % + * , -* ) * & . * ' * ' / * ( 0 . * ( ) * 70,00 80,00 90,00 100,00 110,00 120,00 Ja n -9 6 Ju l-9 6 Ja n -9 7 Ju l-9 7 Ja n -9 8 Ju l-9 8 Ja n -9 9 Ju l-9 9 Ja n -0 0 Ju l-0 0 Ja n -0 1 Ju l-0 1 Ja n -0 2 Ju l-0 2 Ja n -0 3 Ju l-0 3 Ja n -0 4 Ju l-0 4 Ja n -0 5 Ju l-0 5 Ja n -0 6 Ju l-0 6 Ja n -0 7 Ju l-0 7 Ja n -0 8 Ju l-0 8 Ja n -0 9 Ju l-0 9 IH P C _ ( 2 0 0 5 = 1 0 0 ) Months/Years
The unemployed number is a relevant indicator of the economic situation of a country and can be one of the indirect indicators of tendency towards consumption and demand of non-essential goods and services as is the case of tourism sector services. The next figure shows a significant difference when comparing the five series, as the source markets series values are higher than the values relating to the Portugal series. Whilst the Portugal series presents a nearly constant fluctuation the source markets present a more evident fluctuation. It must be pointed out that the number of unemployed in the source markets during the last months analyzed has risen. Data obtained from EUROSTAT’s database.
Figure 5: No. of Unemployed in Portugal and Source Markets [Jan 96 - Dec 09].
Since GDP is the sum of all end goods and services produced in a country in a given period of time, it is an extremely important indicator because it shows the wealth of a country, and so it can influence tourism demand. It is a quarterly variable and to make it a monthly variable, in every quarter the value was divided by the three months.
Figure 6: GDP (PIB) for Portugal and Source Markets [Jan 96 - Dec 09].
0 500 1.000 1.500 2.000 2.500 3.000 3.500 4.000 4.500 5.000 Ja n -9 6 Ju l-9 6 Ja n -9 7 Ju l-9 7 Ja n -9 8 Ju l-9 8 Ja n -9 9 Ju l-9 9 Ja n -0 0 Ju l-0 0 Ja n -0 1 Ju l-0 1 Ja n -0 2 Ju l-0 2 Ja n -0 3 Ju l-0 3 Ja n -0 4 Ju l-0 4 Ja n -0 5 Ju l-0 5 Ja n -0 6 Ju l-0 6 Ja n -0 7 Ju l-0 7 Ja n -0 8 Ju l-0 8 Ja n -0 9 Ju l-0 9 N o . o f U n e m p lo ye d Months/Years
ND_Portugal ND_Spain ND_ Germany ND_ France ND_United Kindom
0 25.000 50.000 75.000 100.000 125.000 150.000 175.000 200.000 Ja n -9 6 Ju l-9 6 Ja n -9 7 Ju l-9 7 Ja n -9 8 Ju l-9 8 Ja n -9 9 Ju l-9 9 Ja n -0 0 Ju l-0 0 Ja n -0 1 Ju l-0 1 Ja n -0 2 Ju l-0 2 Ja n -0 3 Ju l-0 3 Ja n -0 4 Ju l-0 4 Ja n -0 5 Ju l-0 5 Ja n -0 6 Ju l-0 6 Ja n -0 7 Ju l-0 7 Ja n -0 8 Ju l-0 8 Ja n -0 9 Ju l-0 9 G D P ( P IB ) Months/Years
The autonomous component, also known as the model constant, is a variable that is not influenced by explanatory variables and its value is unknown, i.e. this component cannot be quantified via the explanatory variables.
Finally, this model has the error term or stochastic term whose data is not observed, i.e. there is no data that can be represented in the model.
2.2. Application of static model
The static model is just a representation of the relation between variables at a given moment in time.
In general terms the restrict model presents the following expression:
( )
t t
Y
=
f y
(1)Or:
0 1 2 3 4 5
t t t t t t t t
Y
=
a
+
b X
+
b X
+
b X
+
b X
+
b X
+
b X
+
u
(2)As mentioned in previous sections, the variables that served as base for the model elaboration were; Average Stays [PM], Harmonized Consumer Price Index - Portugal [IHPCPT], Harmonized Consumer Price Index - Spain [IHPCSP], Harmonized Consumer Price Index - Germany [IHPCAL], Harmonized Consumer Price Index - France [IHPCFR], Harmonized Consumer Price Index - UK [IHPCUK], No. of Unemployed Portugal [NDPT], No. of Unemployed Spain [NDSP], No. of Unemployed Germany [NDAL], No. of Unemployed France [NDFR], No. of Unemployed UK [NDUK], GDP Portugal [PIBPT], GDP Spain [PIBSP], GDP Germany [PIBAL], GDP France [PIBFR] and GDP UK [PIBUK]. The mathematical model can be written as follows:
!"
#$% &$% '$% ($% $%!" ) ) )
) )!" * (3)
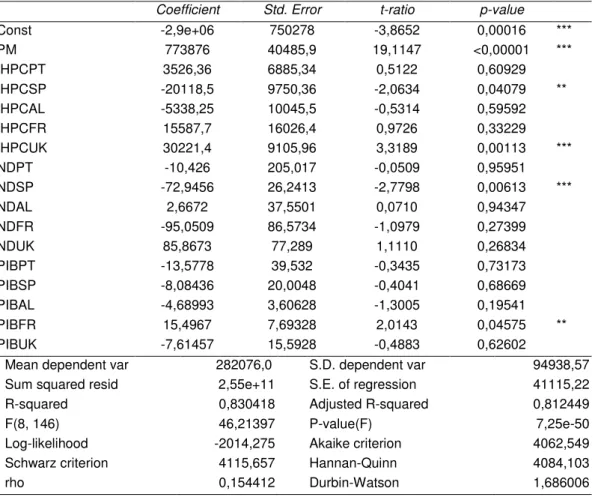
Below are the results obtained for the model estimated by the OLS1 application (Table 1). From the results presented, it can be said that the determination coefficient is 0.83 and indicates that the average stays variables, consumer price index, jobless number and GDP of Portugal and main source markets explain approximately 83% of variations taking place in stays
in the Northern region of Portugal. The adjusted determination coefficient is 0.81 and indicates that approximately 81% of variations that took place in the Northern region of Portugal were explained by the variations occurred in the independent variables.
The autonomous component indicates that -2,9e+06 of overnight stays in the Northern region of Portugal are not explained by the other independent variables. This variable is statistically significant, at a significance level of 1%, i.e. 99% of the constant’s value is a correct value.
If the variable average stays varies in a day, the variable overnight stay increases approximately 733,876 overnights, existing a positive relationship between these two variables. This variable is statistically significant, at a significance level of 1%, i.e. 99% of the value of the average stays variable is a correct value.
Table 1: Performance Measures of the Estimated Model (OLS).
Coefficient Std. Error t-ratio p-value
Const -2,9e+06 750278 -3,8652 0,00016 *** PM 773876 40485,9 19,1147 <0,00001 *** IHPCPT 3526,36 6885,34 0,5122 0,60929 IHPCSP -20118,5 9750,36 -2,0634 0,04079 ** IHPCAL -5338,25 10045,5 -0,5314 0,59592 IHPCFR 15587,7 16026,4 0,9726 0,33229 IHPCUK 30221,4 9105,96 3,3189 0,00113 *** NDPT -10,426 205,017 -0,0509 0,95951 NDSP -72,9456 26,2413 -2,7798 0,00613 *** NDAL 2,6672 37,5501 0,0710 0,94347 NDFR -95,0509 86,5734 -1,0979 0,27399 NDUK 85,8673 77,289 1,1110 0,26834 PIBPT -13,5778 39,532 -0,3435 0,73173 PIBSP -8,08436 20,0048 -0,4041 0,68669 PIBAL -4,68993 3,60628 -1,3005 0,19541 PIBFR 15,4967 7,69328 2,0143 0,04575 ** PIBUK -7,61457 15,5928 -0,4883 0,62602
Mean dependent var 282076,0 S.D. dependent var 94938,57 Sum squared resid 2,55e+11 S.E. of regression 41115,22 R-squared 0,830418 Adjusted R-squared 0,812449 F(8, 146) 46,21397 P-value(F) 7,25e-50 Log-likelihood -2014,275 Akaike criterion 4062,549 Schwarz criterion 4115,657 Hannan-Quinn 4084,103 rho 0,154412 Durbin-Watson 1,686006
In relation to the variable harmonized consumer price index of:
- Portugal, if it varies by one unit, the variable sleepovers in the Northern region of Portugal increases approximately 3526 sleepovers. There is a positive relationship between these two variables. This variable does not have a statistic significance;
these two variables. This variable is statistically significant, to a significance level of 5%, i.e. 95% of the value of the variable consumer price index of Spain is a correct value; - Germany, if it varies one unit, the variable sleepovers in the Northern region of Portugal decreases approximately 5,338 sleepovers. There is a negative relationship between these two variables. This variable does not have a statistical significance;
- France, if it varies one unit, the variable sleepovers in the Northern region of Portugal increases approximately 15,587 sleepovers. There is a positive relationship between these two variables. This variable does not have statistical significance;
- UK, if it varies one unit, the variable sleepovers in the Northern region of Portugal increases approximately 30.221 sleepovers. There is a positive relationship between these two variables. This variable is statistically significant to a significance level of 1%, i.e. 99% of the value of the variable harmonized consumer price index of the UK is a correct value.
If the variable number of unemployed in Portugal varies one unit, the variable sleepovers in the Northern region of Portugal will decrease approximately 10.42 sleepovers. There is an inverse relation between these two variables. This variable does not have statistical significance.
If the variable number of unemployed in Spain varies one unit, the variable sleepovers in the Northern region of Portugal will decrease approximately 73 sleepovers, there is an inverse relation between these two variables. This variable is statistically significant, to a significance level of 1%, i.e. 99% of the value of the variable number of jobless in Spain is a correct value. If the variable number of unemployed in Germany varies one unit, the variable sleepovers in the Northern region of Portugal will increase approximately 3 sleepovers. There is an inverse relation between these two variables. This variable does not have statistical significance.
In France, if the number of unemployed increases one unit, the variable sleepovers in the northern region of Portugal will decrease 3 sleepovers. There is an inverse relation between these two variables. This variable does not have statistical significance.
Regarding the UK, if the number of unemployed increases one unit, the variable sleepovers in the northern region of Portugal will increase in approximately 85 sleepovers. There is a positive relation between these two variables. This variable does not have statistical significance.
By varying Portugal’s GDP by one unit, the variable sleepovers in the northern region of Portugal will decrease in approximately 13 sleepovers. There is an inverse relation between these two variables. This variable does not have statistical significance.
By varying Germany’s GDP by one unit, the variable sleepovers in the northern region of Portugal will decrease in approximately 4 sleepovers. There is an inverse relation between these two variables. This variable does not have statistical significance.
By varying France’s GDP by one unit, the variable sleepovers in the northern region of Portugal will increase in approximately 15 sleepovers. There is a positive relation between these two variables. This variable is statistically significant assumed a significance level of 5%, i.e. 95% of the variable France GDP is a correct value.
By varying UK’s GDP by one unit, the variable sleepovers in the northern region of Portugal will decrease in approximately 8 sleepovers. There is an inverse relation between these two variables. This variable does not have statistical significance.
In relation to the statistic of F (4,151)=46,21397, p-value=7,25e-50, inferior to 1%, there are statistically enough evidence to state that there are variables that take on values different from zero, and as said previously, variables included together in the model explain satisfactorily the variations occurred in the variable sleepovers in the northern region of Portugal.
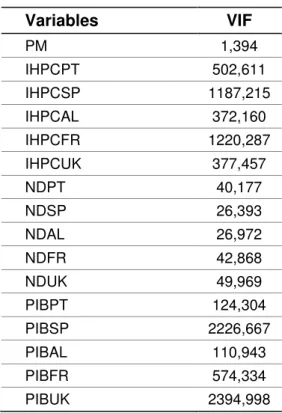
Regarding the analysis of transgression to basic hypothesis of MLG2 it must be pointed out that: - About multicolinearity and taking as base the values of VIF3, it is proved that there is a transgression to the basic hypothesis of multicolinearity, since VIF values for variables are above 10 points. It can be concluded that there is a correlation/dependency of explanatory variables, i.e. variables are interrelated.
Table 2: VIF of Static Model.
Variables
VIF
PM 1,394
IHPCPT 502,611
IHPCSP 1187,215
IHPCAL 372,160
IHPCFR 1220,287
IHPCUK 377,457
NDPT 40,177
NDSP 26,393
NDAL 26,972
NDFR 42,868
NDUK 49,969
PIBPT 124,304
PIBSP 2226,667
PIBAL 110,943
PIBFR 574,334
PIBUK 2394,998
2 Model Linear General.
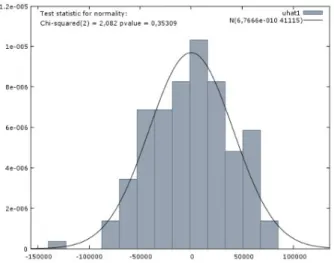
- The normality test of residue carried out through the statistics test 2
χ
=2,082, with p-value=0,35309, meaning that this model follows a normal distribution to a level of significance of 1%, so this hypothesis is not violated;Figure 7: Normal distribution of static model.
- Through graphic observation (Figure 7) it can be verified that the average is equal µ=6,7666e-010. This value is approximately zero, so the hypothesis of zero average is not violated
E
( )
µ
=
0
;- Regarding homoscedasticity, variance constant in the error term, through the White test
for heteroscedasticity and test statistic TR2=156,52 with proff value ( 2
χ
(152)> 156,52) = 0,3840, because p-value is above 10%, so it can be concluded that there is no violation of homoscedasticity, i.e. the variance is constant from observation to observation. There is no loss of characteristic of estimators OLS, remain BLUE4;- Obtained a statistic of Durbin-Watson=1.686006. The value of the statistic of Durbin-Watson is found in the positive autocorrelation zone. Thus it can be concluded that there
is transgression to independence of the error of term, and this model suffers error autocorrelation. In order to try to deal with this problem, i.e. try to correct the transgression to the error independency hypothesis, the Cochrane-Orcutt test was
applied, so through estimation was achieved a statistic of Durbin-Watson =1.863136, still
within the positive autocorrelation zone. In this sense, the Hildreth-Lu test was applied, so
through estimation the statistic of Durbin-Watson=1.863140, is still within the positive
autocorrelation zone. Finally, the Prais-Winsten test was applied, so through estimation
the following statistic of Durbin-Watson=1.863154 was obtained. It still falls within the
positive autocorrelation zone. This model suffers from error autocorrelation, i.e. the errors are not interdependent, and have a consequence of estimators of minimum square are not the estimators with minimal variance, i.e. are not efficient even though they remain
4
unbiased. In order to overcome the problems previously identified multicollinearity and autocorrelation of errors of the static model, one other model was calculated applying the first differences, this model will be presented in the following point.
2.3. Static Model applying First Differences
To build these univariate models it is necessary first of all for the series under analysis to be stationary. In the case of the series under study not being stationary, one of the methods that enables it to become stationary is the so-called regular differentiation, consisting of the differentiation of the series as many times as are necessary to achieve stationary. The first order difference or first difference is given by:
+, , - ,. (4)
Apart from regular differentiation, seasonal differentiation must be mentioned should the series under study present seasonality. How can seasonality be spotted in a series? Graphically seasonality can be spotted by a pattern that is repeated at fixed time intervals (months, quarters, etc.). Seasonal differentiation, for data with monthly frequency, consists of obtaining a series that results in the difference between an observation and its counterpart in the previous year.
+ , , - ,. (5)
In this sense, the model of the first differences represents the relations of a given variable in a determined moment related to related variables in previous moments. In the study case is given by the following expression:
+ + + + + +
+ !" + #$% + &$% + '$% + ($% + $%!" + )
+ ) + ) + ) + )!" +* /////////////////////////////////////////////////////////////(6)
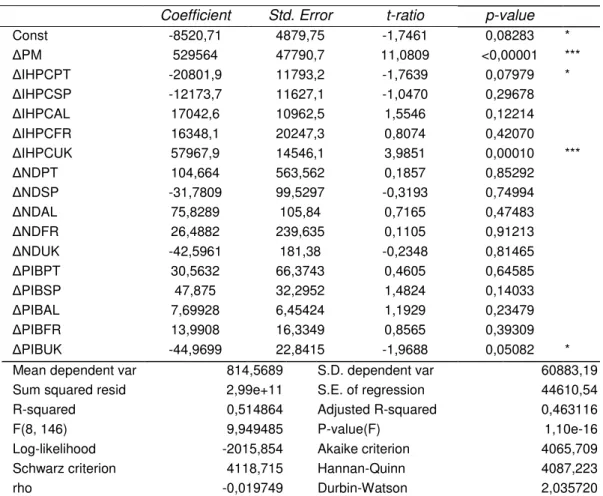
The results obtained for the dynamic model calculated by the application OLS (Table 3) are presented next.
Table 3: Performance Measures of Estimated Model (OLS).
Coefficient Std. Error t-ratio p-value Const -8520,71 4879,75 -1,7461 0,08283 *
PM 529564 47790,7 11,0809 <0,00001 *** IHPCPT -20801,9 11793,2 -1,7639 0,07979 * IHPCSP -12173,7 11627,1 -1,0470 0,29678 IHPCAL 17042,6 10962,5 1,5546 0,12214 IHPCFR 16348,1 20247,3 0,8074 0,42070 IHPCUK 57967,9 14546,1 3,9851 0,00010 *** NDPT 104,664 563,562 0,1857 0,85292 NDSP -31,7809 99,5297 -0,3193 0,74994 NDAL 75,8289 105,84 0,7165 0,47483 NDFR 26,4882 239,635 0,1105 0,91213 NDUK -42,5961 181,38 -0,2348 0,81465 PIBPT 30,5632 66,3743 0,4605 0,64585 PIBSP 47,875 32,2952 1,4824 0,14033 PIBAL 7,69928 6,45424 1,1929 0,23479 PIBFR 13,9908 16,3349 0,8565 0,39309 PIBUK -44,9699 22,8415 -1,9688 0,05082 * Mean dependent var 814,5689 S.D. dependent var 60883,19 Sum squared resid 2,99e+11 S.E. of regression 44610,54 R-squared 0,514864 Adjusted R-squared 0,463116 F(8, 146) 9,949485 P-value(F) 1,10e-16 Log-likelihood -2015,854 Akaike criterion 4065,709 Schwarz criterion 4118,715 Hannan-Quinn 4087,223 rho -0,019749 Durbin-Watson 2,035720
The autonomous component indicates that -8520.71 overnight stays in the northern region of Portugal are not explained by the remaining independent variables. This variable is statistically significant, to a level of significance of 10%, i.e. 90% of the value of the constant is a correct value.
If the variable average stay for the anterior period of time varies by one day, the variable overnights in the northern region of Portugal approximately 529,564 stays. There is a positive relation between these two variables. This variable is statistically significant, to a level of significance of 1%, i.e. 99% of the variable average stays in the anterior period are a correct value.
variable overnight stays in the northern region of Portugal decreases approximately by 44 stays. There is an inverse relation between these two variables. This variable is statistically significant, to a significance level 10%, i.e. 90% of the value of the variable UK GDP in the anterior period of time is a correct value. It should be pointed out that the remaining variables analysed do not have statistical significance.
In relation to statistic F (8,146)=9,949485, value of p-value=1,10e-16, inferior to 1% the hypothesis that there are variables that take values different from zero can be accepted, and as said before, the variables for the anterior time period included together in the model, explain satisfactorily the variations occurred in the variable overnight stays in the northern region of Portugal.
Regarding the analysis of transgression of basic hypothesis of MLG - 1st differences, it must be pointed out that:
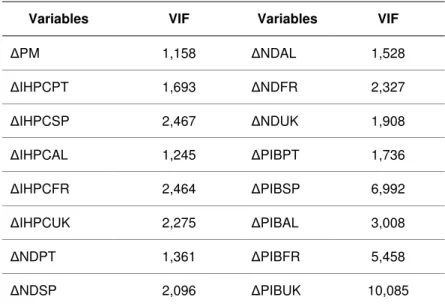
- About multicollinearity and based on the values of VIF, it is verified that there is no transgression to the basic hypothesis of multicollinearity, since the VIF values for variables in the anterior period of time is below 10 points. It can be concluded that there is a lack of independence of explanatory variables, i.e. the variables in the anterior period of time does not have any relation between them. It is important to note that the estimators remain BLUE;
Table 4: VIF of model MLG - 1stDifferences.
Variables VIF Variables VIF
PM 1,158 NDAL 1,528
IHPCPT 1,693 NDFR 2,327
IHPCSP 2,467 NDUK 1,908
IHPCAL 1,245 PIBPT 1,736
IHPCFR 2,464 PIBSP 6,992
IHPCUK 2,275 PIBAL 3,008
NDPT 1,361 PIBFR 5,458
NDSP 2,096 PIBUK 10,085
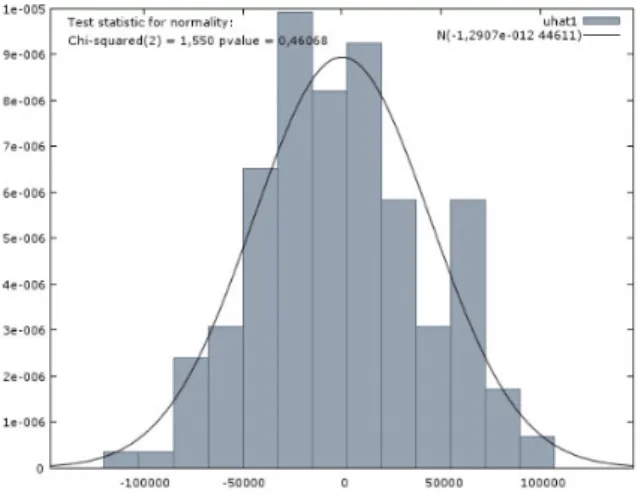
- The normality test of residue done through the test statistic 2
Figure 8: Normal distribution of first differences model
.
- Through graphic observation (Figure 8) it can be verified that the average equals µ=1.2907e-012. This value is approximately zero, so the hypothesis of zero average is not infringed,
E
( )
µ
=
0
;- Regarding homoscedasticity, constant variance of the error of term, through the White
test for the heteroscedasticity and the test statistic TR2=132,829 with p-value ( 2
χ
(131)> 132,829)=0,43894 because the p-value is above 10% it can be concluded that the hypothesis of homoscedasticity is accepted. According to the results obtained it can be concluded that there is no transgression to homoscedasticity that is to say that the variance is constant from observation to observation. There is no loss of characteristics of OLS estimators remain BLUE.- The Durbin-Watson=2,035720 statistic was obtained. The value of the Durbin-Watson
statistic falls in the independence zone of errors and the restrict model does not infringe the hypothesis of independence of error terms.
2.4. Choice of best model
Generally, through the above presented interpretation of results, the best model would be first differences. Nevertheless, to prove this hypothesis the significance of linear restrictions test must be carried out. Those being:
0
H
: Static model;1
Table 4: Set of restrictions.
1: b[ IHPCPT] = 0 2: b[ IHPCSP] = 0 3: b[ IHPCAL] = 0 4: b[ IHPCFR] = 0 5: b[ IHPCUK] = 0 6: b[ NDPT] = 0 7: b[ NDSP] = 0
8: b[ NDAL] = 0 9: b[ NDFR] = 0 10: b[ NDUK] = 0 11: b[ PIBPT] = 0 12: b[ PIBSP] = 0 13: b[ PIBAL] = 0 14: b[ PIBFR] = 0 15: b[ PIBUK] = 0
Through the test statistics of (15,150)=3,06944, with p-value=0,000333257, means that the hypothesis of first differences is accepted, since the p-value is inferior to 10%. From this point of view, the variables in the anterior period contribute to the explanation of overnight stays in the northern region of Portugal.
3. Analysis and Discussions of Results
By analysing the determination coefficients it can be verified that in the model applying first differences decreased in relation to the Stactic Model. From the determination coefficient of approximately 83% in the static model it went on to a determination coefficient of approximately 51%. Nevertheless the coefficient remains with satisfactory results.
In relation to basic hypothesis of the MLG it must be noted that in the static model there is infringement to multicollinearity and to independence of errors. To deal with the multicollinearity and autocorrelation of errors it was calculated a model using the first differences. Through this model the basic hypothesis of MLG are guaranteed.
It is important to mention that in both models the hypothesis of normality of term and the average zero were guaranteed.
Through the Fisher test it is verified that the variables included in the model as a set, explain satisfactorily the variations occurred in overnight stays in the northern region of Portugal.
Conclusion and future lines of research
The static OLS model estimated, applying first differences, was the model that produced best results and the one best suited for the original series Overnight stays in the Northern Region of Portugal, compared to the static model analysed.
The model of first differences did not infringe the basic hypothesis, presenting a determination coefficient and an adjusted determination coefficient of approximately 51% and 46% respectively, thus appearing to be a good model, generating estimators BLUE.
The OLS model in the present time period presents explanatory variables that are interrelated, bringing about as a consequence the impossibility of calculation of minimum square estimators, and it prevents the separation of individual effects of explanatory variables.
It was concluded that the OLS static model needs to correct the autocorrelation of errors with more advanced tests, since the autocorrelation presented and corrected with the Cochrane Orcutt, Hildreth Lu and Prais-Winsten tests was not enough to eliminate that phenomenon, i.e.
this model presented dependences in the term of error from observation to observation. These transgressions also affect the validity of hypothesis tests and reliability intervals
This way it was concluded that the estimated static model should be accepted, applying the first differences to progress in the study and thus attain the objective of this study, i.e. it was the one that presented the most satisfactory statistic qualities, and the one that better explained the behaviour of the variable Overnight Stays in the Northern Region of Portugal.
During the treatment of the empirical part, and since the static model violated the basic hypothesis of the term of error (hypothesis of constant variance of term of error), as well as the basic hypothesis of multicollinearity, it is suggested in future investigations the use of more advanced tests that enable these transgressions to be corrected.
It is also suggested the introduction in the model of more explanatory variables, such as: temperature, reason for travelling, exchange rates, and average expenditure in tourism destination, amongst others.
All this investigation and methodology, previously mentioned, and once tested for the northern region of Portugal, can be widened for a study of Portugal.
Bibliographic References
AICOPA; http://www.aicopa.pt/content/estudos_turismo.pdf (acedido em 28 de Janeiro de 2011).
Cunha, L.; (2003); “Introdução ao Turismo”; Editorial Verbo, Lisboa/São Paulo.
Daniel, A. & Rodrigues, P.; (2010); “Modelação da Procura Turística na Madeira”; 16º Congresso da APDR Universidade da Madeira, Funchal, pp. 1142/1166.
EUROSTAT; http:// epp.eurostat.ec.europa.eu. (acedido em 08 de Fevereiro de 2011).
Fernandes, P. Odete; Teixeira, J. P.; Ferreira, J. M. & Azevedo, S. G.; (2008); “Modelling Tourism Demand: A Comparative Study between Artificial Neural Networks and the Box-Jenkins Methodology”; Romanian Journal of Economic Forecasting, n.º 5(3), pp. 30/50.
ISBN:978-84-92453-69-6.
Frechtling, C; (2009); “The Tourism Satellite account – a primer”; Annals of Tourism Research,
Vol. 37, n.º 1, pp. 136/153.
Goh, C. & Law, R.; (2002); “Modeling and forecasting tourism demand for arrivals with stochastic nonstationary seasonality and intervention”; Tourism Management; n.º 23,
pp.499/510.
Guizzardi, A. & Mazzocchi, M.; (2010); “Tourism demand for Italy and the business cycle”;
Tourism Management, 31, pp. 367/377.
INE; (1996-2010); “Estatísticas do Turismo”; Lisboa, Instituto Nacional de Estatística.
INE; (2010); “Anuário Estatístico da Região Norte 2009”; Lisboa, Instituto Nacional de
Estatística.
Kairat, T; (2010); “Asymptotic distribution of the OLS estimator for a mixed spatial model”;
Journal of Multivariate Analysis, 101, pp. 733/748.
Liam, C.; (1997); “An econometric classification and review of international tourism demand models”; Tourism Economics, n.º 3, pp. 69/81.
Makridakis,S. & Hibon,M.; (1997); “ARMA Models and the Box-Jenkins Methodology”; Journal of Forecasting; Vol. 16; pp.147/163.
Moutinho, L.; Huarng, K.H.; Yu, T.H.K. & Chen, C.Y; (2008); “Modeling and forecasting tourism demand: the case of flows from Mainland China to Taiwan”; Service Business; Vol. 2; n.º 3, pp.
219/232(14).
Preez, J. & Witt, S. F.; (2003), “Univariate versus multivariate time series forecasting: an application to international tourism demand”; International Journal of Forecasting; n.º 19; pp.
435/451.
Thawornwong, S. & Enke, D.; (2004); “The adaptive selection of financial and economic variables for use with artificial neural networks”; Neurocomputing; n.º 6; pp.205/232.
Thomakos, D. and Guerard, J.; (2004); “Naive, ARIMA, nonparametric, transfer function and VAR models: A comparison of forecasting performance”; International Journal of Forecasting;
n.º 20; pp. 53/67.
United Nations World Tourism Organization, Tourism Market Trends. Publicação [online]. UNWTO, 2006. Disponível em URL: http://www.unwto.org 02/2011.
Witt,S. F. & Witt, C. A.; (1995); “Forecasting tourism demand: a review of empirical research”;
International Journal of Forecasting; n.º 11; pp. 447/475.
![Figure 2: Stays in Accommodation Units in Northern Portugal [Jan 96 - Dec 09].](https://thumb-eu.123doks.com/thumbv2/123dok_br/16977639.762637/6.892.135.763.256.678/figure-stays-accommodation-units-northern-portugal-jan-dec.webp)
![Figure 4: Harmonized Consumer Price Index for Portugal and Source Markets, [Jan 96 - Dec 09]](https://thumb-eu.123doks.com/thumbv2/123dok_br/16977639.762637/7.892.131.769.781.1061/figure-harmonized-consumer-price-index-portugal-source-markets.webp)
![Figure 6: GDP (PIB) for Portugal and Source Markets [Jan 96 - Dec 09].](https://thumb-eu.123doks.com/thumbv2/123dok_br/16977639.762637/8.892.129.774.819.1115/figure-gdp-pib-portugal-source-markets-jan-dec.webp)