Hyperspectral remote sensing as an alternative to estimate soil
attributes
1Sensoriamento remoto hiperspectral como alternativa na estimativa de atributos do
Solo
José A. M. Demattê2*, Marcelo Rodrigo Alves3, Bruna Cristina Gallo4, Caio T. Fongaro4, Arnaldo Barros e
Souza4, Danilo Jefferson Romero4 e Marcus Vinicius Sato4
ABSTRACT - Minimizing environmental impacts and increasing crop productivity depend mainly on the knowledge of chemical, physical and mineralogical characteristics of the soil attributes. However, traditional methods are time-consuming and costly. The objective of this study was to determine and validate a method to quantify soil attributes using UV-Vis-NIR Spectroscopy as an alternative to conventional methods of soil analyses. The work comprised two main phases: (1) creation and calibration of statistical models to determine the soil attributes derived from spectral data extracted from soil samples collected in area 1, (2) validation of statistical models in area 2 and correlations between the estimated and observed values (conventional method) for each soil attribute. The equations of the attributes Fe2O3, Al2O3, and clay reached R2> 0.80 and may be applied to a different database than the one that was used to generate the
equations, provided that they belong to the same study site. Key words: Reflectance. Soil analysis. Remote Sensing.
RESUMO -A minimização de impactos ambientais e o aumento da produtividade agrícola dependem, principalmente, do conhecimento de características químicas, físicas e mineralógicas do solo. Os métodos tradicionais utilizados para este fim consomem muito tempo e são de elevado custo financeiro. O objetivo deste trabalho foi o de testar e validar um método de quantificação de atributos do solo pela energia eletromagnética refletida e detectada por espectrorradiometro no visível e infravermelho. Este procedimento surge como apoio ao método convencional de análise de solo. Para sua execução, as etapas de trabalho compreenderam duas fases: (1) criação e calibração de modelos estatísticos de determinação dos atributos do solo obtidos a partir de dados espectrais (obtidos por sensor em laboratório 450-2500 nm) extraídos de amostras de terra em uma área; (2) validação dos modelos estatísticos numa outra área desconhecida e correlações entre os valores estimados e determinados (método convencional). Concluiu-se que as equações dos atributos Fe2O3, Al2O3 e Argila, atingiram R2> 0,80 podendo ser aplicadas a uma base de dados diferente daquela que foi utilizada na geração das equações,
desde que pertença a mesma região de estudo.
Palavras-Chave:Reflectância. Solos-análise. Sensoriamento Remoto.
DOI: 10.5935/1806-6690.20150001 *Corresponding author
1Received for publication on 6/19/13; aproved in 11/24/14
Part Doctoral Thesis of the second author presented in Graduate Program of Soil and Plant Nutrition, ESALQ/USP
2Department of Soil Science, College of Agriculture Luiz de Queiroz, University of São Paulo, Piracicaba-SP, Brazil, jamdemat@usp.br 3Dr. Soil and Plant Nutrition, ESALQ/USP, Consultor of Csolos Mapeamento & Consultoria, marcelo@csolos.com.br
4Master Students, Department of Soil Science, Soil and Plant Nutrition program, College of Agriculture Luiz de Queiroz, University of São
INTRODUCTION
The use of traditional laboratory analyses is the most reliable method to determine soil attributes. Many studies and tests have been conducted to obtain the standard methods. However, these methods are
time-consuming and costly (CHANGet al., 2001).
In Brazil, more than 1 million samples of soil chemical analyses are performed a year. This requires a large amount of reagents and generates a lot of residuum
(RAIJ et al., 2001), therefore, the development of
more effective techniques to determine soil attributes
is necessary (CHANG et al., 2001). Reflectance
spectroscopy is an alternative method to estimate soil attributes namely clay and cation exchange capacity
(CEC) (LAGACHERIEet al., 2008; STEVENSet al.,
2006; VISCARRA-ROSSELet al., 2006).
The reflectance in the near infrared spectroscopy (NIRS) or near infrared analysis (NIRA) is a nondestructive analysis technique that studies the interactions between the incident light and the surface of a body identifying its components (STARK; LUCHTER; MARGOSHES, 1986). This technique has been widely used industrially due to its simplicity, speed and because it requires little or
no sample preparation (CHANGet al., 2001).
NIRA was developed 40 years ago as a technique of quick analysis of grain moisture (BEN-GERA; NORRIS, 1968). Although initiated years ago, the use of remote sensing of soil surface spectra has increased significantly in the last decade due to the advancement of sensing technology. Currently, NIRA methods are applied in the pharmaceutical, petrochemical, and various areas industries (WORKMAN JUNIOR, 1996).
Since the end of the 1990s, NIRA has been used operationally in laboratories, enabling quick and accurate determinations of most features of soil samples
(LAGACHERIE et al., 2008; VISCARRA-ROSSEL et
al., 2006) as, for example, in studies to determine soil
moisture (LOBELL; ASNER, 2002), organic carbon, electrical conductivity, CEC, pH, N, C, P, S, Ca, Mg, Na,
K, Fe and Mn (BARNES et al., 2003; CHANGet al.,
2001; DUNN et al., 2002; NANNI; DEMATTÊ, 2006;
SHEPHERD; WALSH, 2002).
In recent years, several works worldwide have used reflectance spectroscopy in the quantification of soil attributes for various purposes. Kuang and Mouazen (2012) quantified soil attributes (clay and C) from different regions in Europe using soil reflectance. Viscarra Rossel
et al. (2011) and Viscarra Rossel and Webster (2012)
quantified soil attributes in Australia for pedological
purposes. In the same year, Leone et al. (2012) used
reflectance spectroscopy to analyze soil clay from the
Mediterranean in southern Italy, while Gholizade et al.
(2013) evaluated the reflectance in the Vis-Nir to predict soil chemical attributes in lowlands. Cezaret al. (2013)
used this method to quantify clay in regions of Paraná State, Brazil, in an agricultural area. Volkan Bilgiliet al.
(2010), in turn, assessed C contents using spectroscopy, but in a semi-arid region of Turkey. Most works validate their models within their own modeling areas, which is biased. The question lies whether these models work in different regions. It is necessary, therefore, to test these models in regions outside the place where they were generated.
Regardless of the method for processing the spectral data, estimated values of soil attributes are highly correlated with the data obtained from conventional methods. Thus, this study correlates specific information about chemical, physical and mineralogical features of soil samples with their respective spectral data, obtaining equations of standardized multiple regression that can be applied to determine the same sample attributes of unknown features as an alternative to conventional soil analyses.
MATERIAL AND METHODS
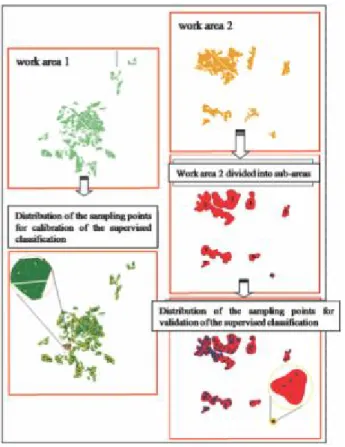
The study site (Figure 1) covers approximately 28,000 ha in the northeastern region of the São Paulo State, in several municipalities such as São Carlos, Araraquara, Ibaté, among others. Altitudes in the region range from 450-900 m and the climate is Cwb, temperate with dry winter. The average annual temperature is 20°C and rainfall rates range from 1,000 to 1,800 mm annually. The lithology of the site is represented mainly by the Serra Geral formations, Botucatu and Pirambóia (São Bento Group) and coverage of the Serra de Santana (Taubaté Group).
Figure 1 -Scheme of distribution of sampling points in area 1 (calibration phase) and area 2 (validation stage)
Phase 1 - Obtaining database for the development of phase 2
In area 1, 319 points were allocated based on the toposequence method and the points were sampled with an auger at 0-20, 40-60 and 80-100 cm, designated layers A, B and C, respectively. The samples were analyzed physically for sand (coarse and fine), silt and clay contents according to methodology of Camargo, Klant and Kauffman (1987). They were analyzed chemically to determine the pH (CaCl2, H2O and KCl) and contents of OM, P, K, Mg, Ca, Al and H + Al, according to the
methodology described by Raij et al. (2001). Based on
these data, the sum of the bases (S), the cationic exchange capacity (CEC), saturation by bases (V%) and saturation by Al (m%) were obtained. The total Fe (Fe2O3), Si (SiO2)
and Ti (TiO2) were determined by the sulphuric attack
(CAMARGO; MONIZ; VALADARES, 1986), and the Ki index was also calculated.
To obtain the spectral data in the laboratory, a hyperspectral sensor FieldSpec Spectroradiometer was used, covering the spectral range between 450 and 2,500 nm. After drying (45 °C for 24 h), the soil samples were ground, sieved (2 mm, for surface homogenization), and put in Petri dishes (9 cm of diameter). Afterwards,
the samples were returned to the laboratory to obtain the spectral data.
The spectral data were prepared according to the methodology proposed by Nanni and Demattê (2006). A matrix was generated to correlate the 22 bands and the 13 heights with the real values of the soil attributes, from which multiple regression equations were generated statistically that considered the determined soil attributes in conventional laboratory as dependent variables and the spectral data as independent variables. The equations estimated the following physical and chemical soil attributes, obtained from the correlation
matrix: sand, clay, pH in H2O, pH in KCl, OM, P,
K, C, Mg, H+Al, Al, sum of bases (SB), CEC, Al by saturation (m), saturation by bases (V), Fe2O3, SiO2, Al2O3, in addition to the Ki index, totaling 19 dependent variables.
Statistical Package for the Social Sciences was a software used to process the multiple linear regression analysis. The stepwise was the chosen method to derive the estimation of equations for soil attributes based on the spectral data. According to Glantz and Slinker (1990), the stepwise method allows the user to establish more reliable regression models, because the process of entering dependent variables is gradual and sequential, one variable is entered at a time into a regression equation, improving the estimation ability of the method. This method is particularly useful in situations of a large dataset with many independent variables. It tracks and identifies, in this large dataset, a small subset of variables that correlates and determines the value of a dependent variable.
Besides the coefficient of determination R², other statistical parameters, such as RMSE (Root Mean Square Error) and EM (Error of the Mean), were also used to indicate the effectiveness of the estimation models of soil attributes. The RMSE, also defined as RMSD (Root Mean Square Deviation) (GLANTZ; SLINKER, 1990), provided an idea of deviations in relation to line 1:1 (BROWNet al., 2006;
KOBAYASHI; SALAM, 2000; PROBERTet al., 1998;
WOLSCHICKet al., 2007) and the percentage of error
of the mean (EM) reported, on average, in terms of the observed value distancing from the estimated value in percentage.
Phase 2 - Obtaining the database for the development of phase 2
designated as A, B and C layers, respectively. Similar to phase 1, the data were submitted to the same physical and chemical analysis in the laboratory and afterwards, it was used to obtain the corresponding spectral data, which were subsequently processed to complete the data matrix.
Application of the equations obtained in phase 1 and data validation
After the data matrix from area 2 were organized, it received the equations obtained from data of area 1, respectively for each physical, chemical and mineralogical attributed studied. This procedure generated a table with analytical results for each of the 225 soil samples similarly to a conventional routine analysis, however obtained from spectral data.
The observed data (spectral analytical results) were correlated with the real data (conventional analytical results) and plotted on graphs of dispersion.
Associated with these graphs, the coefficients R2,
RMSD and EM were analyzed, which allowed determining the correlation between the conventional and spectral results.
Attributes Unit Statistics of descriptive data
n(1) Min Max Average SD(2) CV(3)
Sand g Kg-1 871 60.00 914.00 637.64 197.80 31.02
Clay g Kg-1 871 72.00 745.00 279.56 127.14 45.48
pH H2O - 871 3.90 6.90 5.32 0.50 9.42
pH KCl - 871 3.60 6.20 4.64 0.53 11.45
OM g Kg-1 871 2.00 33.00 10.55 5.06 47.93
P mg kg-1 871 1.00 144.00 6.06 11.78 194.50
K mmolc kg-1 871 0.10 10.60 0.75 1.05 140.60
Ca mmolc kg-1 871 2.00 67.00 13.24 10.12 76.46
Mg mmolc kg-1 871 1.00 29.00 3.89 3.39 87.11
H + Al mmolc kg-1 871 10.00 98.00 26.61 9.75 36.64
Al mmolc kg-1 871 0.00 11.00 1.95 1.96 100.47
S mmolc kg-1 871 3.00 94.00 17.89 13.31 74.39
CEC mmolc kg-1 871 17.00 120.00 44.50 16.41 36.87
V % 871 8.00 82.00 37.66 16.31 43.31
m % 871 0.00 63.00 15.07 16.22 107.58
Fe2O3 g kg-1 64 27.20 303.20 103.68 70.22 67.73
Al2O3 g kg-1 64 26.00 219.00 122.14 43.35 35.49
SiO2 g kg-1 64 25.00 182.00 84.45 29.02 34.36
Ki - 64 0.57 1.73 1.22 0.26 21.59
RESULTS AND DISCUSSION
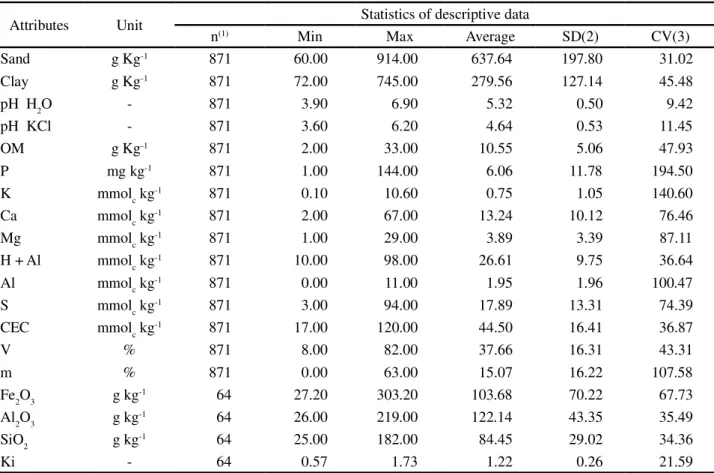
The results obtained for clay and sand contents indicate a high textural variability of the study site (Table 1) in agreement with the results obtained by Sousa Junior, Demattê and Araújo (2011). Other attributes such as P, K, m% and Al also showed high variability with the values of coefficient of variation (CV) above 100.
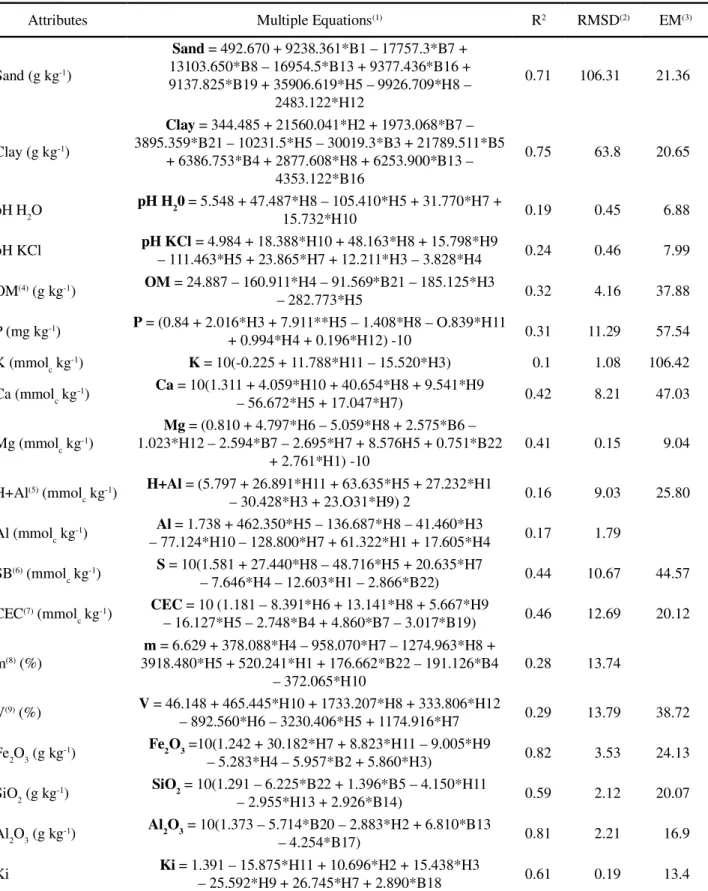
The equations for clay, sand and Mg (Table 2) showed the highest number of independent variables 10, 09, and 09 respectively. The smallest equation refers to K, with two variables. All other 19 equations showed at least one variable of height in their compositions.
The attributes with the best indices of determination were the Fe2O3, Al2O3, clay and sand, with R2 values above 0.7, which is considered a satisfactory value according to Colemanet al. (1991). Although the Ki index showed a R2 lower than 0.7 (0.61), it can be considered satisfactory due to low values of RMSD and ME (less than 15), showing that, on average, the observed value differed slightly from the estimated values, indicating a good relationship between the soil weathering rate and spectral reflectance.
Table 1 - Descriptive statistics of the database (three depths) of soil attributes. Average values of the entire dataset of 319 samples
Table 2 - Multiple regression equations developed from soil reflectance at ground level
(1)bands and heights selected;(2) Root Mean Standard Deviation;(3) Error of the Mean;(4) organic matter;(5) hydrogen plus aluminum;(6) sum
of bases (Ca + Mg + K);(7) Cationic Exchange Capacity (SB + H + Al);(8) saturation for bases [(SB/CEC*100)];(9) Saturation for aluminum
(Al/Al + SB) * 100
Attributes Multiple Equations(1) R2 RMSD(2) EM(3)
Sand (g kg-1)
Sand = 492.670 + 9238.361*B1 – 17757.3*B7 +
13103.650*B8 – 16954.5*B13 + 9377.436*B16 + 9137.825*B19 + 35906.619*H5 – 9926.709*H8 –
2483.122*H12
0.71 106.31 21.36
Clay (g kg-1)
Clay = 344.485 + 21560.041*H2 + 1973.068*B7 –
3895.359*B21 – 10231.5*H5 – 30019.3*B3 + 21789.511*B5 + 6386.753*B4 + 2877.608*H8 + 6253.900*B13 –
4353.122*B16
0.75 63.8 20.65
pH H2O pH H20 = 5.548 + 47.487*H8 – 105.410*H5 + 31.770*H7 +
15.732*H10 0.19 0.45 6.88
pH KCl pH KCl– 111.463*H5 + 23.865*H7 + 12.211*H3 – 3.828*H4 = 4.984 + 18.388*H10 + 48.163*H8 + 15.798*H9 0.24 0.46 7.99
OM(4) (g kg-1) OM = 24.887 – 160.911*H4 – 91.569*B21 – 185.125*H3
– 282.773*H5 0.32 4.16 37.88
P (mg kg-1) P = (0.84 + 2.016*H3 + 7.911**H5 – 1.408*H8 – O.839*H11
+ 0.994*H4 + 0.196*H12) -10 0.31 11.29 57.54
K (mmolc kg-1) K = 10(-0.225 + 11.788*H11 – 15.520*H3) 0.1 1.08 106.42
Ca (mmolc kg-1) Ca = 10(1.311 + 4.059*H10 + 40.654*H8 + 9.541*H9
– 56.672*H5 + 17.047*H7) 0.42 8.21 47.03
Mg (mmolc kg-1)
Mg = (0.810 + 4.797*H6 – 5.059*H8 + 2.575*B6 –
1.023*H12 – 2.594*B7 – 2.695*H7 + 8.576H5 + 0.751*B22 + 2.761*H1) -10
0.41 0.15 9.04
H+Al(5) (mmol c kg-1)
H+Al = (5.797 + 26.891*H11 + 63.635*H5 + 27.232*H1
– 30.428*H3 + 23.O31*H9) 2 0.16 9.03 25.80
Al (mmolc kg-1) Al = 1.738 + 462.350*H5 – 136.687*H8 – 41.460*H3
– 77.124*H10 – 128.800*H7 + 61.322*H1 + 17.605*H4 0.17 1.79
SB(6) (mmol c kg-1)
S = 10(1.581 + 27.440*H8 – 48.716*H5 + 20.635*H7
– 7.646*H4 – 12.603*H1 – 2.866*B22) 0.44 10.67 44.57
CEC(7) (mmol c kg-1)
CEC = 10 (1.181 – 8.391*H6 + 13.141*H8 + 5.667*H9
– 16.127*H5 – 2.748*B4 + 4.860*B7 – 3.017*B19) 0.46 12.69 20.12
m(8) (%)
m = 6.629 + 378.088*H4 – 958.070*H7 – 1274.963*H8 +
3918.480*H5 + 520.241*H1 + 176.662*B22 – 191.126*B4 – 372.065*H10
0.28 13.74
V(9) (%) V = 46.148 + 465.445*H10 + 1733.207*H8 + 333.806*H12
– 892.560*H6 – 3230.406*H5 + 1174.916*H7 0.29 13.79 38.72
Fe2O3 (g kg-1) Fe2O3 =10(1.242 + 30.182*H7 + 8.823*H11 – 9.005*H9
– 5.283*H4 – 5.957*B2 + 5.860*H3) 0.82 3.53 24.13
SiO2 (g kg-1) SiO2 = 10(1.291 – 6.225*B22 + 1.396*B5 – 4.150*H11
– 2.955*H13 + 2.926*B14) 0.59 2.12 20.07
Al2O3 (g kg-1) Al2O3 = 10(1.373 – 5.714*B20 – 2.883*H2 + 6.810*B13
– 4.254*B17) 0.81 2.21 16.9
The other chemical attributes showed R2 values lower than 0.5, while K showed the worst results, agreeing with the results of Sousa Junior, Demattê and Araújo (2011), which studied soils in the same region.
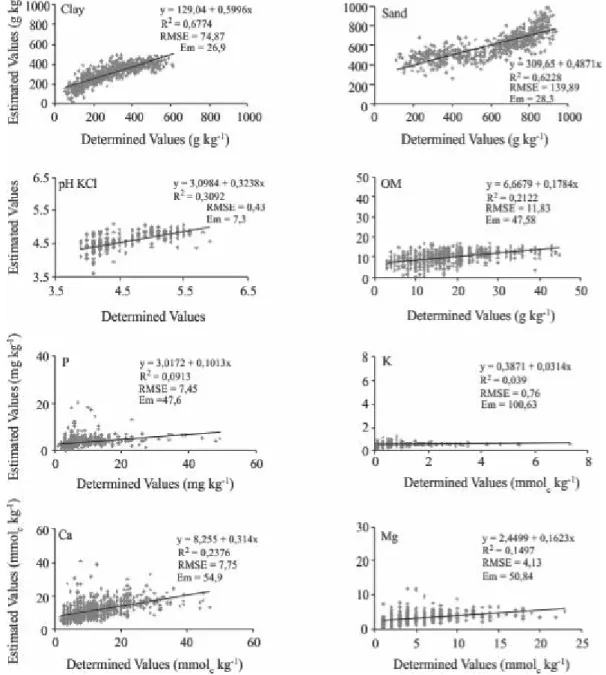
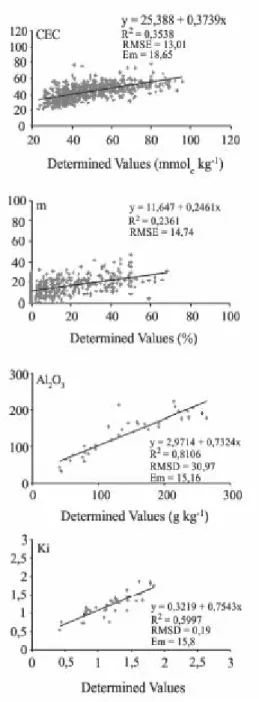
The determined equations were applied to the database of area 2 for all elements, and the estimated results were correlated with the real value, that is, determined by traditional methods (Figure 2). The best
results were obtained from physical attributes with R2
of 0.67 and 0.61 for clay and sand, respectively, and
Figure 2 - Comparison between the values of soil attributes determined in conventional laboratory (determined values) and estimated values by linear regression equations from soil reflectance data
for the attributes determined by sulfuric attack with R2 of 0.69, 0.81, 0.57 and 0.59 for Fe2O3, Al2O3, SiO2and Ki, respectively.
The other chemical elements (pH in KCl, OM,
Al, CEC, m%, V%, pH in H2O, P, K, Ca, Mg) showed
R2 values ranging from 0.02 to 0.3, which denotes that these attributes were not satisfactorily determined in the proposed method.
Figure 2 Continuation
the studied attributes allowed to separate the most representative for each attribute, agreeing with studies of Huete and Escadafal (1991), Demattê and Garcia (1999), Nanni and Demattê (2006). However, in these studies, the authors found a number of different variables to determine the respective soil attributes, with variations in the number of variables, showing that the variations may change according to the dataset and study site. Demattê and Garcia (1999) indicated differences in estimates when the dataset was made for a region and from various regions together.
In regards to the R2 values obtained for the
equations (Table 2), similar studies for attributes obtained by sulphuric attack, Demattê and Garcia (1999) showed R2 for Fe
2O3 of 0.64, while Nanni and Demattê (2006)
obtained R2of 0.95 for SiO
showed good association between the estimated data and the real data used to generate the equations.
For the Ki attribute, Demattê and Garcia (1999) used basalt soils and observed R2 of 0.69 for this attribute, inferring that the source material and, consequently, the study site interferes with the relationship between the weathering rates and their spectral response, which is no longer the case with soil physical attributes that show a closer relationship, as observed by several authors
(CHANG et al., 2001; SHEPHERD; WALSH, 2002;
SOUSA JUNIOR; DEMATTÊ; ARAÚJO, 2011), proving that estimating these attributes by remote sensing is efficient.
Variations of R2 in several studies on the use
of spectral reflectance to determine soil attributes are attributed to a number of factors, including observed soil variability, samples representativeness, number and specificity of the bands selected and equipment used as acquisition geometry. Regarding OM, Ben-Dor and Banin (1995b) reported that the degradation stage (type of OM) should be taken into account when predicting this attribute, justifying the R2 0.5 obtained in their studies.
For all other elements, the results were contrary to those observed by Dunnet al. (2002), who obtained R2 of
0.72 for K in soils of southern Australia. Similar satisfactory results, but in different locations, were found by Changet al. (2001) who obtained CEC (0.81), Ca (0.75), K (0.55),
and Mg (0.68). Shepherd and Walsh (2002) obtained 0.88 for CEC, 0.88 for Ca, and 0.81 for Mg, similar to Islam, Singh and Mcbratney (2003), who obtained CEC (0.64), Ca (0.67), and Mg (0.63). However, these results are related to R² values obtained from the relationship between observed and determined data that were used to generate the equations. At this stage of this study, the R2 values were obtained also from the relationship between the estimated and observed data, but without any dependency between these two datasets. Thus, the fact that the R2 values are low in certain cases is a result of the equations generated, which were not satisfactory.
In turn, the physical attributes and those determined conventionally by sulfuric attack were best estimated by the equations. In the case of physical attributes, these findings reinforce several works, such as Ben-Dor and Banin (1995a), Shepherd and Walsh (2002), Islam, Singh, and Mcbratney (2003), Nanni and Demattê (2006), who reported the potential of this methodology to predict these attributes.
With regard to the attribute obtained by sulphuric attack, Nanni and Demattê (2006) had already found high correlation values between these attributes and those obtained in the spectral method, the values of R2
of 0.88 (Fe2O3), 0.87 (Al2O3), and 0.72 (SiO2). However, in these works, the equations were not applied to a database from a different area. The discussion about the attribute Fe2O3is relevant as it is directly related to a particular soil class (EMPRESA BRASILEIRA DE PESQUISA AGROPECUÁRIA, 2006) inferring mainly in its classification. However, in most pedological works, analyses of sulphuric acid digestion determined are a small percentage of the total number of samples. This happens because of the high cost of these analyses and the slowness to obtain the results. Thus, determining the efficiency of these equations within an area allows to determine quantitative values of Fe2O3, Al2O3, SiO2, Ki, among others, for all sampled points, along with the low cost of analyses and rapid results.
CONCLUSIONS
1. The proposed method was effective as an alternative to determine the attributes Fe2O3, Al2O3, SiO2, sand and clay, with R2 values reaching 0.8, providing faster analyses and less environmental impact since chemical reagents are not required;
2. The pH elements in H2O, pH in KCl, OM, P, K, Ca, Mg, H+Al, Al, SB, CEC, m% and V% were not properly
estimated, obtaining low R2values. Elements related
to soil chemistry showed good and weak values, which denotes the need for further studies;
3. These results can be highly beneficial in various applications such as soil mapping and surveying, determining analyses and in precision agriculture. The method does not exclude the importance of traditional determinations, but it can aggregate information and optimize the conventional work.
ACKNOWLEDGEMENT
The authors thank Geotechnologies in Soil Science Group (GEOSS, http://esalqgeocis.wix.com/english).
REFERENCES
BARNES, E. M. et al. Remote and ground-based sensor techniques to map soil properties. Photogrammetric Engineering & Remote Sensing, v. 69, n. 6, p. 619-630, 2003.
BEN-DOR, E.; BANIN, A. Near-Infrared analysis (Nira) as a method to simultaneously evaluate spectral featureless constituents in soils.Soil Science, v. 159, n. 4, p. 259-269, 1995b.
BEN-GERA, I.; NORRIS, K. Determination of moisture content in soybeans by direct spetrophotometry.Israel Journal of Agricultural Research,v. 18, p. 124-132, 1968.
BILGILI, A. V. et al. Visible- near infrared reflectance spectroscopy for assessment of soil properties in a semi- arid area of Turkey.Journal of Arid Environments,v. 74, n. 2, p. 229-238, 2010.
BROWN, D. J.et al. Global soil characterization with VNIR diffuse reflectance spectroscopy. Geoderma,v. 132, n. 3/4, p. 273-290, 2006.
CAMARGO, A. O.; MONIZ, A. C.; VALADARES, J. M. Métodos de análise química, mineralógica e física de solos do IAC. Campinas: Instituto Agronômico de Campinas, 1986. p. 94.
CAMARGO, M. N.; KLANT, E.; KAUFFMAN, J. H. Classificação de Solos usada em Levantamentos Pedológicos no Brasil.Bol. Inf. SBCS, v. 12, p. 11-13, 1987.
CEZAR, E.et al. Estimativa de atributos do solo por meio de espectrorradiometria difusa.Revista Brasileira de Ciencia do Solo, v. 37, n. 4, p. 858-868, 2013.
CHANG, C. et al. Nearinfrared recleftance spetroscopy -Principal components regression analysis os soil properties. Soil Science Society of America Journal, v. 65, n. 2, p. 480-490, 2001.
COLEMAN, T.L.; AGBU, P.A.; MONTGOMERY, O.L.; GAOT, T. & PRASAD, S. Spectral band selection for quantifying selected properties in highly weathered soils. Soil Science, v. 151, p.355-361, 1991.
DEMATTÊ, J. A. M.; GARCIA, G. J. Alteration of soil properties through a weathering sequence as evaluated by spectral reflectance. Soil Science Society of America Journal, v. 63, n. 2, p. 327-342, 1999.
DUNN, B. W. et al. The potential of near-infrared reflectance spectroscopy for soil analysis - a case study from the Riverine Plain of south-eastern Australia. Australian Journal of Experimental Agriculture, v. 42, n. 5, p. 607-614, 2002.
EMPRESA BRASILEIRA DE PESQUISA AGROPECUÁRIA. Sistema brasileiro de classificação de solos. 2. ed. Rio de Janeiro: Embrapa Solos, 2006. p. 306.
GHOLIZADE, A.et al. Visible and near infrared reflectance spectroscopy to determine chemical properties of paddy soils. Journal of Food, Agriculture and Environment, v. 11, n. 2, p. 859-866, 2013.
GLANTZ, S. A.; SLINKER, B. K. Primer of applied regression and analysis of variance. New York: MacGraw-Hill, 1990. p. 320.
HUETE, A. R.; ESCADAFAL, R. Assessment of biophysical soil properties through spectral decomposition techniques.
Remote Sensing of Environment. v. 35 n. 2/3, p. 149-159, 1991.
ISLAM, K.; SINGH, B.; McBRATNEY, A. B. Simultaneous estimation of several soil properties by ultra-violet, visible, and near-infrared reflectance spectroscopy. Australian Journal of Soil Research, v. 41, n. 6, p. 1101-1114, 2003.
KOBAYASHI, K.; SALAM, M. U. Comparing simulated and measured values using mean squared deviation and its components. Agronomy Journal, v. 92, n. 2, p. 345-352, 2000.
KUANG, B.; MOUAZEN, A. M. Influence of the number of samples on prediction error of visible and near infrared spectroscopy of selected soil properties at the farm scale. European Journal of Soil Science, v. 63, n. 3, p. 421-429, 2012.
LAGACHERIE, P.et al. Estimation of soil clay and calcium carbonate using laboratory, field and airborne hyperspectral measurements.Remote Sensing of Environmental, v. 112, n. 3, p. 825-835, 2008.
LEONE, A. P.et. al. Prediction of Soil Properties with PLSR and vis- NIR Spectroscopy: Application to Mediterranean Soils from Southern Italy. Current Analytical Chemistry, v. 8, n. 2, p. 283-299, 2012.
LOBELL, D. B.; ASNER, G. P. Moisture Effects on Soil Reflectance.Soil Science Society of America Journal, v. 66, n. 3, p. 722-727, 2002.
NANNI, M. R.; DEMATTÊ, J. A. M. Spectral methodology in comparison to traditional soil analysis.Soil Science Society of America Journal, v. 70, n. 2, p. 393-407, 2006.
PROBERT, M. E.et al. APSIM’s water and nitrogen modules and simulation of the dynamics of water and nitrogen in follow systems.Agricultural Systems, v. 56, n. 1, p. 1-28, 1998.
RAIJ, B. Van. et al. Análise Química para Avaliação da Fertilidade de Solos Tropicais. Campinas: Instituto Agronômico de Campinas, 2001. p. 285.
SHEPHERD, K. D.; WALSH, M. G. Development of Reflectance Spectral Libraries for Characterization of Soil Properties. Soil Science Society of America Journal, v. 66, n. 3, p. 988-998, 2002.
SOUSA JUNIOR, J. G.; DEMATTÊ, J. A. M.; ARAÚJO, S. R. Modelos espectrais terrestres e orbitais na determinação de teores de atributos dos solos: potencial e custos. Bragantia, v. 7, n. 3, p. 610-621, 2011.
STARK, E.; LUCHTER, K.; MARGOSHES, M. Near-infrared analysis (NIRA): A technology for quantitative and qualitative analysis. Applied Spectroscopy Reviews, v. 22, n. 4, p. 335-399, 1986.
VISCARRA ROSSEL, R. A. et al. Visible, near infrared, mid-infrared or combined diffuse reflectance spectroscopy for simultaneous assessment of various soil properties. Geoderma, v. 31, n. 1/2, p. 59-75, 2006.
VISCARRA ROSSEL, R. A. et al. On the soil information content of visible- near infrared reflectance spectra.European Journal of Soil Science,v. 62, n. 3, p. 442-453, 2011.
VISCARRA ROSSEL, R. A.; WEBSTER, R. Predicting soil properties from the Australian soil visible- near infrared spectroscopic database.European Journal of Soil Science, v. 63, n. 6, p. 848-860, 2012.
VOLKAN BILGILI, A.; van ES, H.M.; AKBAS, F.; DURAK, A.; HIVELY, W.D. Visible-near infrared reflectance spectroscopy for assessment of soil properties in a semiarid area of Turkey.Journal of Arid Environments, v. 74, p. 229-238, 2010.
WOLSCHICK, D.et al. Implementação e teste de um modelo mecanístico de simulação do crescimento e desenvolvimento de plantas de milho. Revista Brasileira de Engenharia Agricola e Ambiental, v. 11, n. 3, p. 271-278, 2007.