1 Master’s and Doctoral Programs in Physical Therapy, Universidade Cidade de São Paulo (UNICID), São Paulo, SP, Brazil 2 Physical Therapy Program, União Metropolitana de Ensino e Cultura (UNIME), Itabuna, BA, Brazil
3 Undergraduate Course in Physical Therapy, UNICID, São Paulo, SP, Brazil
Received: 10/12/2012 Revised: 12/15/2012 Accepted: 02/20/2013
a r t i c l e
The work ability index and functional
capacity among older workers
Rosimeire S. Padula1, Maria L. C. Comper1,2, Suzana A. Moraes1, Catherine Sabbagh3, Wagner Pagliato Junior3, Monica R. Perracini1
ABSTRACT | Background: Decreases in functional ability due to aging can impair work capacity and productivity among older workers. Objective: This study compares the sociodemographics, health conditions, and physical functioning abilities of young and old workers as well as correlates of physical functioning capacity with the work ability index (WAI). Method: This exploratory, cross-sectional study examined employees of a higher education institution (HEI) and those of a metallurgical industry. Older workers (50 years old or above) were matched for gender and occupation type with younger workers (less than 50 years old). The following evaluations were applied: the multidimensional assessment questionnaire (which included sociodemographic, clinical, health perception, and physical health indices), the WAI, and a battery of physical functional tests. Results: Diseases and regularly used medications were more common among the group of aging workers. The WAI did not differ between groups (p=0.237). Both groups showed similar physical functional capacity performances with regard to walking speed, muscle strength, and lower limb physical functioning. Aging workers showed a poorer performance on a test of right-leg support (p=0.004). The WAI was moderately correlated with the sit-to-stand test among older female workers (r=0.573, p=0.051). Conclusions: Unfavorable general health conditions did not affect the assessment of work ability or most of the tests of physical functional capacity in the aging group.
Keywords: aging; work; occupational health; work ability; functional capacity; physical therapy.
HOW TO CITE THIS ARTICLE
Padula RS, Comper MLC, Moraes SA, Sabbagh C, Pagliato Junior W, Perracini MR. The work ability index and functional capacity among older workers. Braz J Phys Ther. 2013 July-Aug; 17(4):382-391. http://dx.doi.org/10.1590/S1413-35552012005000107
Introduction
The modern workforce is aging, and older people represent a growing proportion of the population1. The
segment of workers 50 years old or older is estimated to increase quickly over the next decades2,3. In 2000,
3.3 million people over the age of 60 worked, and this number rose to 5.4 million in 20104. In 2006,
54% of all Brazilian workers were 60 years old or older, and approximately 70% of the elderly had some occupational activity in 20094.
Aging is characterized by a reduction in the functional reserve of several physiological systems5,
and its effect on functionality depends on numerous factors such as genetics, lifestyle habits, and the presence of chronic diseases6. A decline in work
ability of approximately 12% per year7 is estimated to
occur after 45 years of age, in particular after 50 years of age8. This decline can compromise productivity
and the ability to work9. In general, this effect is
greater among employees of jobs with high physical demands than jobs with higher mental demands5. The
prevalence of work ability impairment varies between 5.7% and 46.4% depending on the population and the type of work performed10.
Socioeconomic conditions are important predictors of health and work ability. However, these models
are complex and inluenced by factors related to the
work itself, living conditions, and health habits11.
The presence of psychological symptoms, chronic diseases, and poor health perceptions are negatively correlated with work ability12.
Studies have shown that workers who are involved in occupational physical activities (whether moderate or vigorous) maintain their levels of work ability,
especially when these activities involve speciic tasks.
whereas workers in poorer health tend to retire early or are transferred to occupations with fewer physical demands13.
Despite these indings, the general health conditions
of older workers compared with younger workers and the correlation between work ability and physical functional capacity have been seldom explored. Thus, this study compared the sociodemographic
proiles, health conditions, and physical functional
capacities of young and old workers and correlated physical functional capacity measurements with the work ability index (WAI).
Method
Study design
This exploratory, cross-sectional study examined employees from a higher education institution (HEI) and those from a factory related to the metallurgical industry.
This study is part of a larger project entitled,
“Inluência do Envelhecimento e da Experiência
Profissional no Desempenho Físico, Aspectos Biopsicossociais e Estratégias Motoras de Trabalhadores” (“The Influence of Aging and Professional Experience on the Physical Performance, Biopsychological Aspects, and Motor Strategies of Workers”) and was approved by MCT/CNPQ/CT (Health Public Notice 58/2009; Aging, Work, and Health; case number 557752/2009-4). The “Rede de estudos sobre envelhecimento, trabalho e saúde” (“Study Network on Aging, Work, and Health”) developed this project.
Participants
A convenience sample was recruited in which all older workers (at least 50 years old) were invited to participate in the study and were matched with younger workers with respect to gender and occupation (under 50 years old).
All participants were informed about the study objectives and procedures and were invited to volunteer by signing a consent form approved by the Ethics Committee of the Universidade Cidade de São Paulo (UNICID), São Paulo, SP, Brazil (protocol number 0048.1.186.000-10).
Group characteristics
Higher Education Institution (HEI)
The participants of this group belonged to a private HEI located in São Paulo, SP, Brazil. Their common job activities were academic or administrative, with 8-hour workdays. These employees commuted to and from work via public transportation (i.e., subway, train, or bus).
Metallurgical factory
Over 80% of these workers performed tasks that required the use of force, load handling, quality control, and production. These employees commuted to and from work via bicycle or walking; only those who lived far away used the bus provided by the metallurgical company.
Data collection
Instruments
The following measures were used: a multidimensional questionnaire that evaluated sociodemographic, clinical (i.e., the number of illnesses and medications), health perception, and physical health data; the WAI; and a battery of physical functional tests. A physical therapist and final-year students performed these evaluations; they also discussed the study and received training concerning evaluation and the study criteria.
Physical Health. Physical healthwas evaluated using the Subjective Health or Self-rated Health. The individual uses this measure to rank their perceptions of and care for their own health as “very good”, “good”, “regular”, “poor”, or “very poor”. Next, they rank their health compared with that of their same-age peers 1 year ago as “equal to”, “better than”, or “worse”.
WAI. The WAI measures worker ability using questions that consider the physical and mental demands of their work, health conditions, and resources. Work ability is classified into four categories: Scores ranging from 7 to 27 denote poor ability; 28 to 36 represent fair ability; 37 to 43 represent good ability; and 44 to 49 denote excellent ability14.
Physical functioning tests
sit-to-stand, ive-step, right and left unipedal stance,
and handgrip strength (HGS) tests. All tests were measured using a digital chronometer (Cronobio model SW2018).
Usual and Maximum Gait Speed. An 8.6-m lat
surface with no irregularities was used. The initial
2 meters were used for acceleration, and the inal
2 meters were used for deceleration; the time spent traveling the remaining 4.6 meters was recorded. All participants wore shoes. For the usual gait speed test, the participants were told to “Walk at your normal pace, as if walking down the street to purchase something at the bakery. Walk to the last mark on
the loor”. For the maximum gait speed test, the
participants were told to “Walk as fast as possible without running”. These procedures were repeated three times, and the mean was computed.
Unipedal Stance Test. This test records the time a participant spends standing on one foot with their eyes open15. The individuals were instructed to keep
their feet parallel, with a 10-cm distance between their heels, and their arms parallel to their bodies while
looking straight ahead. Next, they lifted a speciic leg
without altering their base or touching their support leg. The time that the participants were able to remain in this unipedal stance was recorded (maximum=30 seconds). The timer was stopped when older workers displaced their support foot, touched their other leg, or returned their raised foot to the ground. This test was performed for each leg, and the mean of three trials was used.
Five-Step Test. This test measures the time
that it takes individuals to climb a 10-cm step ive
times while facing forward and return while facing backward16. The participants begin with the verbal
command “go”. Time was only recorded when the
participants performed the task as speciied. Hand Grip Strength Test. This isometric strength test measures the maximum effort maintained for 6 seconds of the dominant upper limb. To identify the dominant limb, the participants were asked which hand had greater dexterity. Individuals were positioned according to the recommendations of the
American Society of Hand Therapy17. Grip strength
was measured using the second handle position of
a dynamometer (SAEHAN® model - SH 5001).
Strength scores (kgf) were calculated using the mean of three trials, with a 60-second rest between each
trial. Verbal encouragement was provided to ensure maximum effort when tightening the handle18.
Sit-to-Stand Test. The participants were instructed to stand up and sit down in an armless chair of normal height (approximately 46 cm) while keeping their arms crossed over their chest as quickly as possible. The time was recorded, and the timer stopped when individuals returned to a sitting position.
Anthropometric data
The anthropometric data were measured using a standardized digital scale (G-Tech, model GLASS 3S) and a standard measuring tape (Inmetro). To record body mass, the participants wore light clothing without shoes, preferably with empty stomachs and bladders.
Height was measured using a wall-mounted ruler. The participants stood upright and looked straight ahead, with their bare feet together. Waist circumference was measured in the supine position at the midpoint between the anterior-superior iliac spine, and the coastal margin was determined on the lateral side of the abdomen. The measuring tape was placed next to the umbilical scar19. Hip circumference
was measured at the widest part of the hips.
The waist-to-hip ratio (WHR) was obtained by dividing the perimeter of the waist and the hips. Body mass index (BMI) was calculated by dividing body mass by height squared (BMI=weight/height2).
The ranges established by the Pan American Health Organization for BMI cut-off points of underweight, normal weight, overweight, and obese were <23, 23-27.99, 28-29.99, and >30, respectively. These cut-off points were used to interpret the results.
Procedure
Afterwards, all older workers were identiied.
Younger workers from both companies were randomly selected and stratified by gender and occupation type as a comparison group.
Data analyses
Descriptive analyses were performed using frequencies for categorical variables and measures of central tendency for each age group, WAI score, and physical functioning capacity. Normality was tested using the Kolmogorov-Smirnov test and histograms with normal distribution curves.
The older workers were compared with the younger workers with respect to the variables of interest using the chi-square test or Fisher’s exact test (categorical variables) and Student’s t-test or Mann-Whitney U test (continuous variables).
The relationship between the WAI and the physical functioning tests was measured using
Pearson’s correlation. The level of signiicance was
p<0.05. All tests were performed using SPSS version 19.0 (IBM).
Results
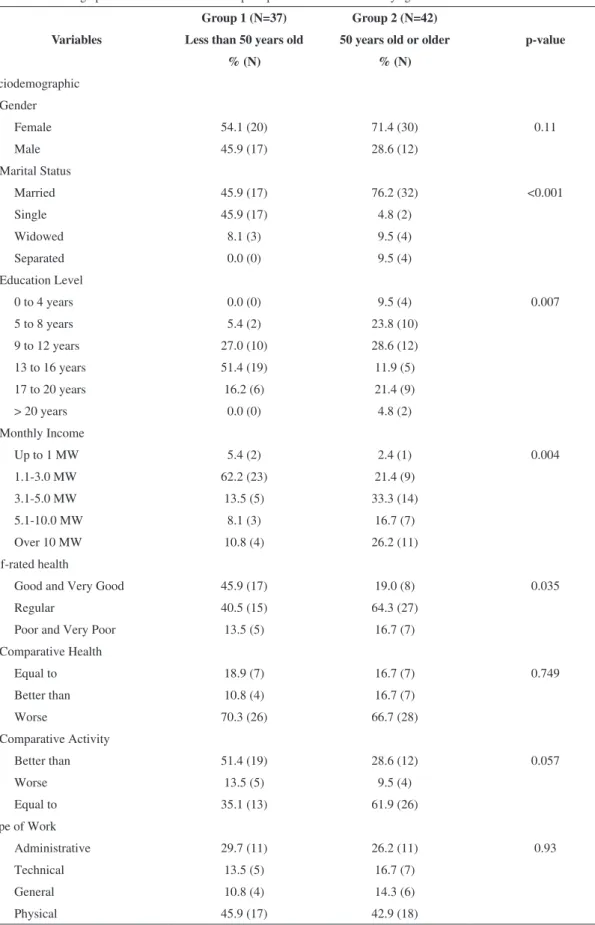
The means ± standard deviations of age for the younger and older groups were 31.9±8.1 years and 54.4±4.3 years, respectively. Table 1 displays the sociodemographic characteristics of the two groups. Of the variables analyzed, the groups differed with regard to marital status, years of education, monthly income, and self-reports of overall health (p<0.05).
The clinical characteristics, and anthropometric
measures (Table 2) signiicantly differed between
groups (p<0.05). Diseases and regularly used medications were more frequent among the older group. The WHR measurements were inversely proportional between the groups, such that the older group had greater values in the upper quartile.
Signiicant differences were not found with regard
to BMI (p>0.05).
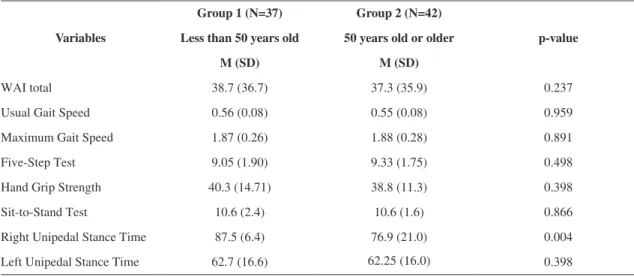
In general, work ability and physical functioning
did not signiicantly differ between groups. Only the right unipedal stance was signiicantly different, with
the younger group able to stand in that position for a longer time on average (Table 3).
Figure 1 shows the distribution of WAI scores. Although the mean WAI score was greater for the
younger group, this difference was not signiicant.
Most workers had fair (28 to 36) or good work abilities (37 to 42), regardless of group.
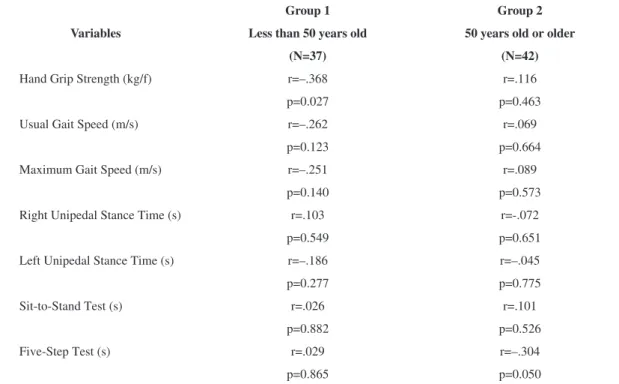
Overall, the relationship between physical functioning capacity and work ability was not
signiicant, with the exception of a weak correlation
of HGS for the younger group (r=–0.368), and the Five-Step test for the older group (r=–0.304) (Table 4). Regarding gender, a moderate correlation (r=0.573) was observed between the WAI and the sit-to-stand test among older females (p=0.051).
Discussion
This study compared young and older workers
with regard to their sociodemographic proiles, health
conditions, and physical functional capacities and correlated physical functioning measurements with
the WAI. This study was justiied given the dearth
of studies that have investigated the relationship between the changes that result from aging and maintaining the ability to work.
In general, older workers were married, had more education and more income, and held poorer global health perceptions compared with the younger workers. Approximately 80% of the participants in the older group reported having a global health of normal, poor, or very poor, and they reported more diseases and regular medication use than younger workers. Older workers had greater BMIs
and signiicantly larger waist circumferences. Most older workers (73.9%) were classiied in the upper
half of WHR.
Differences in WAI were not observed between younger and older workers. The physical functional capacity of younger and older workers was similar with regard to gait speed, muscle strength, and the physical functioning of their legs. Older workers performed worse on the unipedal stance test. WAI scores were only correlated with the sit-to-stand test among older women.
Education and income were directly related, and both were positively correlated with work ability. This result occurred because a higher educational
level creates an access to more qualiied positions
with higher wages and a greater possibility of continuity at an older age. In turn, these aspects
positively inluence health conditions and maintain
the ability to work for longer periods10,20. Studies
of older workers6,21 have shown that those with
Table 1. Sociodemographic characteristics and health perceptions of the 79 workers by age.
Variables
Group 1 (N=37) Group 2 (N=42)
p-value Less than 50 years old 50 years old or older
% (N) % (N)
Sociodemographic Gender
Female 54.1 (20) 71.4 (30) 0.11
Male 45.9 (17) 28.6 (12)
Marital Status
Married 45.9 (17) 76.2 (32) <0.001
Single 45.9 (17) 4.8 (2)
Widowed 8.1 (3) 9.5 (4)
Separated 0.0 (0) 9.5 (4)
Education Level
0 to 4 years 0.0 (0) 9.5 (4) 0.007
5 to 8 years 5.4 (2) 23.8 (10)
9 to 12 years 27.0 (10) 28.6 (12)
13 to 16 years 51.4 (19) 11.9 (5)
17 to 20 years 16.2 (6) 21.4 (9)
> 20 years 0.0 (0) 4.8 (2)
Monthly Income
Up to 1 MW 5.4 (2) 2.4 (1) 0.004
1.1-3.0 MW 62.2 (23) 21.4 (9)
3.1-5.0 MW 13.5 (5) 33.3 (14)
5.1-10.0 MW 8.1 (3) 16.7 (7)
Over 10 MW 10.8 (4) 26.2 (11)
Self-rated health
Good and Very Good 45.9 (17) 19.0 (8) 0.035
Regular 40.5 (15) 64.3 (27)
Poor and Very Poor 13.5 (5) 16.7 (7)
Comparative Health
Equal to 18.9 (7) 16.7 (7) 0.749
Better than 10.8 (4) 16.7 (7)
Worse 70.3 (26) 66.7 (28)
Comparative Activity
Better than 51.4 (19) 28.6 (12) 0.057
Worse 13.5 (5) 9.5 (4)
Equal to 35.1 (13) 61.9 (26)
Type of Work
Administrative 29.7 (11) 26.2 (11) 0.93
Technical 13.5 (5) 16.7 (7)
General 10.8 (4) 14.3 (6)
Physical 45.9 (17) 42.9 (18)
Table 2. Clinical and anthropometric characteristics of the 79 workers by age.
Variables
Group 1 (N=37) Group 2 (N=42)
p-value Less than 50 years old
% (N)
50 years old or older % (N)
Number of diseases 0.001
No disease 78.4 (29) 38.1 (16)
1 to 2 21.6 (8) 54.8 (23)
3 or more 0.0 (0) 7.1 (3)
Number of Medications 0.011
No medication 64.9 (24) 31.0 (13)
1 to 3 32.4 (12) 64.3 (27)
4 or more 2.7 (1) 4.8 (2)
BMI (mean, SD) 25.4 (4.1) 27.2 (3.5) 0.046
BMI Category
Underweight 2.7 (1) 0.0 (0) 0.332
Normal 43.2 (16) 28.6 (12)
Overweight 40.5 (15) 50.0 (21)
Obese 13.5 (5) 21.4 (9)
WHR
1st Quartile (<0.81) 43.2 (16) 9.5 (4) <0.001
2nd Quartile (0.81-0.88) 32.4 (12) 16.7 (7)
3rd Quartile (0.88-0.94) 18.9 (7) 31.0 (13)
4th Quartile (>0.94) 5.4 (2) 42.9 (18)
Waist Circumference (mean, SD) 82.7 (8.9) 91.0 (13.1) 0.002
Table 3. Means and standard deviations of the WAI and physical functioning variables by age.
Variables
Group 1 (N=37) Group 2 (N=42)
p-value Less than 50 years old 50 years old or older
M (SD) M (SD)
WAI total 38.7 (36.7) 37.3 (35.9) 0.237
Usual Gait Speed 0.56 (0.08) 0.55 (0.08) 0.959
Maximum Gait Speed 1.87 (0.26) 1.88 (0.28) 0.891
Five-Step Test 9.05 (1.90) 9.33 (1.75) 0.498
Hand Grip Strength 40.3 (14.71) 38.8 (11.3) 0.398
Sit-to-Stand Test 10.6 (2.4) 10.6 (1.6) 0.866
Right Unipedal Stance Time 87.5 (6.4) 76.9 (21.0) 0.004
those who are poorer and less educated, regardless of age. Furthermore, this latter group is more likely to become physically and psychologically frail with age6.
Although older workers assessed their ability to work as moderate or good (similar to younger workers), importantly, their self-assessment of health
was signiicantly worse than that of the younger
workers. Health self-assessments are broader representations of the health conditions of older people, and they are more representative of global health than functional disabilities or physical and mental symptoms22. In addition, a self-assessment of
poor health is related to a higher mortality rate among individuals with cardiovascular disease23; in turn,
this disease was related to poor body compositions, higher BMIs, greater waist circumferences, and greater WHR among older workers. These indicators are associated with higher mortality rates among different populations of middle-aged individuals and older workers24.
Most workers had fair to good work ability evaluations, regardless of age. The results revealed
that older workers with better qualiications and
higher monthly incomes tended to maintain their ability to work, even in the presence of disease. However, the mediating effect of income and education on work ability remains inconclusive. A previous study followed a group of educators
for 2 years and did not ind an association between
work ability and sociodemographic variables25. In
that study, other internal (i.e., functional capacity, knowledge, skills, values, and attitudes) and external
Table 4. Correlations between work ability and physical functioning capacities in younger and older workers.
Variables
Group 1 Group 2
Less than 50 years old 50 years old or older
(N=37) (N=42)
Hand Grip Strength (kg/f) r=–.368 r=.116
p=0.027 p=0.463
Usual Gait Speed (m/s) r=–.262 r=.069
p=0.123 p=0.664
Maximum Gait Speed (m/s) r=–.251 r=.089
p=0.140 p=0.573
Right Unipedal Stance Time (s) r=.103 r=-.072
p=0.549 p=0.651
Left Unipedal Stance Time (s) r=–.186 r=–.045
p=0.277 p=0.775
Sit-to-Stand Test (s) r=.026 r=.101
p=0.882 p=0.526
Five-Step Test (s) r=.029 r=–.304
p=0.865 p=0.050
Pearson’s correlation: one missing value in the group of younger workers.
factors (i.e., environment, context, and work
demands) inluenced work ability20.
In general, physical functioning capacity did
not signiicantly differ between groups. The older
workers only demonstrated a worse performance on the right unipedal stance test; however, this result was not correlated with work ability. Performance on the unipedal stance test declines with age, and it is an important early marker of the loss of balance and muscle strength8. The inding that the
older workers were relatively younger than those of studies that involved an elderly population (i.e., 60 years or older) might also explain the lack of differences between the performance of younger and older workers. According to the Committee for Economic Development’s New Opportunities for Older Workers, an older worker is anyone who is at least 45 years old. This proposition is mostly based on demographics and socioeconomic factors, but also
relects the decline in the physiological systems due to age, which might have inluenced the unipedal stance
test that requires a good neuromuscular functional reserve. In addition, our results support the healthy worker effect, which states that older workers tend to maintain acceptable levels of functionality26.
An association between physical functioning capacity and WAI was not observed. This result differs from Nygard et al.27 who found an association
between functional capacity and work ability among municipal workers and older workers in Finland. In our study, we observed a moderate correlation between WAI and sit-to-stand test among older female workers. This specific test is strongly correlated with leg functionality, plantar cutaneous sensation, speed, body stability, and psychological variables. In addition to muscle strength, several of these parameters decline with age28; however, no
signiicant differences have been observed between
males and females with regard to the sit-to-stand test29.
The strong inluence of the type of work activity
with regard to physical functioning capacity and work ability must also be considered. The physical and psychological demands of an activity greatly influence the psychophysiological responses of workers and the perceptions of their abilities25,30.
The results of our study suggest that although older workers positively assess their ability to work, they show health indicators that are worse than
those of the younger group, especially with regard to body composition and self-health perceptions both of which are related to higher mortality rates. In addition, older workers exhibited poorer unipedal
stances, which indicates a deicit in balance and
muscle strength. Thus, an early physical activity intervention might prevent long-term global health issues for this group by increasing or maintaining work ability, thereby providing a more active and healthy life in old age. Interventions that are aimed at changing work structure and the organization
can also inluence the WAI, given that they reduce
physical and mental workloads and engender greater satisfaction and a higher quality of life25.
Some methodological limitations exist with regard to the results of this study. This study was cross-sectional, which precludes the establishment of causal relationships between the analyzed factors. In addition, the influence of the healthy worker effect must be considered with regard to the results. This effect arises from the selection and retention of workers with better health and greater productivity in the work environment31; as such, this effect is a
caveat of other studies on work ability32.
Conclusions
Older workers had a poorer self-rated health, a higher BMI, waist circumference and waist-hip ratio, a lower unipedal stance time, also reported more diseases and used more medications compared with younger workers. The poor self-perception of health did not affect did not affect the assessment of work ability or most of the physical functioning capacity tests in older workers. Early preventive interventions are suggested for workers who are at least 50 years old to provide them with an active and healthy life in old age.
References
1. Ilmarinen J. Towards a longer and better working life: a challenge of work force ageing. Med Lav. 2006;97(2):143-7. PMid:17017338.
2. Wajnman S. Tendências prospectivas de crescimento
da população economicamente ativa no Brasil. Belo Horizonte: Centro de Desenvolvimento e Planejamento
Regional, Faculdade de Ciências Econômicas,
3. Costa G, Sartori S. Ageing, working hours and work ability. Ergonomics. 2007;50(11):1914-30. PMid:17972209. http://dx.doi.org/10.1080/00140130701676054
4. Instituto Brasileiro de Geograia e Estatística - IBGE.
Síntese de Indicadores Sociais: Uma análise das condições de vida da população brasileira. IBGE; 2007.
5. Ilmarinen JE. Aging workers. Occup Environ M e d . 2 0 0 1 ; 5 8 ( 8 ) : 5 4 6 - 5 2 . P M i d : 1 1 4 5 2 0 5 3 PMCid:PMC1740170. http://dx.doi.org/10.1136/ oem.58.8.546
6. Guimaraes RM. Health capital, life course and ageing. Gerontology. 2007;53(2):96-101. http://dx.doi. org/10.1159/000096483
7. Hebert R. Functional decline in old age. CMAJ. 1997;157(8):1037-45.
8. Isles RC, Choy NL, Steer M, Nitz JC. Normal values of balance tests in women aged 20-80. J Am Geriatr Soc. 2004;52(8):1367-72. PMid:15271128. http://dx.doi. org/10.1111/j.1532-5415.2004.52370.x
9. Tuomi K, Ilmarinen J, Seitsamo J, Huuhtanen P, Martikainen R, Nygard CH, et al. Summary of the Finnish research project (1981-1992) to promote the health and work ability of aging workers. Scand J Work Environ Health. 1997; Suppl 1:66-71. PMid:9247997.
10. Martinez MC, Latorre MRDO, Fisher FM. Capacidade
para o Trabalho: revisão de literatura. Ciência e Saúde
Coletiva. 2010;15(Suple. 1):1553-61.
11. Aittomaki A, Lahelma E, Roos E. Work conditions and socioeconomic inequalities in work ability. Scand J Work Environ Health. 2003;29(2):159-65. PMid:12718502. http://dx.doi.org/10.5271/sjweh.718
12. Ilmarinen J, Tuomi K. Assessment and promotion of work ability, health and well-being of ageing workers. In: International Symposium on Work Ability: Proceedings of the 2nd International Symposium in Work Ability; 2004 Oct 18-20; Verona, Italy. London: Elsevier; 2005. 13. Kenny GP, Yardley JE, Martineau L, Jay O. Physical work
capacity in older adults: implications for the aging worker. Am J Ind Med. 2008;51(8):610-25. PMid:18543279. http://dx.doi.org/10.1002/ajim.20600
14. Tuomi K, Jahkola A, Katajarinne L, Tulkki A. Índice de Capacidade para o Trabalho. São Carlos: EdUFSCar; 2005.
15. Vellas BJ, Wayne SJ, Romero L, Baumgartner RN, Rubenstein LZ, Garry PJ. One-leg balance is an important predictor of injurious falls in older persons. J Am Geriatr Soc. 1997;45(6):735-8. PMid:9180669.
16. Murphy M, Olson S, Protas E, Overby A. Screening for falls in community-dwelling elderly. J Aging Phys Act. 2003;11:66-80.
17. Crosby CA, Wehbe MA, Mawr B. Hand strength: normative values. J Hand Surg Am. 1994;19(4):665-70. http://dx.doi.org/10.1016/0363-5023(94)90280-1 18. Barbosa AR, Souza JM, Lebrao ML, Laurenti R,
Marucci MF. Anthropometry of elderly residents
in the city of Sao Paulo, Brazil. Cad Saude Publica. 2005;21(6):1929-38. PMid:16410880. http://dx.doi. org/10.1590/S0102-311X2005000600043
19. Cai L, Kalb G. Health status and labour force participation: evidence from Australia. Health Econ. 2006;15(3):241-61. PMid:16229055. http://dx.doi.org/10.1002/hec.1053 20. Sampaio RF, Augusto VG. Envelhecimento e trabalho: um
desaio para a agenda da reabilitação. Rev Bras Fisioter.
2012;16(2):94-101.
21. Neri AL. Qualidade de vida na velhice e subjetividade. In: Neri AL, editor. Qualidade de vida na velhice: Enfoque multidisciplinar. Campinas: Alínea; 2007. p. 1-59. 22. Lima-Costa MF, Cesar CC, Chor D, Proietti FA.
Self-rated health compared with objectively measured health status as a tool for mortality risk screening in older adults: 10-year follow-up of the Bambui Cohort Study of Aging. Am J Epidemiol. 2012;175(3):228-35. http://dx.doi. org/10.1093/aje/kwr290
23. Ernstsen L, Nilsen SM, Espnes GA, Krokstad S. The predictive ability of self-rated health on ischaemic heart disease and all-cause mortality in elderly women and men: the Nord-Trondelag Health Study (HUNT). Age Ageing. 2011;40(1):105-11. PMid:21051445. http:// dx.doi.org/10.1093/ageing/afq141
24. Cabrera MA, Wajngarten M, Gebara OC, Diament J. [Relationship between body mass index, waist circumference, and waist-to-hip ratio and mortality in elderly women: a 5-year follow-up study]. Cad Saúde Pública. 2005;21(3):767-75. PMid:15868034. http:// dx.doi.org/10.1590/S0102-311X2005000300010 25. Marqueze EC, Voltz GP, Borges FN, Moreno CR. A 2-year
follow-up study of work ability among college educators. Appl Ergon. 2008;39(5):640-5. PMid:18377866. http:// dx.doi.org/10.1016/j.apergo.2008.02.002
26. Committee for Economic Development. New opportunities for older workers: A statement on national policy by the Research and Policy Committee of the Committee for Economic Development [Internet]. New York, 1999 [cited 2013 Feb 26]. Available from: http://www.ced.org/pdf/ New-Opportunities-for-Older-Workers.pdf
27. Nygard CH, Eskelinen L, Suvanto S, Tuomi K, Ilmarinen J. Associations between functional capacity and work ability among elderly municipal employees. Scand J Work Environ Health. 1991;Suppl 1:122-7. PMid:1792525. 28. Lord SR, Murray SM, Chapman K, Munro B, Tiedemann
A. Sit-to-stand performance depends on sensation, speed, balance, and psychological status in addition to strength in older people. J Gerontol A Biol Sci Med Sci. 2002;57(8):M539-43. PMid:12145369. http://dx.doi. org/10.1093/gerona/57.8.M539
29. Liang MT, Cameron Chumlea WM. Balance and strength of elderly Chinese men and women. J Nutr Health Aging. 1998;2(1):21-7.
relationships between work ability, thinking of quitting the job, and actual leaving among Italian nurses: a longitudinal study. Int J Nurs Stud. 2008;45(11):1645-59. PMid:18456268. http://dx.doi.org/10.1016/j. ijnurstu.2008.03.002
31. Baillargeon J. Characteristics of the healthy worker effect. Occup Med. 2001;16(2):359-66. PMid:11319057. 32. Martinez MC, Latorre MRDO. Saúde e capacidade
para o trabalho de eletricitários do Estado de São Paulo.
Ciênc Saúde Coletiva. 2008;13(3):1061-73. http://dx.doi.
org/10.1590/S1413-81232008000300029
Correspondence
Mônica Rodrigues Perracini