Evaluation of a computer model to simulate water table response to subirrigation(1)
Jadir Aparecido Rosa(2), Allen George Smajstrla , Kenneth Leonard Campbell(3) and Salvadore Jose Locascio(4)
Abstract – The objective of this work was to evaluate the water flow computer model, WATABLE, using experimental field observations on water table management plots from a site located near Hastings, FL, USA. The experimental field had scale drainage systems with provisions for subirrigation with buried microirrigation and conventional seepage irrigation systems. Potato (Solanum tuberosum L.)
growing seasons from years 1996 and 1997 were used to simulate the hydrology of the area. Water table levels, precipitation, irrigation and runoff volumes were continuously monitored. The model simulated the water movement from a buried microirrigation line source and the response of the water table to irrigation, precipitation, evapotranspiration, and deep percolation. The model was calibrated and verified by comparing simulated results with experimental field observations. The model performed very well in simulating seasonal runoff, irrigation volumes, and water table levels during crop growth. The two-dimensional model can be used to investigate different irrigation strategies involving water table management control. Applications of the model include optimization of the water table depth for each growth stage, and duration, frequency, and rate of irrigation.
Index terms: Solanum tuberosum, drainage, irrigation methods.
Avaliação de um modelo computacional para simular a resposta do lençol freático à subirrigação
Resumo – O objetivo deste trabalho foi avaliar o modelo computacional WATABLE usando-se dados de campo obtidos em uma área experimental em manejo de lençol freático, localizada em Hastings, FL, EUA. Na área experimental, estavam instalados um sistema de drenagem e sistemas de irrigação por subsuperfície com irrigação localizada e por canais. Ciclos de cultivo de batata (Solanum tuberosum L.),
nos anos de 1996 e 1997, foram usados para a simulação da hidrologia da área. Profundidades do lençol freático, chuvas, irrigação e escorrimento superficial foram monitorados constantemente. O modelo simulou o movimento da água a partir de uma linha de irrigação localizada enterrada, e a resposta do nível do lençol à irrigação, precipitação, evapotranspiração e percolação profunda. O modelo foi calibrado e avaliado comparando-se os resultados simulados com os dados de campo, obtendo-se um desempenho bastante satisfatório na simulação dos volumes de escorrimento superficial e de irrigação, e dos níveis do lençol freático durante o ciclo da cultura. O modelo pode ser usado para pesquisar diferentes estratégias no manejo da irrigação envolvendo manejo do lençol freático. Aplicações do modelo incluem a otimização da profundidade do lençol freático para cada estádio de desenvolvimento da cultura, e da duração, freqüência e quantidade de água para irrigação a ser aplicada.
Termos para indexação: Solanum tuberosum, drenagem, métodos de irrigação.
Introduction
The use of water table management practices to help maintain agricultural productivity and profitabil-ity, without causing any degradation of water qual-ity, is important in most areas in the United States. Water table control has been practiced for many years in various locations, such as Florida, in both the sandy flatwoods soils (Campbell et al., 1974; Pitts et al., 1993) and the organic soils near the Everglades (Snyder et al., 1978), in the Lower Mississippi Valley
(1)Accepted for publication on July 11, 2002.
Extracted from the Ph.D. thesis presented by the first author to the University of Florida, Gainesville, Florida, USA.
(2)Instituto Agronômico do Paraná, Área de Engenharia
Agrícola, Polo Regional de Ponta Grossa, Caixa Postal 129, CEP 84001-970 Ponta Grossa, PR, Brazil. E-mail: [email protected]
(3)University of Florida, Agricultural and Biological Engineering
Department, PO Box 110570, Gainesville, Florida, 36511-0570 USA. E-mail: [email protected]
(4)University of Florida, Horticultural Sciences Department,
PO Box 110690, Gainesville, Florida, 36511-0690 USA. E-mail: [email protected]
University of Florida, Agricultural and Biological Engineering Department. In memorian.
(†)
(Bengtson et al., 1993), in the Georgia Flatwoods (Shirmohammadi et al., 1991; Johnson Junior et al., 1993), in the Coastal Plain Soils of Virginia and North Carolina (Evans & Skaggs, 1989), in the organic soils of the Great Lake States of Michigan, Indiana, Ohio, and Minnesota, and in the Sacramento-San Joaquin Delta, in Central California (Fouss et al., 1990). Some of these applications date back to the 1920’s. Water table control is also practiced in other countries: Brazil (Rosa, 1993), Egypt (Kandil & Willardson, 1992), Canada (Madramootoo et al., 1993; Prasher et al., 1994), and Nigeria (Nwadukwe et al., 1989).
Most water table management systems are currently designed to hold the water level at a constant level from the soil surface with only minor changes in its position occurring due to diurnal variations in evapotranspiration. It is known that controlling the system such that the water table is allowed to fluctuate within prescribed limits could minimize runoff and excess drainage. In such a system, the water table would be allowed to fall due to evapotranspiration until it reaches a depth that could no longer supply adequate water to the root zone. At this point, the pump would be started and the water table raised to some maximum height that would not interfere with plant growth. Then, the pump would be turned off and the cycle repeated.
In Northeast Florida, potatoes are grown on beds in soils that require irrigation even in the presence of natural high water tables. Most potato fields are irrigated using conventional semi-closed seepage systems that are not as efficient as most other irrigation methods (Smajstrla et al., 1991). Clark et al. (1990) introduced the concept of a fully enclosed subirrigation (FES) system as a water application method for subirrigation purposes on Florida flatwoods soils. The FES system used drip irrigation tubing buried 10 cm deep as water conveyance. They reported reduced runoff rates and reduced irrigation requirements with FES as compared to conventional semi-closed seepage irrigation systems for vegetable crops in South Florida.
Stanley & Clark (1991) and Clark & Stanley (1992) studied the feasibility of using FES (substituting for open lateral ditches) as a means of water conveyance for subirrigation. They reported that the application rates with FES represent a 30%-40% water savings
when compared to rates commonly used for ditch-conveyed seepage irrigation.
A feasibility study of FES was conducted by Smajstrla et al. (2000) in potatoes, in Northeast Florida. The FES system was improved by automatically controlling the irrigation according to the depth of the water table to be maintained. They found a reduction of 36% in water applied with FES compared to ditch-conveyed seepage irrigation, in a three-year experiment without any change in crop yield.
A computer simulation model, WATABLE, was developed (Rosa, 2000) to simulate the movement of water during water table management practices with subirrigation from a buried microirrigation line source. The accuracy of the model in simulating infiltration and redistribution of soil water was determined by comparison with other computer simulations from the literature and experimental observations.
The objective of this work was to evaluate the water flow computer model, WATABLE, using experimental field observations on water table management plots.
Material and Methods
Field data from a research project were used to calibrate and verify the mathematical model WATABLE. The main objective of the research project was to conduct a field-scale study of the use of automatically-controlled subirrigation with buried microirrigation line sources to control field water tables as compared to conventional seepage irrigation (Smajstrla et al., 2000). Field research plots installed at the University of Florida Hastings Agricultural Research Center Yelvington Farm were used in this research.
Potatoes (Solanum tuberosum)were produced during
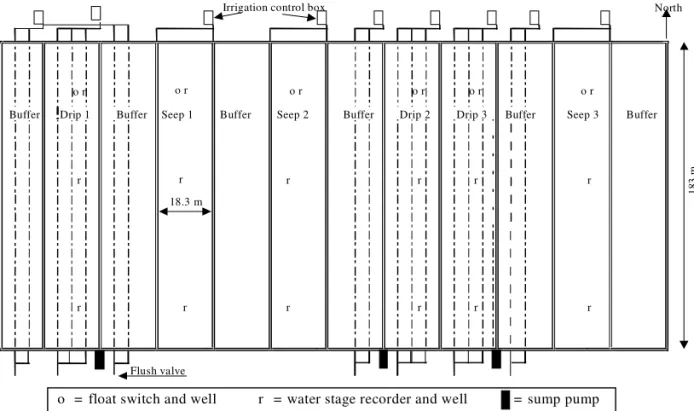
the 1995, 1996, and 1997 spring growing seasons. Field scale research plots 18.3 m wide and 183 m long were used (Figure 1). The soil type was Placid Fine Sand (Typic Humaquepts), a typical high water table soil of the area. Field operations for potato production followed typical grower practices in the area. A cover crop of sorghum sudan was grown during the summer and early fall months each year to increase the soil organic matter. Details on potato production practices were presented by Smajstrla et al. (2000).
extended the 183 m length of the beds, and buried to a depth of about 0.5 m. Each group of three laterals per bed was connected with a polyethylene manifold pipeline at each end of the field. Details on the subirrigation system were presented by Smajstrla et al. (2000).
Irrigation of each of the plots was independently controlled with a float-actuated mercury tilt switch located in a shallow well about 18 m from the upper end of each plot. Float switches were initially set to schedule irrigation to maintain the field water table about 0.5 m below the top of the plant row. When the water table dropped below 0.5 m, the microswitch closed, providing power to the solenoid valve for irrigation. When the water table rose above 0.5 m, the microswitch opened, and irrigation was stopped. Actually, the switches were set with a 1.2 cm lag between turn-on and turn-off to prevent the irrigation system from cycling excessively, while maintaining adequate soil water levels for plant growth. Buffer areas were irrigated at the same times as the adjacent treatment plot. In stages during the season, threshold water table levels were reset to lower values to follow the root crop growth. Irrigation volumes applied were monitored with totalizing flow meters at the irrigation pump, at the inlet to each field plot, and at the flush valves. Irrigation occurrences and durations were recorded with event
counters and timers. Data were recorded from the beginning of irrigation at plant emergence until irrigation was discontinued about one week before plant harvest each year.
Runoff from one water furrow in each of the experimental plots was measured throughout the growing season. A sump was installed at the outlet in each water furrow and water was collected in the sumps by gravity flow. Water was pumped out of the sumps using sump pumps, and volumes were measured using flow meters. Timers and event counters also were installed to measure time of pumping and number of events.
Saturated hydraulic conductivity (Ks) was determined with a field method. Although laboratory data were available, they were not directly used because they often show little or no correlation with field values (FAO, 1980). A low-cost and easy-to-use device for measuring saturated hydraulic conductivity with the auger-hole method was used (Rosa & Smajstrla, 1999). The estimated overall value of Ks for the experimental area was about 7.8 cm h-1.
To estimate potential evapotranspiration and to record rainfall, a weather station was installed and climate data were measured. At the field site, rainfall, maximum and minimum temperatures, and wind speed were measured. Solar radiation was measured at the Hastings Research
Irrigation control box
o r o r o r o r o r o r
Buffer Drip 1 Buffer Seep 1 Buffer Seep 2 Buffer Drip 2 Drip 3 Buffer Seep 3 Buffer
r r r r r r
18.3 m 18
3 m
r r r r r r
Flush valve
o = float switch and well r = water stage recorder and well = sump pump
North
and Education Center headquarters building, appro-ximately 8 km from the field research site. Potential evapotranspiration for each simulated season was calculated from the Penman (1948) equation, using daily values of solar radiation, temperature and wind speed.
Results and Discussion
Data from the Hastings field research project were used during model development, for initial evaluation of the model and for calibration of some parameters. Water table position prediction was the goal of the model. All the efforts in the calibration process were done to improve the model representation of the drainage and wetting (precipitation and irrigation) phases.
The calibration of the model was done using data from February to May 1996, the length of the irrigated potato season. Irrigation and runoff volumes and water table elevations were the data used in the process.
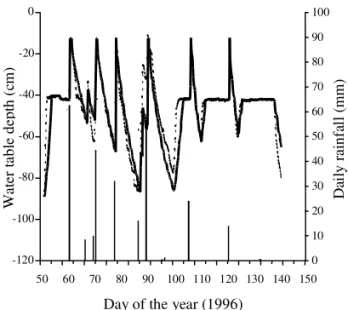
The potato crop was planted on February 6 (day of the year, DOY, 37) and harvested on May 20 (DOY 141). The calibration period ran from February 20 (DOY 51) to May 19 (DOY 140) in the year 1996. The continuous field and simulated water tables for the calibration period are shown in Figure 2. The figure also shows daily rainfall events as a bar graph
overlay. The peaks in the simulated water table were more pronounced than in the observed water table, especially for the last storm, when the simulated water table response was faster than the observed water table. It seems that when the antecedent water table was high and the soil profile was practically saturated, the soil hydraulic properties better represented the real conditions in the field. On the other hand, if the water table was low, the soil hydraulic properties did not represent the field conditions very well, and the response to precipitation and irrigation was not adequate, a consequence of the rapid decrease in hydraulic conductivity with the decrease in water contents.
Irrigation was an important parameter to be considered in the calibration of the model, since the objective of the field research project was to study the performance of the subsurface drip irrigation in maintaining a desired depth of the water table. The necessary inputs for simulating irrigation were the rate of water application and its distribution during the season. Two line sources, one at the line of symmetry and another at the middle of the grid, were simulated because only half of the field plot was being simulated (Rosa, 2000). Each line source, of strength Q = 28.96 cm2 h-1, was considered to apply the water
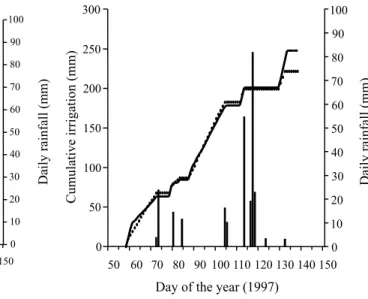
directly at the source cells. Regarding the distribution of irrigation during the season, it was necessary to determine the periods when field irrigation was turned on to give this input to the model. An analysis of the field data in terms of water table depth was used to determine with good precision when the irrigation system was turned on and off. This procedure was necessary because the irrigation system was manually turned off when storms occurred (sometimes before the storms began) and, again, manually turned on when irrigation was necessary. In the last case, a delay of several days always was permitted due to the moisture remaining in the soil profile. Cumulative irrigation applications and daily rainfall are shown in Figure 3. Flat portions of the curves show periods of no irrigation while steeper portions show periods of irrigation. The applied irrigation amounts were 253 mm and 255 mm, respectively for the simulation and field. These results can be considered excellent in terms of prediction of the amount of irrigation required in the entire season.
-120 -100 -80 -60 -40 -20 0
50 60 70 80 90 100 110 120 130 140 150
Day of the year (1996)
Wa
te
r ta
ble
d
ep
th
(
cm
)
0 10 20 30 40 50 60 70 80 90 100
Da
il
y ra
in
fa
ll
(m
m
)
Figure 2. Observed ( ) and simulated ( ) water
The average depths of the simulated and the observed water tables were practically the same during the irrigation periods. To avoid excessive irrigation cycles during the irrigation period, a range of about 0.5 cm was introduced, also reflecting the variation in the field data where a similar range was used.
Runoff was calculated considering its occurrence at the surface and at the edge of the water furrow (seepage). In fact, the term surface runoff is not totally appropriate in this case because of the modification in the grid to avoid the irregularities due to crop beds. The actual surface runoff in the model occurred below the top of the grid.
The principal calibration in terms of runoff was done at the seepage face of the water furrow. Early simulations showed an excess of drainage at this boundary, with a very rapid decrease in water table levels when water was not allowed to remain in the water furrow (surface retention) during rainfall events. The alternative was to permit some water retention at the furrow, and after that, the process of runoff was initiated. As a matter of fact, visual observations at the field showed that runoff did not begin immediately when the water table level reached the water furrow, firstly because of the hydraulic roughness of the surface as influenced by micro-relief, and secondly because of the macro-slope (slope not uniform). At the end of the storm, this
water would infiltrate into the soil profile. These observations corroborated the modification at this boundary of the grid, leading to a better handling of the seepage term.
In the first year of simulation (used for calibration), a device to measure surface runoff was installed at the end of the irrigated plot. There was no flow meter installed, the first year runoff volume was estimated by the time of the pump operation. A calibration had been performed at the laboratory and the flow of the pump measured at about 0.360 m3 min-1. However,
the calibration was performed with clean water, and the runoff water was usually very dirty, affecting the real volume that was pumped from the field. Even with the installation of screen filters at the device, a variation in the flow was expected, and affected the accuracy of the runoff measurements during this year. Runoff from three major storms were measured in the field. The total precipitation for the events, and a comparison between measured and simulated runoff are presented in Table 1. The simulated runoff is a summation of the seepage and the surface runoff calculated by the model. The larger difference between the data is observed in the first event after the installation of the measuring device, around DOY 90. The main reason for this discrepancy can be explained by the difference in water table levels measured and simulated during that period of time (Figure 2). The field and simulated water tables levels were very low when the first storms occurred, and the field water table response was much more rapid than the simulated water table. For the next two storms the water table was already high due to irrigation when precipitation began and the differences between simulated and observed runoff are lower.
The verification of the model was done using data from late February to May 1997, the length of the irrigated potato season in that year. Irrigation and runoff volumes, and water table elevations from the
0 50 100 150 200 250 300
50 60 70 80 90 100 110 120 130 140 150
Day of the year (1996)
C
um
ula
ti
ve
ir
rig
atio
n (m
m
)
0 10 20 30 40 50 60 70 80 90 100
D
ail
y r
ai
nfa
ll
(
m
m
)
Figure 3. Cumulative observed ( ) and simulated ( )
irrigation during the 1996 potato growing season.
••••
Table 1. Measured and simulated runoff for three storm events, in 1996.
Precipitation Observed runoff Simulated runoff Date of the storm
(DOY)(1) -- (mm)
90 52.4 62.1 33.9
106 23.9 10.1 14.4
121 14.0 4.7 4.7
same irrigated plot used in model calibration were the data used in model verification.
The potato crop was planted on February 3 (DOY 34) and harvested on May 20 (DOY 140). The verification period ran from February 27 (DOY 58) to May 18 (DOY 138) in 1997. The field and simulated water table elevations are shown in Figure 4. At the beginning of the simulation, the water table was very low as a result of the relatively dry month of February. At that time, irrigation was initiated.
A good agreement between field and simulated water table levels was observed during most of the simulated period. At the beginning of the season, irrigation continued for approximately two weeks before interruptions occurred due to rainfall on DOY 72 and 73. During this initial irrigation period, there was a change in water table depth control, because the moisture was not adequate in the root zone. Later in the growing season, as the plant root zone increased and the field plot appeared to be wetter than desired, the control depth was reset to a lower position (around DOY 93).
Sustained irrigation was initiated on DOY 87 and continued until rain occurred on DOY 104 and 105. Irrigation occurred only very briefly between rains at other times during the season. Rainfall was highly
effective during the 1997 simulation period, as irrigation was required on only 43 days during the 107-day total growing season. Cumulative irrigation applications and daily rainfall are shown in Figure 5. The curves are very close most of the time and they differ at the end of the season due to the deeper simulated water table depth at that time. The applied irrigation amounts were 247 mm and 221 mm, respectively, for the simulation and field data. These results were very reasonable in terms of prediction of the amount of irrigation required for the entire season, considering that the model assumed a uniform rate of application throughout the season. Field observations showed a variation in flow rate due to partial clogging of the emitters, and weekly flushing of the pipelines and filters was necessary.
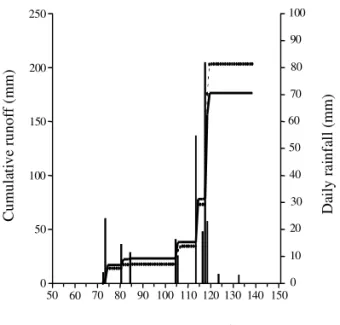
Runoff from the same experimental plot was continuously measured throughout this growing season. A sump was installed in the water furrow and water was collected in the sump by gravity flow. Water was pumped out using a sump pump, and volumes were measured using a timer, event recorder and flow meter. Rainfall and the cumulative simulated and observed runoff throughout the season are shown in Figure 6. The data were very consistent throughout the season, with runoff patterns very
Figure 4. Observed ( ) and simulated ( ) water
table during the 1997 potato growing season.
Figure 5. Cumulative observed ( ) and simulated ( )
irrigation during the 1997 potato growing season.
••••
-120 -100 -80 -60 -40 -20 0
50 60 70 80 90 100 110 120 130 140 150
Day of the year (1997)
Wa
te
r
ta
b
le
de
pt
h
(c
m
)
0 10 20 30 40 50 60 70 80 90 100
Da
ily
ra
infa
ll
(m
m
)
0 50 100 150 200 250 300
50 60 70 80 90 100 110 120 130 140 150
Day of the year (1997)
Cumulative
irrigation
(mm)
0 10 20 30 40 50 60 70 80 90 100
Daily
rainfall
similar following large rainfall events. More runoff occurred for the first two events in the simulation and the opposite occurred for the rest of the events. The greatest deviation between the observed and simulated runoff amounts occurred as a result of the very large (124 mm) rainfall that occurred on DOY 116-118. During this event, the entire research area was flooded and it was likely that runoff from surrounding roadways and an adjacent pine plantation may have contributed to the discrepancy observed.
Conclusions
1. The model results are in very good agreement with the field data, with reasonable predictions of seasonal runoff, irrigation volume, and water table levels during crop growth.
2. The two-dimensional model can be used to investigate different irrigation strategies involving water table management control.
3. Applications of the model include using it to optimize the depth of water table for each growth stage, and to optimize the duration, frequency, and rate of irrigation.
References
BENGTSON, R. L.; GARZON, R. S.; FOUSS, J. L. A fluctuating water table model for the management of a controlled-drainage/subirrigation system. Transactions of the ASAE, St. Joseph, v. 36, p. 437-443, 1993.
CAMPBELL, K. L.; ROGERS, J. S.; HENSEL, D. R. Water table control for potatoes in Florida. Transactions of the ASAE, St. Joseph, v. 21, p. 701-705, 1974.
CLARK, G. A.; STANLEY, C. D. Subirrigation by microirrigation. Applied Engineering in Agriculture, v. 8, p. 647-652, 1992.
CLARK, G. A.; STANLEY, C. D.; GILREATH, P. R. Fully enclosed subsurface irrigation for water management. Bradenton: University of Florida, 1990. 12 p. (Florida Cooperative Extension Service Special Series Report, VEG-001).
EVANS, R. O.; SKAGGS, R. W. Design guidelines for water table management systems on coastal plain soils. Applied Engineering in Agriculture, St. Joseph, v. 5, p. 539-548, 1989.
FAO (Rome, Italy). Drainage design factors. Rome, 1980. 52 p. (Irrigation and Drainage Paper, 38).
FOUSS, J. L.; SKAGGS, R. W.; AYARS, J. E.; BELCHER, H. B. Water table control and shallow groundwater utilization. In: HOFFMAN, G. J.; HOFFMAN, T. A.; SOLOMON, K. H. (Ed.). Management of farm irrigation systems. St. Joseph: American Society of Agricultural Engineers, 1990. p. 783-824.
JOHNSON JUNIOR, M. H.; THOMAS, D. L.; McLENDON, B. D. Controlled-drainage/subirrigation system automation based on soil water potential. Transactions of the ASAE, St. Joseph, v. 36, p. 751-759, 1993.
KANDIL, H. M.; WILLARDSON, L. S. Relating crop-yield response to water-table fluctuations. Journal of Irrigation and Drainage Engineering, Reston, v. 118, p. 113-121, 1992.
MADRAMOOTOO, C. A.; DODDS, G. T.;
PAPADOPOULOS, A. Agronomic and environmental benefits of water table management. Journal of Irrigation and Drainage Engineering, Reston, v. 119, p. 1052-1065, 1993.
Figure 6. Cumulative observed ( ) and simulated ( )
runoff during the 1997 potato growing season.
0 50 100 150 200 250
50 60 70 80 90 100 110 120 130 140 150
Day of the year (1997)
C
um
ul
at
ive r
unof
f (
m
m
)
0 10 20 30 40 50 60 70 80 90 100
D
ail
y r
ai
nfa
ll
(
m
m
)
NWADUKWE, P. O.; ABDULMUMIN, S.; ARORA, Y.; IKE, I. F. Effects of irrigation frequency and water table depths on root growth and yield of tomato in a tropical soil. Agricultural Water Management, Amsterdam, v. 16, p. 241-249, 1989.
PENMAN, H. L. Natural evaporation from open water, bare soil, and grass. Proceedings of the Royal Society of London, London, v. 193, p. 120-145, 1948.
PITTS, D. J.; TSAI, Y. J.; MYHRE, D. L.; ANDERSON, D. L.; SHIH, S. F. Influence of water table depth on sugarcane grown in sandy soils in Florida. Transactions of the ASAE, St. Joseph, v. 36, p. 777-782, 1993.
PRASHER, S. O.; BARRINGTON, S. F.; DARBARY, A. M. Economical design of water table management systems in humid areas. Computers and Electronics in Agriculture, Amsterdam, v. 10, p. 229-244, 1994.
ROSA, J. A. Modeling water table response to subirrigation with a buried microirrigation line source for potato production. 2000. 162 leaves. Thesis (Ph.D. in Agricultural Engineering) - University of Florida, Gainesville.
ROSA, J. A. Níveis de drenagem para a cultura do feijoeiro em várzeas. Pesquisa Agropecuária Brasileira, Brasília, v. 28, n. 8, p. 947-954, ago. 1993.
ROSA, J. A.; SMAJSTRLA, A. G. Determination of saturated hydraulic conductivity in high water table soils
using a simple water table level measurement device. Soil and Crop Science Society of Florida Proceedings, Gainesville, v. 58, p. 62-66, 1999.
SHIRMOHAMMADI, A.; THOMAS, D. L.; SMITH, M. C. Drainage-subirrigation design for Pelham Loamy Sand. Transactions of the ASAE, St. Joseph, v. 34, p. 73-80, 1991.
SMAJSTRLA, A. G.; BOMAN, B. J.; CLARK, G. A.; HAMAN, D. Z.; HARRISON, D. S.; IZUNO, F. T.; PITTS, D. J.; ZAZUETA, F. S. Efficiencies of Florida agricultural irrigation systems. Gainesville: University of Florida, 1991. 11 p. (Bulletin, 247).
SMAJSTRLA, A. G.; LOCASCIO, S. J.; WEINGARTNER, D. P.; HENSEL, D. R. Subsurface drip irrigation for water table control and potato production. Applied Engineering in Agriculture, St. Joseph, v. 16, p. 225-229, 2000.