BGD
11, 14981–15018, 2014
Drivers of long-term variability in CO2 net
ecosystem exchange
C. Helfter et al.
Title Page
Abstract Introduction
Conclusions References
Tables Figures
◭ ◮
◭ ◮
Back Close
Full Screen / Esc
Printer-friendly Version
Interactive Discussion
Discussion
P
a
per
|
Discus
sion
P
a
per
|
Discussion
P
a
per
|
Discussion
P
a
per
Biogeosciences Discuss., 11, 14981–15018, 2014 www.biogeosciences-discuss.net/11/14981/2014/ doi:10.5194/bgd-11-14981-2014
© Author(s) 2014. CC Attribution 3.0 License.
This discussion paper is/has been under review for the journal Biogeosciences (BG). Please refer to the corresponding final paper in BG if available.
Drivers of long-term variability in CO
2
net
ecosystem exchange in a temperate
peatland
C. Helfter1, C. Campbell2, K. J. Dinsmore1, J. Drewer1, M. Coyle1, M. Anderson1, U. Skiba1, E. Nemitz1, M. F. Billett1,3, and M. A. Sutton1
1
Centre for Ecology and Hydrology (Edinburgh), Penicuik, Scotland, UK
2
Scottish Environmental Protection Agency, Stirling, Scotland, UK
3
University of Stirling, Stirling, Scotland, UK
Received: 15 July 2014 – Accepted: 27 September 2014 – Published: 22 October 2014
Correspondence to: C. Helfter ([email protected])
BGD
11, 14981–15018, 2014
Drivers of long-term variability in CO2 net
ecosystem exchange
C. Helfter et al.
Title Page
Abstract Introduction
Conclusions References
Tables Figures
◭ ◮
◭ ◮
Back Close
Full Screen / Esc
Printer-friendly Version
Interactive Discussion
Discussion
P
a
per
|
Discus
sion
P
a
per
|
Discussion
P
a
per
|
Discussion
P
a
per
|
Abstract
Land–atmosphere exchange of carbon dioxide (CO2) in peatlands exhibits marked sea-sonal and inter-annual variability, which subsequently affects the carbon sink strength of catchments across multiple temporal scales. Long-term studies are needed to fully capture the natural variability and therefore identify the key hydrometeorological drivers 5
in the net ecosystem exchange (NEE) of CO2. NEE has been measured continu-ously by eddy-covariance at Auchencorth Moss, a temperate lowland peatland in cen-tral Scotland, since 2002. Hence this is one of the longest peatland NEE studies to date. For 11 yr, the site was a consistent, yet variable, atmospheric CO2sink ranging from−5.2 to−135.9 g CO2-C m−2yr−1(mean of−64.1±33.6 g CO2-C m−2yr−1).
Inter-10
annual variability in NEE was positively correlated to the length of the growing sea-son. Mean winter air temperature explained 87 % of the inter-annual variability in the sink strength of the following summer, indicating a phenological memory-effect. Plant productivity exhibited a marked hysteresis with respect to photosynthetically active radiation (PAR) over the growing season, indicative of two separate growth regimes. 15
Ecosystem respiration (Reco) and gross primary productivity (GPP) were closely cor-related (ratio 0.74), suggesting that autotrophic processes were dominant. Whilst the site was wet most of the year (water table depth <5 cm) there were indications that heterotrophic respiration was enhanced by drought, which also depressed GPP. NEE was compared to 5 other peatland sites which have published long-term NEE records. 20
The CO2uptake rate during the growing season was comparable to 3 other European sites, however the emission rate during the dormant season was significantly higher.
1 Introduction
Northern peatlands are one of the most important global sinks of atmospheric CO2; with their ability to sequester C controlled by hydrometeorological variables such as 25
BGD
11, 14981–15018, 2014
Drivers of long-term variability in CO2 net
ecosystem exchange
C. Helfter et al.
Title Page
Abstract Introduction
Conclusions References
Tables Figures
◭ ◮
◭ ◮
Back Close
Full Screen / Esc
Printer-friendly Version
Interactive Discussion
Discussion
P
a
per
|
Discus
sion
P
a
per
|
Discussion
P
a
per
|
Discussion
P
a
per
also potentially represent an important climatic feedback mechanism (Aurela et al., 2001; Frolking et al., 2001; Lafleur et al., 2003). All these factors either directly or indi-rectly link to plant productivity. Peatland carbon models generally suggest a decline in net sink strength in a warming climate, although the magnitude of the decline predicted by individual models is variable (Clark et al., 2010). UK peatlands are predicted to be-5
come a net source of carbon in response to climate change (Worrall et al., 2007), with climate models predicting a rise in global temperature of ca. 3◦C between 1961–1990 and 2100 (IPCC, 2007). The McGill wetland model (St-Hilaire et al., 2010) predicted that a modest rise in temperature in a peatland in Ontario (Canada) would lead to it becoming a CO2source rather than a sink. A greater understanding of drivers and feed-10
back mechanisms, across a range of temporal scales, is therefore a current research priority.
Eddy covariance measurements using fixed flux towers provide the best method for assessing year-on-year changes in catchment scale CO2 exchange between the land surface and the atmosphere (Dinsmore et al., 2010; Nilsson et al., 2008; Roulet et al., 15
2007). Continuous measurements reveal strong inter-seasonal and inter-annual varia-tion. In most years and in most peatlands net ecosystem exchange (NEE) is the largest and most variable of the C flux terms (Roulet et al., 2007). In combination with aquatic fluxes (downstream and evasive losses) and CH4emissions, it is a key component, if not the foremost, of C and greenhouse gas (GHG) budgets for peatland systems (Bil-20
lett et al., 2010; Dinsmore et al., 2010). Understanding what is driving inter-seasonal and inter-annual changes is one of the most important uses of long-term data. Although more sites are now being established globally, there are still relatively few peatland sites (<10) with published NEE measurements for periods of 2 yr or more. This is partly be-cause past flux measurements were often made on a short-term or campaign basis, 25
BGD
11, 14981–15018, 2014
Drivers of long-term variability in CO2 net
ecosystem exchange
C. Helfter et al.
Title Page
Abstract Introduction
Conclusions References
Tables Figures
◭ ◮
◭ ◮
Back Close
Full Screen / Esc
Printer-friendly Version
Interactive Discussion
Discussion
P
a
per
|
Discus
sion
P
a
per
|
Discussion
P
a
per
|
Discussion
P
a
per
|
2009; Macdonald et al., 1998). Whilst chamber approaches provide useful methods for comparing sites/treatments, the scale of measurement and the potential for introduc-ing artefacts durintroduc-ing the measurement period, mean that they are less accurate than flux tower measurements in producing realistic flux values representative of larger land surface areas.
5
Including the Auchencorth Moss site, there are to our knowledge only 6 peatland sites in the Northern Hemisphere for which long-term (≥3 yr) datasets of NEE are
now available and all show that peatlands continue to operate as a sink for CO2 from the atmosphere, albeit with different annual sink strengths. The 6 yr mean NEE for Mer Bleue peatland (Ontario, Canada) was−40.2 g C m−2yr−1(negative values signify
10
uptake), varying year-to-year from a minor (−2) to a major (−112) CO2 sink (Roulet
et al., 2007). Similarly McVeigh et al. (2014) found that a blanket bog in SW Ireland had a mean 9 yr NEE of−55.7 g C m−2yr−1and exhibited significant inter-annual variability
(−32.1 to−79.2 g C m−2yr−1). Degerö Stormyr in Northern Sweden also showed strong
CO2 uptake in consecutive years (−55 and −48 g C m −2
yr−1, respectively) (Nilsson 15
et al., 2008). Eddy covariance measurements at Lompolojänkkä, a nutrient-rich fen in Northern Finland, again showed that the site operated as a weak (−3 g C m−2yr−1) to
strong (−59 g C m−2yr−1) CO2sink over a 3 yr period (Aurela et al., 2009). In contrast to the variability exhibited by these sites, Christensen et al. (Christensen et al., 2012) found that over the period 2001–2008 annual CO2 uptake in Stordalen, a sub-arctic 20
permafrost mire in Northern Sweden, was relatively stable (−46 g C m−2yr−1).
Quantifying inter-annual variability in NEE is a prerequisite for detecting longer term trends or step changes in flux magnitude in response to climatic or anthropogenic influ-ences. Furthermore, identifying the drivers of this variability is an essential step towards understanding and modelling the effects that long-term climatic changes will have on 25
BGD
11, 14981–15018, 2014
Drivers of long-term variability in CO2 net
ecosystem exchange
C. Helfter et al.
Title Page
Abstract Introduction
Conclusions References
Tables Figures
◭ ◮
◭ ◮
Back Close
Full Screen / Esc
Printer-friendly Version
Interactive Discussion
Discussion
P
a
per
|
Discus
sion
P
a
per
|
Discussion
P
a
per
|
Discussion
P
a
per
increased by 2.5–23.2 % in different regions of the UK, with the largest increases oc-curring in the winter (particularly in Scotland and Northern England); summer months were typically characterised by a decrease in precipitation amount. Mean annual tem-perature during the same period (1961–2006) increased in parts of the UK by 1.05– 1.64◦C (Jenkins et al., 2009). Individual site-specific records show a similar picture. For 5
example, an upland peatland site in Northern England showed an increase in mean an-nual temperature of 0.53◦C between the period 1931–1960 and 1991–2006, with the winter months (January–February) warming much faster than the other months of the year (Holden and Rose, 2011). These data therefore show that significant changes are taking place in seasonal climatic patterns, which are likely to have a major impact on 10
annual net CO2uptake by peatland systems.
Meteorological conditions such as rainfall, temperature and levels of photosynthetic active radiation (PAR) control NEE and its components, total ecosystem respiration (Reco) and gross primary productivity (GPP).Recois in turn composed of a plant respira-tion term (autotrophic respirarespira-tion,RA) which quantifies metabolic respiration from both 15
above- and below-ground biomass (RAA andRAB, respectively), and a soil respiration term (heterotrophic respiration,RH) resulting from microbial decomposition of organic matter. Autotrophic respiration can account for up to 60 % orReco(van der Molen et al., 2011), whilst total below ground respiration (Rsoil=RAB+RH) can account for up to 70 %.Reco and GPP have been shown to be tightly linked in a range of ecosystems on 20
both short-term and annual timescales (Irvine et al., 2008; Law, 2005; Ryan and Law, 2005) and respond similarly, although not necessarily with the same magnitude, to ex-treme events such as drought. For example, short-term dynamics ofReco have been shown to be more sensitive to the availability of labile C compounds produced by pho-tosynthesis than to the effects of varying soil moisture on soil microbial activity (Irvine 25
BGD
11, 14981–15018, 2014
Drivers of long-term variability in CO2 net
ecosystem exchange
C. Helfter et al.
Title Page
Abstract Introduction
Conclusions References
Tables Figures
◭ ◮
◭ ◮
Back Close
Full Screen / Esc
Printer-friendly Version
Interactive Discussion
Discussion
P
a
per
|
Discus
sion
P
a
per
|
Discussion
P
a
per
|
Discussion
P
a
per
|
andReco and study their dynamics with respect to meteorology. We have done this on Auchencorth Moss, an ombrotrophic peatland in SE Scotland. The first eddy covari-ance measurements of CO2 exchange at Auchencorth Moss took place in 1995–1996 (Hargreaves et al., 2003), with continuous measurements starting in 2002. Previous measurements of NEE have been published for specific 2–3 yr time periods and sug-5
gest that year-on-year values are highly variable. Dinsmore et al. (2010) and Drewer et al. (2010) reported that over a 3 yr period (2006–2008) the peatland acted as a very strong CO2sink (−88 to−136 g C m
−2
yr−1), whereas Billett et al. (2004) reported that between 1995–1996 it was acting as a weaker CO2 sink (−36 and −8 g C m−2yr−1).
In comparison to NEE, CH4 emissions at Auchencorth Moss are small (average of 10
0.32 g CH4-C m −2
yr−1 in 2007 and 2008, (Dinsmore et al., 2010). Although these in-dividual studies highlight significant inter-annual variability at Auchencorth Moss, they are for relatively short periods of time and are insufficient to investigate the drivers of inter-annual variability in NEE. Here we present the first complete analysis of the 2002– 2013 dataset in terms of monthly, seasonal and annual fluxes and explore the drivers 15
of temporal variability in NEE. In addition, we compare the 11 yr period 2002–2013 with the longer term (1960–2013) local meteorological record to place the recent 11 yr period into a wider climatic context. We use our data to test the following hypotheses:
– Peatlands release more CO2 to the atmosphere under drier and warmer condi-tions.
20
– The length of the growing season has a significant impact on annual NEE.
– Plant productivity during the growing season is affected by the preceding winter’s meteorological conditions and can exhibit significant inter-annual variability.
– Autotrophic processes dominate heterotrophic processes at well-watered, vege-tated sites.
BGD
11, 14981–15018, 2014
Drivers of long-term variability in CO2 net
ecosystem exchange
C. Helfter et al.
Title Page
Abstract Introduction
Conclusions References
Tables Figures
◭ ◮
◭ ◮
Back Close
Full Screen / Esc
Printer-friendly Version
Interactive Discussion
Discussion
P
a
per
|
Discus
sion
P
a
per
|
Discussion
P
a
per
|
Discussion
P
a
per
2 Materials and methods
2.1 Site description
Auchencorth Moss (55◦47′32 N, 3◦14′35 W, 267 m a.s.l.) is a low-lying ombrotrophic peatland situated 17 km south-west of Edinburgh (Scotland, UK). Parent material com-prises Upper Carboniferous/Lower Devonian sedimentary rocks overlain by fluvio-5
glacial till; peat depth range from <0.5 m to >5 m. Long-term research (e.g. Billett et al., 2004; Dinsmore et al., 2010) on C fluxes is focussed on the 3.4 km2 upper part of the catchment (elevation range 249–300 m) where the soils comprise peats (85 %), gleysols (9 %), humic gleysols (3 %) and cambisols (3 %). The open moorland site has an extensive uniform fetch over blanket bog to the south, west and north with a dom-10
inant wind direction from the SW; winds from the NE are the second most important wind direction. The terrain is relatively flat with a complex micro-topography consisting of hummocks and hollows. Hummocks are relatively small in size (typically 40 cm in diameter and ∼30 cm in height) and covered by either a mix of Deschampsia flexu-osaandEriophorum vaginatum, orJuncus effusus. In contrast, hollows are dominated 15
by mosses (Sphagnum papillosa and Polytrichum commune) and a layer of grasses (Dinsmore et al., 2009).
The site was drained more than 100 yr ago; the drains have become progressively less effective and re-vegetated over time, leading to slow and progressive rewetting of the site. Over the last 20 yr the site has been used for seasonal low intensity sheep 20
grazing; areas of peat extraction occur at the margins of the catchment outside the footprint of the flux tower measurements.
2.2 Instrumentation and data processing
Fluxes of carbon dioxide (CO2) have been measured continuously by eddy-covariance (EC) at Auchencorth Moss since May 2002. The principles of operation and flux calcu-25
BGD
11, 14981–15018, 2014
Drivers of long-term variability in CO2 net
ecosystem exchange
C. Helfter et al.
Title Page
Abstract Introduction
Conclusions References
Tables Figures
◭ ◮
◭ ◮
Back Close
Full Screen / Esc
Printer-friendly Version
Interactive Discussion
Discussion
P
a
per
|
Discus
sion
P
a
per
|
Discussion
P
a
per
|
Discussion
P
a
per
|
elsewhere (Aubinet et al., 2000; Baldocchi et al., 2001). The EC system at Auchen-corth Moss consists of a LI-COR 7000 closed-path infrared gas analyser operating at 10 Hz for the simultaneous measurement of carbon dioxide and water vapour. Turbu-lence measurements were made with an ultrasonic anemometer (initially model Solent R1012A R2 operating at 20.8 Hz; from 2009 Gill Windmaster Pro operating at 20 Hz; 5
both Gill Instruments, Lymington, UK), mounted atop a 3 m mast. The effective mea-surement height is 3.5 m with a vertical separation of 20 cm between the anemometer and the inlet of the sampling line. Air is sampled at 20 lpm through a 20 m long Dek-abon line (internal diameter 4 mm). In addition to eddy-covariance measurements, the site is equipped with a weather station, soil temperature probes (at 10, 20, 30, and 10
40 cm), sensors for total solar radiation and photosynthetically active radiation (PAR), a tipping bucket rain gauge and, since April 2007, water table depth has been recorded at half-hourly intervals.
High-frequency data is acquired by in-house software written in LabView (National Instruments) and processed offline into half-hourly fluxes.
15
Half-hourly data points were excluded from further analysis if any of the criteria listed below was not met:
– The total number of “raw” (high-frequency) data points per notional half-hour pe-riod was less than 90 % of the maximum possible number of points (36 000), i.e. below a minimum averaging period of 27 min.
20
– The number of spikes in raww(vertical wind velocity component), CO2(CO2mole fraction) and H2O mole fraction exceeded 1 % of the total number of points per half-hour period.
– The stationarity test devised by Foken et al. (Foken and Wichura, 1996), which compares half-hourly fluxes to the average of six 5 min averaging periods within 25
the half hour, did not fulfil the quality criterion.
– Turbulence was insufficient for reliable EC measurements (u∗<0.1 m s −1
BGD
11, 14981–15018, 2014
Drivers of long-term variability in CO2 net
ecosystem exchange
C. Helfter et al.
Title Page
Abstract Introduction
Conclusions References
Tables Figures
◭ ◮
◭ ◮
Back Close
Full Screen / Esc
Printer-friendly Version
Interactive Discussion
Discussion
P
a
per
|
Discus
sion
P
a
per
|
Discussion
P
a
per
|
Discussion
P
a
per
– CO2mole fractions<330 ppm.
– Half-hourly CO2 fluxes (FCO
2) fell outside the [−50 µmol m
−2 s−1,
+120 µmol m−2s−1] interval.
– Half-hourly latent fluxes (LE) fell outside the [−250 W m−2,+600 W m−2] interval.
After quality control, the number of good data points ranged from 45 % (in 2005) to 5
78 % (in both 2004 and 2008), with an annual mean of 65±11 %.
Gapfilling of net ecosystem exchange (NEE) measured by eddy-covariance and par-titioning of the gapfilled half-hourly fluxes into ecosystem respiration (Reco) and gross primary production (GPP) were achieved using an online tool developed at the Uni-versity of Jena, Germany1 (Reichstein et al., 2005). In this flux partitioning approach, 10
daytime ecosystem respiration is obtained by extrapolation of the night time parameter-isation of NEE on air temperature (using an exponential relationship of the form given in Eq. 1) and GPP is the difference between ecosystem respiration and NEE.
Due to technical difficulties with the sampling pump (gradual decline in pumping per-formance) which were not detected immediately, most of the flux data for the summer 15
period of 2011 were discarded as a precautionary measure.
2.3 Calculations of ecosystem respiration,Q10 and GPP
Ecosystem respiration was determined from night-time CO2 fluxes measured by EC and parameterised as a function of temperature using Eq. (1).
Reco=aexp(bT) (1)
20
WhereT is either air or soil temperature andaandbare fitting coefficients.
1
BGD
11, 14981–15018, 2014
Drivers of long-term variability in CO2 net
ecosystem exchange
C. Helfter et al.
Title Page
Abstract Introduction
Conclusions References
Tables Figures
◭ ◮
◭ ◮
Back Close
Full Screen / Esc
Printer-friendly Version
Interactive Discussion
Discussion
P
a
per
|
Discus
sion
P
a
per
|
Discussion
P
a
per
|
Discussion
P
a
per
|
The growth rate (Q10) for ecosystem respiration for a change of 10 ◦
C was deter-mined using the relationship:
Q10=
R
2
R1
10/(T2−T1)
(2)
T1andT2are reference temperatures, andR1andR2are the corresponding respiration rates.
5
GPP was parameterised with respect to PAR using the following rectangular hyper-bolic regression function:
GPP= α·GPPsat·PAR
GPPsat+α·PAR
(3)
Where GPPsat(GPP at light saturation) andα (quantum efficiency) are fitting parame-ters.
10
3 Results
3.1 Site meteorology
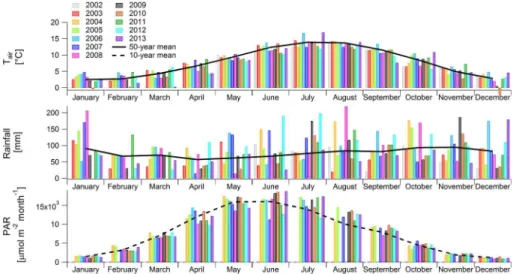
During the study period 2002–2013, the site received a mean annual precipita-tion of 1018±166 mm. Autumn (September–November) was the wettest season with 96±11 mm of rain per month, and spring (March–May) was the driest with 64±17 mm
15
per month. Rainfall is highly variable year on year but records from a weather station of the UK Met Office (UK Meteorological Office, 2013) located 3.5 km North of the study site indicate a slight upward trend since the early 1970s (average annual precipitation 899±166 mm for the period 1961–2001).
Mean annual air temperatures were 8.3±4.6◦C for the study period 2002–2013 20
compared to 7.7±4.5◦C for 1961–2001. Despite year-on-year variability there are
BGD
11, 14981–15018, 2014
Drivers of long-term variability in CO2 net
ecosystem exchange
C. Helfter et al.
Title Page
Abstract Introduction
Conclusions References
Tables Figures
◭ ◮
◭ ◮
Back Close
Full Screen / Esc
Printer-friendly Version
Interactive Discussion
Discussion
P
a
per
|
Discus
sion
P
a
per
|
Discussion
P
a
per
|
Discussion
P
a
per
1961 at the nearby Met Office station, which is consistent with UK and global trends (Jenkins et al., 2009). All seasons were warmer in 2002–2013 than in 1961–2001, albeit not significantly. Summer (June–August) was the warmest season with an av-erage temperature of 13.6±1.1◦C, and winter (December–February) the coldest with
3.7±1.0◦C (Fig. 1). 5
Over the period April 2007 to December 2013, water table depth (WTD) was within 4 cm of the peat surface for 50 out of 81 months (62 %). During dry periods, however, the water table could fall quickly to depths>35 cm (Table 2).
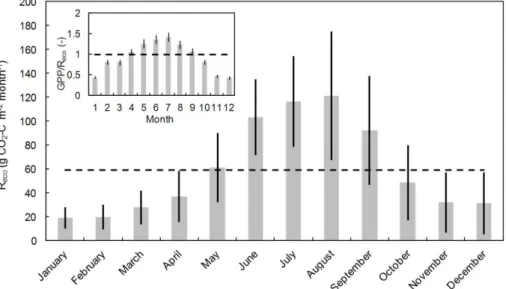
3.2 Seasonal and inter-annual variability ofReco, GPP and NEE
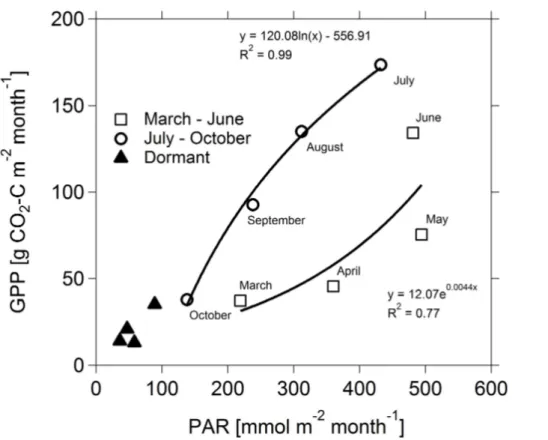
Ecosystem respiration typically peaked in July/August and was distributed asymmetri-10
cally around its peak value (Fig. 2), following the annual cycle of temperature. Plotting monthly GPP as a function of photosynthetically active radiation (PAR) reveals two separate plant productivity regimes culminating around mid-summer (Fig. 3). The hys-teresis of GPP v. PAR is characterised by an exponential growth phase from March to June/July followed by a logarithmic decline in photosynthetic efficiency. The ratio of 15
GPP to Reco showed that on average carbon uptake by vegetative growth exceeded losses to the atmosphere through respiration for six months of the year, from April to September (Fig. 2, inset).
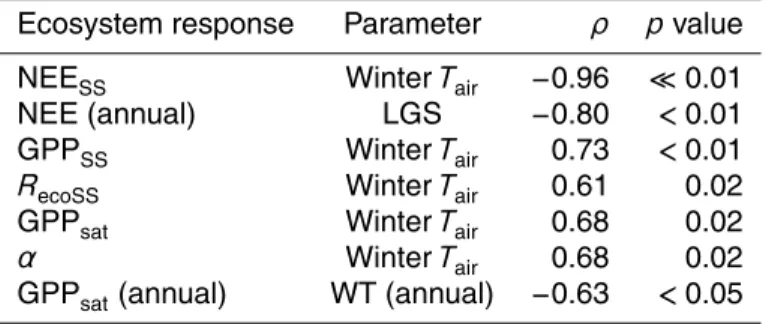
A negative correlation was established between mean annual values of GPPsat(GPP at light saturation, Eq. 3) and WT (Spearmanρ=−0.63, p <0.05, Table 1) indicating
20
that the photosynthetic capacity of the plant community tended to decrease as WT deepened. Furthermore, GPPsat was positively correlated to the average temperature during the preceding winter (ρ=0.73,p <0.01, Table 1).
Both GPP and Reco exhibited significant inter-annual variability with peak sum-mer time values ranging from 96 to 245 g CO2-C m
−2
month−1 for GPP and 76 to 25
198 g CO2-C m −2
BGD
11, 14981–15018, 2014
Drivers of long-term variability in CO2 net
ecosystem exchange
C. Helfter et al.
Title Page
Abstract Introduction
Conclusions References
Tables Figures
◭ ◮
◭ ◮
Back Close
Full Screen / Esc
Printer-friendly Version
Interactive Discussion
Discussion
P
a
per
|
Discus
sion
P
a
per
|
Discussion
P
a
per
|
Discussion
P
a
per
|
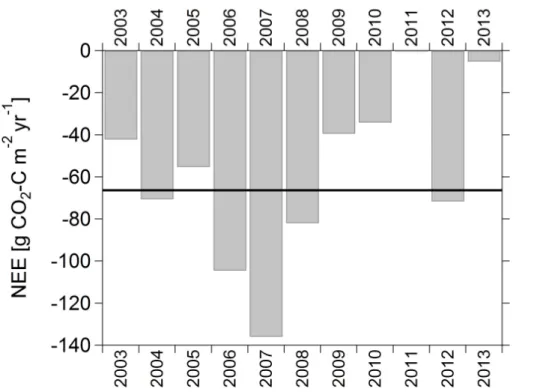
variability was large. NEE (mean −64.1±33.6 g CO2-C m −2
) ranged from −5.2 to
−135.9 g CO2-C m −2
yr−1with minimum and maximum CO2 uptake in 2013 and 2007, respectively (Fig. 4). As observed at other sites (Christensen et al., 2012), annual val-ues of NEE were well-correlated to the length of the growing seasons (LGS from here onward;R2=0.64; Fig. 5). Furthermore, whilst mean spring/summer (April to Septem-5
ber) NEE (NEESS) at Auchencorth Moss was not significantly correlated to summer temperature, a strong negative correlation (i.e. net uptake increased with increasing winterTair) was observed between mean NEESS and the mean air temperature of the preceding winter (January to March) (R2=0.87, Fig. 6;p≪0.01). Comparable
corre-lations to winterTairwere observed for GPPSSandRecoSS(ρ=0.73,p <0.01;ρ=0.61, 10
p=0.02, respectively, Table 1).
3.3 Effects of dry periods on CO2exchange
Throughout most years and most seasons Auchencorth Moss can be considered a wet site, with mean water table depth (WTD) 3.5±6.8 cm and monthly range −3.8 cm (flooded; negative values denote water table levels above the peat surface) to+36 cm 15
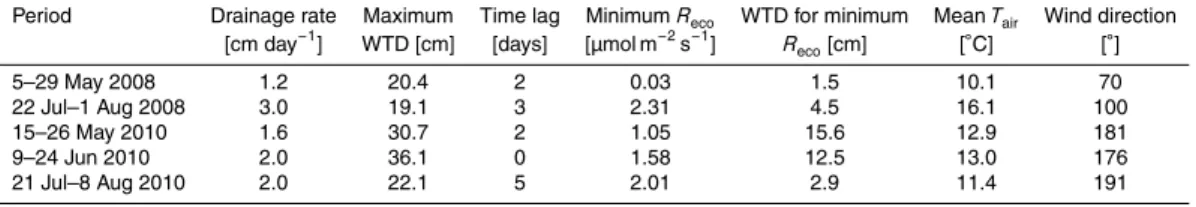
(based on the available data between April 2007 to December 2013). The site was generally waterlogged during the autumn and winter months. During dry spells, which we arbitrarily define as any period lasting 1 week or longer with WTD>5 cm, the water table can drop quickly at rates up to 3 cm day−1(Table 2).
Three notable dry spells occurred during the summer of 2010 and two during the 20
summer of 2008, characterised by cycles of rapid fall and rise of the water table. Mean-while, air temperatures exhibited little variation. Details of the drainage rates (water table drawdown) and maximum water table depths are given in Table 2. Under normal hydrological conditions (water table typically within 3–5 cm of the peat surface),Reco at Auchencorth Moss did not exhibit a significant correlation with WTD. In contrast, 25
BGD
11, 14981–15018, 2014
Drivers of long-term variability in CO2 net
ecosystem exchange
C. Helfter et al.
Title Page
Abstract Introduction
Conclusions References
Tables Figures
◭ ◮
◭ ◮
Back Close
Full Screen / Esc
Printer-friendly Version
Interactive Discussion
Discussion
P
a
per
|
Discus
sion
P
a
per
|
Discussion
P
a
per
|
Discussion
P
a
per
0 to 5 days (Table 2). During the first two dry spells of 2010 the relationship between
Reco and WTD was of clear parabolic form, withReco reaching a minimum a few days after the onset of the dry period. Dry spell 1 and 2 were separated by a strong rainfall event on 9 June 2010 which resulted in a rapid rise in WT; the ecosystem response to the second cycle of drought was quasi-instantaneous and the magnitude of the res-5
piration term was the same at the end of the first and the beginning of the second cycle (2.5 µmol m−2s−1). In addition, the decrease in total respiration at the beginning of the second dry period was less pronounced than at the onset of the first dry period; minimumReco in the second dry period coincided with a WTD of 12.5 cm, compared to 15.6 cm for the first dry spell. The parabolic trend was weaker during the third dry 10
spell (R2=0.65), and minimumReco reached at a much shallower WTD (2.9 cm). Ex-cept for the second dry period of 2010, the residuals of the regressions betweenReco and WTD were not correlated with air or soil temperature. The 2 dry spells of 2008 exhibited similar parabolic relationships between Reco and WTD but differed in mag-nitude. Of all 5 dry spells, Reco was at the lowest in May 2008. However, at the end 15
of that dry spell the trend in Reco was consistent with the 2010 trends. The second dry spell of summer 2008 differed from all others both in terms of magnitude and rate of change of Reco with respect to WTD: both parameters were largest in July 2008 which also saw the highest mean air temperature of the 5 dry spells. In contrast,Tair during the first dry spell of 2008 was the lowest. Such parabolic relationships between 20
Reco and WTD were however not observed during the summer of 2013, which was the second driest in the 2002–2013 study period (the driest was 2003 with 346 mm rain between April and September compared to 361 mm in 2013); 2013 also had the longest winter of the study period (start of the growing season at day 103 in 2013 compared to day 77±21 for the entire study period) as well as the lowest soil temper-25
atures. Soil temperature at−5 cm increased by 3◦C in the 10 days prior to the start
of the thermal growing season;Tsoilrose steadily until mid-July and reached 15 ◦
BGD
11, 14981–15018, 2014
Drivers of long-term variability in CO2 net
ecosystem exchange
C. Helfter et al.
Title Page
Abstract Introduction
Conclusions References
Tables Figures
◭ ◮
◭ ◮
Back Close
Full Screen / Esc
Printer-friendly Version
Interactive Discussion
Discussion
P
a
per
|
Discus
sion
P
a
per
|
Discussion
P
a
per
|
Discussion
P
a
per
|
In 2013, the relationship betweenReco and WTD was linear across the 6 temperature classes considered (Fig. 8). Between 8 and 16◦C, the mean slope betweenReco and WTD (average of the 4 2◦C temperature classes) was 0.016± 0.004 and the vertical offset increased with temperature. Above 16◦C, the positive correlation betweenReco and WTD was less pronounced and was even found to be negative for the 16–18◦C 5
temperature class which could be due to spatial inhomogeneity as the wind direction alternated between prevailing SW and NE. Above 18◦C, the positive linear correlation was no longer statistically significant.
For all years for which WTD data was available, the sensitivity ofReco to air temper-ature (Q10) decreased with a drop in water table; in contrast, the theoretical values of 10
RecoatTair=0 ◦
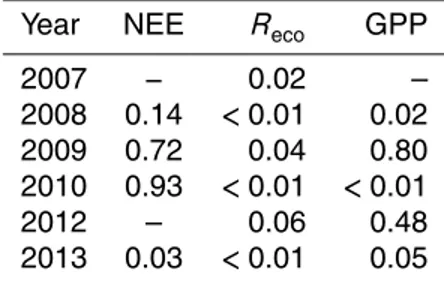
C (obtained by extrapolation to the origin of the temperature-dependent functions fitted to monthlyReco and averaged to annual values) were found to increase with WTD. One-way analysis of variance (ANOVA) on GPP, NEE andRecowith respect to 10 WTD classes (making the assumptions that (a) the WTD classes constitute dif-ferent treatments and (b) that the plant community has reached a stead state in terms 15
of growth; Table 3) demonstrates that the position of the WT does have a statistically significant impact onRecofor all years between 2007 and 2013, except 2012. For GPP, the correlation with WTD was significant in 2008 and 2010, and for NEE in 2013 only.
4 Discussion
4.1 Seasonal and inter-annual variability of NEE and GPP
20
The relationship between GPP and PAR exhibited a marked hysteresis during the grow-ing season (Fig. 3), which we attribute to the degradation of the photosynthetic effi -ciency of the plant community as senescence sets in. A recent study on soybean crops revealed that the fraction of PAR absorbed by the plants during the green-up phase was three times larger than during senescence, despite LAI of senescing plants being 25
hystere-BGD
11, 14981–15018, 2014
Drivers of long-term variability in CO2 net
ecosystem exchange
C. Helfter et al.
Title Page
Abstract Introduction
Conclusions References
Tables Figures
◭ ◮
◭ ◮
Back Close
Full Screen / Esc
Printer-friendly Version
Interactive Discussion
Discussion
P
a
per
|
Discus
sion
P
a
per
|
Discussion
P
a
per
|
Discussion
P
a
per
sis was also observed between GPP normalised by potential PAR (i.e. maximum PAR at a given time of year) and near-infrared reflectance over the life cycle of the crop. Senescing plants possess greater LAI (albeit due to a combination of photosyntheti-cally active and inactive leaves) and increase light scattering but are less productive than the greening plants. We also expect the relationship between GPP and PAR to 5
vary due to the relative contributions to total measured GPP of individual plant species, whose productivity can vary from year to year (Bates et al., 2005; Kreyling et al., 2010, 2008; Weltzin et al., 2000). Although spatial quantitative information regarding leaf area index (LAI) or aboveground biomass is not available at a sufficiently fine temporal scale at Auchencorth Moss, other studies have reported correlations between winter meteo-10
rological conditions and the development of plant populations later in the year. Weltzin (2000) reported increased total net primary productivity (TNPP) in shrubs, a decrease in graminoids and no effect on bryophytes exposed to a gradient of infrared loading (i.e. continuous heating by infrared lamps). Individual species of bryophytes at a tem-perate UK site have been shown to respond to winter warming and/or summer drought 15
in opposite ways, but this was not reflected at the community level whose mean cover did not exhibit significant differences between treatments (Bates et al., 2005). Kreyling (2008) demonstrated enhancement of aboveground net primary productivity (ANPP) in grasses as a result of freeze-thaw cycles the preceding winter, whilst belowground net primary productivity (BNPP) was adversely affected.
20
At plant community level we observed a net positive feedback between winter time meteorology and productivity as GPPSS, GPPsatandα were significantly correlated to mean air temperature during the preceding winter (Table 1). Based on the knowledge that Sphagnum mosses are capable of photosynthesising as soon as the snow cover disappears and daily air temperature>0◦C (Loisel et al., 2012) we speculate that the 25
partic-BGD
11, 14981–15018, 2014
Drivers of long-term variability in CO2 net
ecosystem exchange
C. Helfter et al.
Title Page
Abstract Introduction
Conclusions References
Tables Figures
◭ ◮
◭ ◮
Back Close
Full Screen / Esc
Printer-friendly Version
Interactive Discussion
Discussion
P
a
per
|
Discus
sion
P
a
per
|
Discussion
P
a
per
|
Discussion
P
a
per
|
ularly in moss species (Aurela et al., 2009; Lafleur et al., 2003; van der Molen et al., 2011). Wet-adapted moss species growing in hollows are known to have large vari-ability in growth rate directly linked to WTD (faster growth than hummock and lawn species under wet conditions but susceptible to dessication under dry conditions; Gun-narsson, 2005; Loisel et al., 2012). Weltzin et al. (2000) showed that, along a gradient 5
of decreasing WTD, TNPP increased in bryophytes, decreased in shrubs and was un-changed in graminoids. Graminoids and bryophytes being the dominant species in the EC footprint, the sensitivity of GPP to WTD observed at our study site is likely to be mainly due to mosses.
We found that GPP andReco followed the same temporal pattern on a monthly and 10
seasonal basis, with an averageReco/GPP ratio of 0.74 for the study period. Whilst these two terms are not fully independent of one other due to the gapfilling and flux partitioning procedures, it is nevertheless interesting to compare their ratio to those obtained at other sites. A ratio of 1 : 3 between maximum ecosystem respiration and carbon uptake has been reported for a boreal peatland in northern Manitoba, Canada 15
(Bubier et al., 1998), and ratios ranging from 0.46 to 0.76 were recorded at four Scandi-navian mires (Lindroth et al., 2007). The constant ratio betweenRecoand GPP points to common mechanistic controls, and suggests that autotrophic respiration was the dom-inant driver of the seasonal dynamics of total ecosystem respiration (see also Lindroth et al., 2007).
20
Mean winterTairexplained 87 % of inter-annual variability in NEE during the following summer (NEESS) (Fig. 6). Based on this strong linear relationship and our observations that (a) GPPsat (GPP at light saturation) of the ecosystem were linearly correlated to winterTair, and (b) the ratioReco/GPP was fairly constant over the years, we hypothe-size that winter meteorological conditions (in particular meanTair) mainly affect overall 25
BGD
11, 14981–15018, 2014
Drivers of long-term variability in CO2 net
ecosystem exchange
C. Helfter et al.
Title Page
Abstract Introduction
Conclusions References
Tables Figures
◭ ◮
◭ ◮
Back Close
Full Screen / Esc
Printer-friendly Version
Interactive Discussion
Discussion
P
a
per
|
Discus
sion
P
a
per
|
Discussion
P
a
per
|
Discussion
P
a
per
4.2 Importance of dry periods
The parabolic trend seen in the relationship betweenReco and WTD during dry spells (Fig. 7) is interesting as it may help understand the mechanistic drivers of Reco at Auchencorth Moss. We postulate that the initial decline in respiration was caused by a reduction in plant metabolic activity as water availability decreased (Lund, 2012). 5
Meanwhile, the lowering of the WT also favoured aerobic processes and increasing mi-crobial decomposition of organic matter within the peat profile (Hendriks et al., 2007). MinimumReco could then correspond to equilibrium between declining autotrophic and increasing heterotrophic respiration. The subsequent net increase in Reco with deep-ening WTD could then be explained by a gradual increase in the ratio of heterotrophic 10
to autotrophic respiration. The decrease of the sensitivity ofReco with respect toTair (Q10) with deepening water table further supports the idea that the contribution of het-erotrophic to total ecosystem respiration was enhanced under drier conditions.
Based on these observations, we attribute the differences in respiration patterns during the dry spells to water table dynamics, which differs from drier sites where tem-15
perature (not WT) was found to be the dominant control ofReco (Lafleur et al., 2005; Updegraff et al., 2001). This is further supported by the result of a one-way ANOVA which demonstrates a statistically significant correlation between Reco and WTD for all growing seasons (except for 2012 which had a wetter than average growing sea-son with WT near or above the peat surface for the entire growing seasea-son). The linear 20
(rather than parabolic) response ofReco to WTD in 2013 could perhaps be linked to the long winter of 2013 (the thermal growing season began 69 days later than in 2008, and 10 days later than in 2010) and the fact that the dry spell which lasted most of the summer began less than a month after the start of the growing season; under these circumstances, the moss population could have switched from relatively low metabolic 25
BGD
11, 14981–15018, 2014
Drivers of long-term variability in CO2 net
ecosystem exchange
C. Helfter et al.
Title Page
Abstract Introduction
Conclusions References
Tables Figures
◭ ◮
◭ ◮
Back Close
Full Screen / Esc
Printer-friendly Version
Interactive Discussion
Discussion
P
a
per
|
Discus
sion
P
a
per
|
Discussion
P
a
per
|
Discussion
P
a
per
|
andReco/GPP=0.8±0.1 (range 0.6 to 1.2); this suggests growth in species less sus-ceptible to drought-stress than mosses.
Disentangling the effects of lower than average winter air temperature and summer dry spells on annual NEE is not straightforward, but the former seems to be the dom-inant driver based on our results (Table 1). The combined effects of a long, relatively 5
cold winter and warm, dry summer which could have slowed plant growth, disturbed the normal phenological cycle and enhanced carbon losses from the peatland through enhanced heterotrophic respiration, were illustrated in 2013 when the sink strength of Auchencorth Moss was dramatically weakened (−5.2 g C-CO2 m−2yr−1) compared to
the long-term mean of−64.1±33.6 g C-CO2m−2yr−1(2002–2012).
10
4.3 NEE in Northern Hemisphere Peatland C Budgets
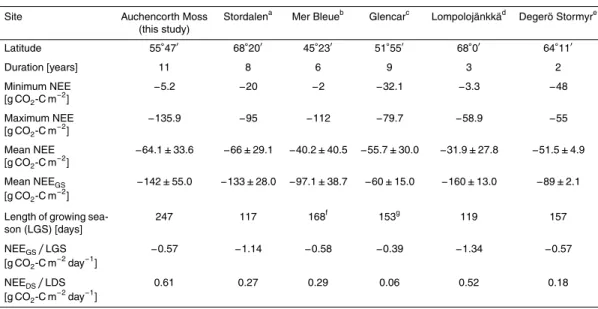
Compared to other peatlands in the Northern Hemisphere annual values of NEE at Auchencorth Moss are at the high end of both the mean (−64.1±33.6 g CO2 -C m−2yr−1) and inter-annual range (−5.2 to−135.9 g CO2-C m−2yr−1). However, when
the length of the growing season (LGS) is accounted for, the mean daily growing sea-15
son NEE (NEEGS) at Auchencorth Moss (−0.57 g CO2-C m −2
day−1) is remarkably sim-ilar to that found at both Mer Bleue (cool temperate bog; −0.58 g CO2-C m−2day−1;
Roulet et al., 2007) and Degerö Stormyr (boreal mire;−0.57 g CO2-C m−2day−1;
Nils-son et al., 2008). By contrast, mean daily NEEGS at Glencar (maritime blanket bog; Koehler et al., 2011; McVeigh et al., 2014) is slightly lower (−0.39 g CO2-C m−2day−1),
20
whilst the two sub-arctic Scandinavian peatlands Lompolojänkä (nutrient-rich sedge fen; Aurela et al., 2009) and Stordalen (sub-arctic palsa mire; Christensen et al., 2012) stand out with mean daily growing season NEE rates 2 to 2.5 times higher than the values found for Auchencorth Moss, Degerö Stormyr and Mer Bleue, and over 3 times higher than the value found at Glencar (Table 4).
25
Auchencorth Moss had a mean daily NEE during the dormant season (NEEDS) of 0.61 g CO2-C m
−2
BGD
11, 14981–15018, 2014
Drivers of long-term variability in CO2 net
ecosystem exchange
C. Helfter et al.
Title Page
Abstract Introduction
Conclusions References
Tables Figures
◭ ◮
◭ ◮
Back Close
Full Screen / Esc
Printer-friendly Version
Interactive Discussion
Discussion
P
a
per
|
Discus
sion
P
a
per
|
Discussion
P
a
per
|
Discussion
P
a
per
higher than that of Glencar, twice that of Mer Bleue and three times that of Degerö Stormyr and Stordalen). Mean daily NEEDS at Lompolojänkä was only slightly lower than at Auchencorth Moss (0.52 g CO2-C m
−2
day−1).
Despite the lower daily mean NEE, the long growing season at Auchencorth Moss made its total NEEGS comparable to that of Lompolojänkä and Stordalen. The vigor-5
ous net uptake at Lompolojänkä during the growing season was offset by relatively high carbon losses during the rest of the year. Auchencorth Moss, Lompolojänkä and Stordalen therefore had comparable NEE but for very different reasons: Auchencorth Moss had long growing seasons but also relatively high carbon losses the rest of the year, which could be due to milder winters with minimal snow cover. Lompolojänkä and 10
Stordalen had vigorous carbon uptake rates, their LGS were comparable to one an-other, but were half that of Auchencorth Moss, whilst Lompolojänkä had high carbon losses during the dormant season which strongly reduced the site’s sink strength.
Carbon uptake rates at Degerö Stormyr and Mer Bleue were very similar to Auchen-corth Moss but their carbon loss rates, which were comparable to Stordalen’s, were 15
a third of Auchencorth Moss’s. This could be explained by cooler climate and prolonged periods of snow cover compared to Auchencorth Moss.
Considering the differences in latitude, climate, hydrology and vegetation, these sites (with the exception of Stordalen) are remarkably similar in terms of their daily mean NEEGS. Excluding Stordalen, which represents an anomaly to the trend, a linear fit 20
between mean inter-annual NEE and length of the growing season for the 5 remaining sites yields anR2value of 0.84.
NEE represents only one flux pathway within the full net ecosystem C budget (NECB). When terrestrial CH4 emissions (2007–2008; Dinsmore et al., 2010), down-stream aquatic flux losses and water surface evasion (2007–2011; Dinsmore et al., 25
ap-BGD
11, 14981–15018, 2014
Drivers of long-term variability in CO2 net
ecosystem exchange
C. Helfter et al.
Title Page
Abstract Introduction
Conclusions References
Tables Figures
◭ ◮
◭ ◮
Back Close
Full Screen / Esc
Printer-friendly Version
Interactive Discussion
Discussion
P
a
per
|
Discus
sion
P
a
per
|
Discussion
P
a
per
|
Discussion
P
a
per
|
proximate total C sink strength of−17 g C m−2yr−1; for Degerö Stormyr the total C sink strength is 24 g C m−2yr−1 (Nilsson et al., 2008), 30 g C m−2yr−1for Glencar (Koehler et al., 2011) and 34 g C m−2yr−1for Stordalen (Christensen et al., 2012; Lundin et al., 2013; Olefeldt et al., 2013); data for Lompolojänkä could not be found. Hence when all flux pathways are accounted for the C balances of the different peatlands appear 5
to converge. Whilst further work is required to understand the processes and time-scales involved, the results suggest a potential internal feedback mechanism between different flux pathways.
5 Summary
Eleven years of continuous monitoring of net ecosystem exchange of carbon dioxide 10
at a temperate Scottish peatland revealed highly variable inter-annual dynamics de-spite little or no change in land management. Variation in climate and especially winter time air temperature is thought to be the dominant control at the study site. The lat-ter explained 87 % of inlat-ter-annual changes in NEE and a modest rise of 1◦C above average winter air temperature for the 2002–2013 study period was accompanied by 15
a 20 % increase in CO2uptake. Colder winters appear to have an adverse effect on the peatland’s CO2sink strength possibly due to disturbances to the phenological cycle of the graminoid species at the site. Dry spells have been linked to enhanced ecosystem respiration and depressed GPP and it is thought that (a) heterotrophic respiration can become the dominant term as water availability decreases, and (b) mosses are more 20
sensitive to WTD than other species at the site. Cold winters and dry summers both have negative effects on the CO2sink strength of the bog; these two factors converged in 2013 and led to a dramatic reduction in net CO2 uptake (−90 % compared to the 11 yr mean). Auchencorth Moss, although always a sink of CO2 during the study pe-riod, is highly sensitive to even modest changes in hydro-meteorological conditions at 25
BGD
11, 14981–15018, 2014
Drivers of long-term variability in CO2 net
ecosystem exchange
C. Helfter et al.
Title Page
Abstract Introduction
Conclusions References
Tables Figures
◭ ◮
◭ ◮
Back Close
Full Screen / Esc
Printer-friendly Version
Interactive Discussion
Discussion
P
a
per
|
Discus
sion
P
a
per
|
Discussion
P
a
per
|
Discussion
P
a
per
makes future trends difficult to predict especially in the event of significant changes in precipitation patterns and sporadic dry periods.
Acknowledgements. The authors acknowledge a succession of European projects (FP5
Car-boMont, FP6 NitroEurope, FP7 GHG Europe and ÉCLAIRE) and CEH carbon catchments for support of the measurements and data analysis. Measurements were supported by CEH col-5
leagues Ian Leith, Ivan Simmons and Sarah Leeson.
References
Aubinet, M., Grelle, A., Ibrom, A., Rannik, U., Moncrieff, J., Foken, T., Kowalski, A. S., Mar-tin, P. H., Berbigier, P., Bernhofer, C., Clement, R., Elbers, J., Granier, A., Grunwald, T., Morgenstern, K., Pilegaard, K., Rebmann, C., Snijders, W., Valentini, R., and Vesala, T.: Es-10
timates of the annual net carbon and water exchange of forests: the euroflux methodology, Adv. Ecol. Res., 30, 113–175, 2000.
Aurela, M., Laurila, T., and Tuovinen, J. P.: Seasonal CO2 balances of a subarctic mire, J. Geophys. Res.-Atmos., 106, 1623–1637, doi:10.1029/2000jd900481, 2001.
Aurela, M., Lohila, A., Tuovinen, J.-P., Hatakka, J., Riutta, T., and Laurila, T.: Carbon dioxide 15
exchange on a northern boreal fen, Boreal Environ. Res., 14, 699–710, 2009.
Baldocchi, D., Falge, E., Gu, L. H., Olson, R., Hollinger, D., Running, S., Anthoni, P., Bern-hofer, C., Davis, K., Evans, R., Fuentes, J., Goldstein, A., Katul, G., Law, B., Lee, X. H., Malhi, Y., Meyers, T., Munger, W., Oechel, W., Paw, K. T., Pilegaard, K., Schmid, H. P., Valentini, R., Verma, S., Vesala, T., Wilson, K., and Wofsy, S.: Fluxnet: a new tool to 20
study the temporal and spatial variability of ecosystem-scale carbon dioxide, water va-por, and energy flux densities, B. Am. Meteorol. Soc., 82, 2415–2434, doi:10.1175/1520-0477(2001)082<2415:fantts>2.3.co;2, 2001.
Bates, J. W., Thompson, K., and Grime, J. P.: Effects of simulated long-term climatic change on the bryophytes of a limestone grassland community, Glob. Change Biol., 11, 757–769, 25
doi:10.1111/j.1365-2486.2005.00953.x, 2005.
BGD
11, 14981–15018, 2014
Drivers of long-term variability in CO2 net
ecosystem exchange
C. Helfter et al.
Title Page
Abstract Introduction
Conclusions References
Tables Figures
◭ ◮
◭ ◮
Back Close
Full Screen / Esc
Printer-friendly Version
Interactive Discussion
Discussion
P
a
per
|
Discus
sion
P
a
per
|
Discussion
P
a
per
|
Discussion
P
a
per
|
Billett, M. F., Palmer, S. M., Hope, D., Deacon, C., Storeton-West, R., Hargreaves, K. J., Flechard, C., and Fowler, D.: Linking land-atmosphere-stream carbon fluxes in a lowland peatland system, Global Biogeochem. Cy., 18, GB1024, doi:10.1029/2003gb002058, 2004. Billett, M. F., Charman, D. J., Clark, J. M., Evans, C. D., Evans, M. G., Ostle, N. J., Worrall, F.,
Burden, A., Dinsmore, K. J., Jones, T., McNamara, N. P., Parry, L., Rowson, J. G., and 5
Rose, R.: Carbon balance of UK peatlands: current state of knowledge and future research challenges, Clim. Res., 45, 13–29, doi:10.3354/cr00903, 2010.
Bubier, J. L., Crill, P. M., Moore, T. R., Savage, K., and Varner, R. K.: Seasonal patterns and controls on net ecosystem CO2exchange in a boreal peatland complex, Global Biogeochem. Cy., 12, 703–714, doi:10.1029/98gb02426, 1998.
10
Christensen, T. R., Jackowicz-Korczynski, M., Aurela, M., Crill, P., Heliasz, M., Mastepanov, M., and Friborg, T.: Monitoring the multi-year carbon balance of a subarctic palsa mire with mi-crometeorological techniques, Ambio, 41, 207–217, doi:10.1007/s13280-012-0302-5, 2012. Clark, J. M., Billett, M. F., Coyle, M., Croft, S., Daniels, S., Evans, C. D., Evans, M., Freeman, C.,
Gallego-Sala, A. V., Heinemeyer, A., House, J. I., Monteith, D. T., Nayak, D., Orr, H. G., 15
Prentice, I. C., Rose, R., Rowson, J., Smith, J. U., Smith, P., Tun, Y. M., Vanguelova, E., Wetterhall, F., and Worrall, F.: Model inter-comparison between statistical and dynamic model assessments of the long-term stability of blanket peat in great britain (1940–2099), Clim. Res., 45, 227–281, doi:10.3354/cr00974, 2010.
Dinsmore, K. J., Skiba, U. M., Billett, M. F., and Rees, R. M.: Effect of water table on greenhouse 20
gas emissions from peatland mesocosms, Plant Soil, 318, 229–242, doi:10.1007/s11104-008-9832-9, 2009.
Dinsmore, K. J., Billett, M. F., Skiba, U. M., Rees, R. M., Drewer, J., and Helfter, C.: Role of the aquatic pathway in the carbon and greenhouse gas budgets of a peatland catchment, Glob. Change Biol., 16, 2750–2762, doi:10.1111/j.1365-2486.2009.02119.x, 2010.
25
Dinsmore, K. J., Billett, M. F., and Dyson, K. E.: Temperature and precipitation drive temporal variability in aquatic carbon and ghg concentrations and fluxes in a peatland catchment, Glob. Change Biol., 19, 2133–2148, doi:10.1111/gcb.12209, 2013.
Drewer, J., Lohila, A., Aurela, M., Laurila, T., Minkkinen, K., Penttila, T., Dinsmore, K. J., McKenzie, R. M., Helfter, C., Flechard, C., Sutton, M. A., and Skiba, U. M.: Comparison 30
BGD
11, 14981–15018, 2014
Drivers of long-term variability in CO2 net
ecosystem exchange
C. Helfter et al.
Title Page
Abstract Introduction
Conclusions References
Tables Figures
◭ ◮
◭ ◮
Back Close
Full Screen / Esc
Printer-friendly Version
Interactive Discussion
Discussion
P
a
per
|
Discus
sion
P
a
per
|
Discussion
P
a
per
|
Discussion
P
a
per
Foken, T. and Wichura, B.: Tools for quality assessment of surface-based flux measurements, Agr. Forest Meteorol., 78, 83–105, doi:10.1016/0168-1923(95)02248-1, 1996.
Frolking, S., Roulet, N. T., Moore, T. R., Richard, P. J. H., Lavoie, M., and Muller, S. D.: Mod-eling northern peatland decomposition and peat accumulation, Ecosystems, 4, 479–498, doi:10.1007/s10021-001-0105-1, 2001.
5
Gitelson, A. A., Peng, Y., Masek, J. G., Rundquist, D. C., Verma, S., Suyker, A., Baker, J. M., Hatfield, J. L., and Meyers, T.: Remote estimation of crop gross primary production with landsat data, Remote Sens. Environ., 121, 404–414, doi:10.1016/j.rse.2012.02.017, 2012. Gunnarsson, U.: Global patterns of sphagnum productivity, J. Bryol., 27, 269–279,
doi:10.1179/174328205x70029, 2005. 10
Hargreaves, K. J., Milne, R., and Cannell, M. G. R.: Carbon balance of afforested peatland in Scotland, Forestry, 76, 299–317, doi:10.1093/forestry/76.3.299, 2003.
Hendriks, D. M. D., van Huissteden, J., Dolman, A. J., and van der Molen, M. K.: The full greenhouse gas balance of an abandoned peat meadow, Biogeosciences, 4, 411–424, doi:10.5194/bg-4-411-2007, 2007.
15
Holden, J. and Rose, R.: Temperature and surface lapse rate change: a study of the uk’s longest upland instrumental record, Int. J. Climatol., 31, 907–919, doi:10.1002/joc.2136, 2011. IPCC: Technical Summary, Cambridge, UK, 19–92, 2007.
Irvine, J., Law, B. E., Martin, J. G., and Vickers, D.: Interannual variation in soil CO1efflux and the response of root respiration to climate and canopy gas exchange in mature ponderosa 20
pine, Glob. Change Biol., 14, 2848–2859, doi:10.1111/j.1365-2486.2008.01682.x, 2008. Jenkins, G., Perry, M., and Prior, J.: The Climate of the United Kingdom and Recent Trends,
Hadley Centre, Met Office, Exeter, 2009.
Koehler, A.-K., Sottocornola, M., and Kiely, G.: How strong is the current carbon seques-tration of an atlantic blanket bog?, Glob. Change Biol., 17, 309–319, doi:10.1111/j.1365-25
2486.2010.02180.x, 2011.
Kreyling, J., Beierkuhnlein, C., Pritsch, K., Schloter, M., and Jentsch, A.: Recurrent soil freeze-thaw cycles enhance grassland productivity, New Phytol., 177, 938–945, doi:10.1111/j.1469-8137.2007.02309.x, 2008.
Kreyling, J., Beierkuhnlein, C., and Jentsch, A.: Effects of soil freeze-thaw cy-30
BGD
11, 14981–15018, 2014
Drivers of long-term variability in CO2 net
ecosystem exchange
C. Helfter et al.
Title Page
Abstract Introduction
Conclusions References
Tables Figures
◭ ◮
◭ ◮
Back Close
Full Screen / Esc
Printer-friendly Version
Interactive Discussion
Discussion
P
a
per
|
Discus
sion
P
a
per
|
Discussion
P
a
per
|
Discussion
P
a
per
|
Lafleur, P. M., Roulet, N. T., Bubier, J. L., Frolking, S., and Moore, T. R.: Interannual variability in the peatland-atmosphere carbon dioxide exchange at an ombrotrophic bog, Global Bio-geochem. Cy., 17, 1036, doi:10.1029/2002gb001983, 2003.
Lafleur, P. M., Moore, T. R., Roulet, N. T., and Frolking, S.: Ecosystem respiration in a cool temperate bog depends on peat temperature but not water table, Ecosystems, 8, 619–629, 5
doi:10.1007/s10021-003-0131-2, 2005.
Law, B.: Carbon Dynamics in Response to Climate and Disturbance: Recent Progress From Multi-Scale Measurements and Modeling in Ameriflux, Plant Responses to Air Pollution and Global Change, edited by: Omasa, K., Nouchi, I., and DeKok, L. J., 205–213, 2005.
Lindroth, A., Lund, M., Nilsson, M., Aurela, M., Christensen, T. R., Laurila, T., Rinne, J., Ri-10
utta, T., Sagerfors, J., Stroem, L., Tuovinen, J.-P., and Vesala, T.: Environmental controls on the CO2exchange in north european mires, Tellus B, 59, 812–825, doi:10.1111/j.1600-0889.2007.00310.x, 2007.
Loisel, J., Gallego-Sala, A. V., and Yu, Z.: Global-scale pattern of peatlandSphagnumgrowth driven by photosynthetically active radiation and growing season length, Biogeosciences, 9, 15
2737–2746, doi:10.5194/bg-9-2737-2012, 2012.
Lund, M., Christensen, T. R., Lindroth, A., and Schubert, P.: Effects of drought conditions on the carbon dioxide dynamics in a temperate peatland, Environ. Res. Lett., 7, 045704, doi:10.1088/1748-9326/7/4/045704, 2012.
Lundin, E. J., Giesler, R., Persson, A., Thompson, M. S., and Karlsson, J.: Integrating carbon 20
emissions from lakes and streams in a subarctic catchment, J. Geophys. Res.-Biogeo., 118, 1200–1207, doi:10.1002/jgrg.20092, 2013.
Macdonald, J. A., Fowler, D., Hargreaves, K. J., Skiba, U., Leith, I. D., and Murray, M. B.: Methane emission rates from a northern wetland; response to temperature, water table and transport, Atmos. Environ., 32, 3219–3227, doi:10.1016/s1352-2310(97)00464-0, 1998. 25
McVeigh, P., Sottocornola, M., Foley, N., Leahy, P., and Kiely, G.: Meteorological and functional response partitioning to explain interannual variability of CO2 exchange at an Irish atlantic blanket bog, Agr. Forest Meteorol., 194, 8–19, doi:10.1016/j.agrformet.2014.01.017, 2014. Nilsson, M., Sagerfors, J., Buffam, I., Laudon, H., Eriksson, T., Grelle, A., Klemedtsson, L.,
Weslien, P., and Lindroth, A.: Contemporary carbon accumulation in a boreal oligotrophic 30
BGD
11, 14981–15018, 2014
Drivers of long-term variability in CO2 net
ecosystem exchange
C. Helfter et al.
Title Page
Abstract Introduction
Conclusions References
Tables Figures
◭ ◮
◭ ◮
Back Close
Full Screen / Esc
Printer-friendly Version
Interactive Discussion
Discussion
P
a
per
|
Discus
sion
P
a
per
|
Discussion
P
a
per
|
Discussion
P
a
per
Olefeldt, D., Roulet, N., Giesler, R., and Persson, A.: Total waterborne carbon export and doc composition from ten nested subarctic peatland catchments – importance of peatland cover, groundwater influence, and inter-annual variability of precipitation patterns, Hydrol. Process., 27, 2280–2294, doi:10.1002/hyp.9358, 2013.
Reichstein, M., Falge, E., Baldocchi, D., Papale, D., Aubinet, M., Berbigier, P., Bernhofer, C., 5
Buchmann, N., Gilmanov, T., Granier, A., Grunwald, T., Havrankova, K., Ilvesniemi, H., Janous, D., Knohl, A., Laurila, T., Lohila, A., Loustau, D., Matteucci, G., Meyers, T., Migli-etta, F., Ourcival, J. M., Pumpanen, J., Rambal, S., Rotenberg, E., Sanz, M., Tenhunen, J., Seufert, G., Vaccari, F., Vesala, T., Yakir, D., and Valentini, R.: On the separation of net ecosystem exchange into assimilation and ecosystem respiration: review and improved algo-10
rithm, Glob. Change Biol., 11, 1424–1439, doi:10.1111/j.1365-2486.2005.001002.x, 2005. Roulet, N. T., Lafleur, P. M., Richard, P. J. H., Moore, T. R., Humphreys, E. R., and Bubier, J.:
Contemporary carbon balance and late holocene carbon accumulation in a northern peat-land, Glob. Change Biol., 13, 397–411, doi:10.1111/j.1365-2486.2006.01292.x, 2007. Ryan, M. G. and Law, B. E.: Interpreting, measuring, and modeling soil respiration, Biogeo-15
chemistry, 73, 3–27, doi:10.1007/s10533-004-5167-7, 2005.
Sottocornola, M. and Kiely, G.: Hydro-meteorological controls on the CO2 ex-change variation in an irish blanket bog, Agr. Forest Meteorol., 150, 287–297, doi:10.1016/j.agrformet.2009.11.013, 2010.
St-Hilaire, F., Wu, J., Roulet, N. T., Frolking, S., Lafleur, P. M., Humphreys, E. R., and Arora, V.: 20
McGill wetland model: evaluation of a peatland carbon simulator developed for global as-sessments, Biogeosciences, 7, 3517–3530, doi:10.5194/bg-7-3517-2010, 2010.
UK Meteorological Office: Met office integrated data archive system (midas) land and marine surface stations data (1853–current), in: NCAS British Atmospheric Data Centre, available at: http://badc.nerc.ac.uk/view/badc.nerc.ac.uk__ATOM__dataent_ukmo-midas, 2013. 25
Updegraff, K., Bridgham, S. D., Pastor, J., Weishampel, P., and Harth, C.: Response of CO2 and CH4 emissions from peatlands to warming and water table manipulation, Ecol. Appl., 11, 311–326, doi:10.2307/3060891, 2001.
van der Molen, M. K., Dolman, A. J., Ciais, P., Eglin, T., Gobron, N., Law, B. E., Meir, P., Pe-ters, W., Phillips, O. L., Reichstein, M., Chen, T., Dekker, S. C., Doubkova, M., Friedl, M. A., 30
BGD
11, 14981–15018, 2014
Drivers of long-term variability in CO2 net
ecosystem exchange
C. Helfter et al.
Title Page
Abstract Introduction
Conclusions References
Tables Figures
◭ ◮
◭ ◮
Back Close
Full Screen / Esc
Printer-friendly Version
Interactive Discussion
Discussion
P
a
per
|
Discus
sion
P
a
per
|
Discussion
P
a
per
|
Discussion
P
a
per
|
Wang, G.: Drought and ecosystem carbon cycling, Agr. Forest Meteorol., 151, 765–773, doi:10.1016/j.agrformet.2011.01.018, 2011.
Weltzin, J. F., Pastor, J., Harth, C., Bridgham, S. D., Updegraff, K., and Chapin, C. T.: Response of bog and fen plant communities to warming and water-table manipulations, Ecology, 81, 3464–3478, doi:10.1890/0012-9658(2000)081[3464:robafp]2.0.co;2, 2000.
5
BGD
11, 14981–15018, 2014
Drivers of long-term variability in CO2 net
ecosystem exchange
C. Helfter et al.
Title Page
Abstract Introduction
Conclusions References
Tables Figures
◭ ◮
◭ ◮
Back Close
Full Screen / Esc
Printer-friendly Version
Interactive Discussion
Discussion
P
a
per
|
Discus
sion
P
a
per
|
Discussion
P
a
per
|
Discussion
P
a
per
Table 1.Spearman’s rank correlation coefficients (ρ) and associatedpvalues for all statistically significant inter-annual correlations between ecosystem response and hydro-meteorological parameters observed at Auchencorth Moss during the study period 2003–2013. The suffix SS denotes spring/summer means and LGS is the length of the growing season. GPPsatandαare GPP at light saturation and quantum efficiency, respectively, obtained by non-linear regression between GPP and PAR using Eq. (4).
Ecosystem response Parameter ρ pvalue
NEESS WinterTair −0.96 ≪0.01
NEE (annual) LGS −0.80 <0.01
GPPSS WinterTair 0.73 <0.01
RecoSS WinterTair 0.61 0.02
GPPsat WinterTair 0.68 0.02
α WinterTair 0.68 0.02
BGD
11, 14981–15018, 2014
Drivers of long-term variability in CO2 net
ecosystem exchange
C. Helfter et al.
Title Page
Abstract Introduction
Conclusions References
Tables Figures
◭ ◮
◭ ◮
Back Close
Full Screen / Esc
Printer-friendly Version
Interactive Discussion
Discussion
P
a
per
|
Discus
sion
P
a
per
|
Discussion
P
a
per
|
Discussion
P
a
per
|
Table 2.Water table drainage rates and maximum water table depths (WTD) observed during the summer dry spells of 2008 and 2010. The time lag is the number of days elapsed between the start of the dry period and the onset of a response from the ecosystem respiration (Reco); the
time lag was determined by optimising the polynomial fit betweenRecoand WTD. The minimum
value ofRecofor each dry spell and the water table depth corresponding to each minimum value
ofRecowere calculated using a second degree polynomial regression functions betweenReco
and WTD.
Period Drainage rate Maximum Time lag MinimumReco WTD for minimum MeanTair Wind direction [cm day−1] WTD [cm] [days] [µmol m−2s−1] Reco[cm] [◦
C] [◦
]
5–29 May 2008 1.2 20.4 2 0.03 1.5 10.1 70
22 Jul–1 Aug 2008 3.0 19.1 3 2.31 4.5 16.1 100
15–26 May 2010 1.6 30.7 2 1.05 15.6 12.9 181
9–24 Jun 2010 2.0 36.1 0 1.58 12.5 13.0 176