Vol.58, n.2: pp. 262-271, March-April 2015 http://dx.doi.org/10.1590/S1516-8913201500371
ISSN 1516-8913 Printed in Brazil
BRAZILIAN ARCHIVES OF BIOLOGY AND TECHNOLOGY
A N I N T E R N A T I O N A L J O U R N A L
Physicochemical and Antioxidant Properties of Kiwifruit as
a Function of Cultivar and Fruit Harvested Month
Ramesh Singh Pal
*, Vandana A Kumar
1, Sandeep Arora
2, A K Sharma
3, Virendra Kumar
4and Sanjeev Agrawal
11
Department of Biochemistry; College of Basic Science and Humanities; Govind Ballabh Pant University of Agriculture and Technology; Pantnagar - Uttarakhand - India. 2Department of Molecular Biology and Genetic Engineering, CBSH, GBPUA &T; Pantnagar - Uttarakhand - India. 3Department of Biological Science; CBSH, GBPUA &T, Pantnagar - Uttarakhand - India. 4Department of Chemistry; CBSH, GBPUA &T, Pantnagar - Uttarakhand - India.
ABSTRACT
The present study was carried out to find the effect of fruit harvesting stage (October, November and December) on the physicochemical and antioxidant properties in five kiwi cultivars (Abbot, Bruno, Allison, Hayward, Monty). Results showed that soluble solid content (SSC) and pH increased while ascorbic acid (Vit C), titrated acidity (TAD) and SSC/TAD decreased in all the cultivars with delay in harvesting. Total polyphenols (TP) were decreased while total flavonoids (TF) increased in all tested cultivars with delay in harvesting. The highest concentration of TP (2.02 mg gallic acid equivalent/g fresh weight) and TF (51.12 mg catechin equivalent/100g FW) were found in cultivar
‘Allison’ in the month of October and December, respectively. Antioxidant activities (AA) were genotype depended
and no trend was observed with month of harvesting. Principal component analysis (PCA) showed strong correlation between Vit C, TP and antioxidant activities. Two major clusters were computed using agglomerative hierarchical clustering (AHC). All the studied important traits may be used in the breeding programmes to increase the variability for different physiochemical and antioxidative characteristics and to make suitable selections that could be acceptable to consumers.
Key words: Antioxidant Properties, Kiwi Fruit,Fruit Harvest Month, Physicochemical Properties
*Author for correspondence: ramesh_bio2006@rediffmail.co m
INTRODUCTION
Actinidia chinensis L., (syn. A. deliciosa) is a commercial crop in New Zealand and other countries such as Chile, China and Italy (Ferguson and Huang 2007; Nishiyama 2007). In India, the area under this fruit is very less, due to its exotic introduction. With extensive research and developmental support, its commercial cultivation in India has been extended to the mid-hills of
Himachal Pradesh, Jammu-Kashmir and
Arunachal Pradesh. Kiwifruits are normally consumed as fresh fruit, because fresh peel of fruit
Soluble solids content (SSC) includes molecules that are truly soluble in an aqueous sample. In commercial standards, the SSC of a ripe fruit is often used to indicate its sweetness (Crisosto and Crisosto 2001). SSC is measured as the units of Brix value that is defined as percent sucrose by weight. SSC has been shown to reflect the eating quality of ripe fruit. The ratio of sugar to organic acids (SSC/TAD) has been related to flavor quality for a variety of fruit and indicate the optimum time for harvesting (Burdon et al. 2004).
Healthful attributes of kiwifruit are high ascorbic
acid levels (Ferguson and Huang 2007),
polyphenols (Sheng et al. 2005), and the presence of flavonoids (Atkinson and Macrae 2007). Kiwifruits are used for the treatment of many different types of cancers, e.g., stomach, lung, and liver cancer (Yang 1981) in traditional medicine. Some studies have shown that the extracts of kiwi fruits inhibit cancer cell growth (Song 1984) and exhibit cell protection against oxidative DNA damage in vitro (Collins et al. 2001).
Antioxidants have become a popular research topic because they can not be generated by the human body and hence have to be consumed in the diet. They may be defined as any substance that when present at low concentrations significantly delays or prevents the oxidation of that substrate in a chain reaction (Halliwell and Whiteman 2004). Many fruit and vegetables are rich sources of antioxidants. Kiwi fruit has been well described for its composition. A lot of work has been done on the biological activities of kiwi fruit but very little information is currently available about the antioxidant activity of this fruit at different harvesting stage. Therefore, in the present study, the physicochemical and antioxidant properties in five major kiwi fruit cultivars at three different stages of fruit harvesting were investigated.
MATERIAL AND METHODS
Material
Samples of kiwifruit (Actinidia deliciosa)
cultivars, viz. ‘Abbot’, ‘Allison’, ‘Bruno’, ‘Monty’ and ‘Hayward’ were harvested on 1st
October, 1st November and 1st December 2012 from the NBPGR regional station, Bhawali, Uttarakhand (mean temperature: 2–30°C, mean sea elevation: 60 m, annual rain fall: 1,200 - 1,300 mm, longitude: 510 09’ and latitude: 360 43’). Samples were brought to the laboratory under cold
condition (near 00C). The cultivation conditions were same for all the fruits. All fruit samples were washed in cold water, peeled, sliced and stored for further analysis.
Chemicals and Reagents
Tannic acid, catechins, 1,1-diphenyl-2-picryl-hydrazl (DPPH ), 2,2-azobis-3-ethylbenzthiazoline -6-sulphonic acid (ABTS), 6-hydroxy-2,5,7,8-tetramethylchroman-2-carboxylic acid (Trolox), 2, 4, 6- tripyridyl-s-triazine (TPTZ), ammonium persulfate (APS) were obtained from Sigma Chemical Co. (St. Louis, MO, USA) and all other chemicals and reagents were procured from Merck, India, Ltd. All the reagents were of analytical grade and double-distilled water was used throughout the analysis.
Determination of soluble solids content (SSC), titratable acidity (TAD), and pH
Ten grams of frozen fruit tissue were homogenized in pre-chilled 40 mL of double distilled water. The homogenate was centrifuged at 10,000 × g for 15 min at 40С. Soluble solids content (SSC), was measured by adding four drops of clarified extract onto a digital refrectometer calibrated in °Brix (grams of sucrose equivalent per 100 g of juice), and expressed as a percentage. Titratable acidity (TAD) and pH were determined using an automated titrimeter. Ten milliliter of clarified kiwifruit extracts were placed into a sample cup and titrated to the endpoint of pH 8.1 using 0.1 N sodium hydroxide. The results were expressed as % citric acid equivalent. SSC/TAD ratio was calculated by dividing the soluble solid content values by the titratable acidity values for each cultivar.
Determination of total polyphenols (TP)
Fresh edible part of Kiwi fruit pulp (5 ± 0.2 g) from each cultivar were homogenized in 25 mL of extraction solvent (Acetone: methanol: water: acetic acid; 40: 40: 20: 1) as described by Rababah et al. (2005) with some modification. The homogenate was transferred into a 50 mL centrifuge tube and incubated at 600С in a water bath for 1 h. Samples were centrifuged at 13,000 × g for 15 min at 40С, then filtered through Whatman filter paper no 1 and diluted to a final volume of 50 mL.
Total polyphenols (TP) content was determined spectrophotometrically by the Folin-Ciocalteu method (Singleton and Rossi 1965). Extracts (200
water. A blank was prepared using double distilled
water instead of a sample. Subsequently, 200 μL
of Folin-Ciocalteu Reagent (0.4 N) were mixed with the sample or blank. The reaction mixture was allowed to stand at room temperature for 6 min. and then 2.0 mL of 7% Na2CO3 solution were added to each mixture and allowed to stand at room temperature for 90 min. The absorbance was measured at 750 nm. A standard curve of gallic acid (purity ≥98%) was constructed (20-100 mg/L). Results are expressed as mg gallic acid equivalent (GAE) per 100 g fresh weight.
Determination of total flavonoids (TF)
Total flavonoids were estimated using the standard methodology of Sun et al (1998) with some modifications. To the freshly prepared extract (0.1 mL), 0.9 mL methanol, 2.5 mL of 1% vanillin reagent and 2.5 mL of 9M HCl was added. The solution was mixed thoroughly and absorbance at 500 nm was recorded after 20 min of incubation at 300C. Total flavonoids content was calculated from the standard calibration curve (10-100 mg/L) based on catechins (purity ≥ 96%) and result was expressed as mg catechins equivelent/100g fresh weight (FW).
Determination of ascorbic acid (Vita C)
Ascorbic acid was determined according to the
volumetric method (Thimmaiah 1999). Ten
milliliter of 4% oxalic acid was added to the standard solution of vitamin C (100µg/mL, purity
≥ 99%) and the resulting solution was titrated against 2, 6-dichloroindophenol dye until a pink colour end point was obtained and the titer value was noted as V1. Again, dried methanolic extract of each sample (500 mg) was extracted with 4% oxalic acid and volume was made to 100 mL. The filtered extract (5.0 mL) was mixed with 10 mL of 4% oxalic acid and titrated against 2, 6-dichloroindophenol dye until a pink colour end point was obtained and the titer value was noted as V2. Ascorbic acid content was calculated based on the following equation: Amount of ascorbic acid (mg/100 g sample) = 0.5 mg × V2 × 100 mL /
V1 × 15 mL × Wt. of samples × 100, where V1 and V2 were the volume of the dye used to titrate vitamin C and sample extract, respectively. The result was expressed as mg ascorbic acid /100 g fresh weight (FW) of the plant material.
Extraction for antioxidant activities (AA)
For the antioxidant activity evaluation, kiwifruit tissues were extracted by homogenizing 5.0 g of frozen fruit (5 ± 0.2 g) in 25 mL of 80% ethanol. Samples were transferred into 50 mL centrifuge tubes and sonicated for 3 min to obtain a uniform consistent sample. Sonicated samples were centrifuged at 12,000 × g for 15 min at 40С, filtered through Whatman No1 filter paper and diluted to a final volume of 50 mL. All the assays were carried out in triplicate and the results were expressed as mean values ± standard deviations.
Determination of scavenging effects on DPPH radicals
The DPPH assay was done by measuring the decrease in absorbance of methanolic DPPH solution at 515 nm in the presence of the extract
(Brand-Williams et al. 2005) with some
modifications. The stock solution was prepared by dissolving 24 mg DPPH with 100 mL methanol and then stored at -200C until further use. The working solution was obtained by mixing 10 mL stock solution with 45 mL methanol to get an absorbance of 1.17 ± 0.02 units at 515 nm. Fruit extracts (150 µL) of different cultivar were allowed to react with 2850 µL of the DPPH solution for 24 h in the dark and absorbance was taken at 515 nm. Butylated hydroxytoluene (BHT) was employed as a reference and the radical scavenging activity was calculated as a percentage of DPPH discoloration using the equation:
DPPH radical scavenging (%) = [(Acontrol – Asample)/Acontrol] × 100
Where Asample is the absorbance of the solution when the extract/reference has been added at a particular level, and Acontrol is the absorbance of the DPPH solution without addition of extract.
Determination of scavenging effect on ABTS radicals
3.0 mL methanol to obtain an absorbance of 0.9 ± 0.02 units at 745. Fruit extracts (200 µL) of different cultivars were allowed to react with 2000 µL of the ABTS solution for 30 min in dark condition and absorbance was taken at 745 nm. BHT was employed as a reference and the percentage inhibition was calculated using the equation:
ABTS radical scavenging (%) = [(Acontrol – Asample)/Acontrol] × 100
Where Asample is the absorbance of the solution when the extract/reference has been added at a particular level, and Acontrol is the absorbance of the ABTSsolution without extract.
Determination of ferric reducing antioxidant power (FRAP)
The FRAP assay was done according to standard methodology of Benzie and Strain (1996) with some modifications. The stock solutions included 300 mM acetate buffer of pH 3.6, 10 mM TPTZ (2, 4, 6- tripyridyl-s-triazine) solution in 40 mM HCl, and 20 mM FeCl3.6H2O solution. The fresh working solution was prepared by mixing 25 mL acetate buffer, 2.5 mL TPTZ solution, and 2.5 mL FeCl3.6H2O solution and solution was warmed at 370C at the time of use. Fruit extracts (150 µL) were allowed to react with 2,850 µL of the FRAP solution for 30 min in the dark condition. Absorbance of the colored product (ferrous tripyridyltriazine complex) was taken at 593 nm. The FRAP value was determined by plotting a standard curve (10-100 μM) produced by the addition of Trolox (Merck, Darmstadt, Germany) to the FRAP reagent and was expressed as equivalents of trolox (µM Trolox/g FW).
Determination of total antioxidant activity
The total antioxidant activity of the methanolic extract of both the sample was measured
spectrophotometrically using a
phosphomolybdenum method (Prieto et al. 1999), based on the reduction of Mo (VI) to Mo (V) by the sample analyte and the subsequent formation of specific green phosphate / Mo (V) compounds. Fruit extracts (0.3 mL) were combined with 2.7 mL of the reagent solution (0.6 M sulfuric acid, 28 mM sodium phosphate and 4 mM ammonium molybdate). The sample was capped and incubated in a boiling water bath at 950C for 90 min. Samples were allowed to cool at room temperature
and absorbance was measured at 695 nm. A standard curve of trolox (10-100 μm) was prepared and total antioxidant activity was expressed as equivalents of trolox (µm Trolox/g FW).
Reducing power assay
The reducing power was determined according to the method of Huda-Faujan et al. (2009). Kiwi extracts (200 µL) were taken and volume was made up to 1.0 mL by adding distilled water. 2.5 mL of (0.2 M) sodium phosphate buffer (pH 6.6) and 2.5 mL of 1% potassium ferricyanide were added to solution. The mixture was incubated at 500C for 20 min and 2.5 mL of 10% trichloroacetic acid (w/v) was added to mixture and it was centrifuged at 3000 × g for 10 min. The upper layer (2.5 mL) was mixed with 2.5 mL deionized water and 0.5 mL of 0.1% of ferric chloride. The absorbance was measured at 700 nm. Higher absorbance indicates higher reducing power. Butylated hydroxytoluene (BHT) was used as a reference for comparison.
Statistical analysis
The statistical analyses were performed using the statistical package SPSS (Statistical Package for Social Science, SPSS Inc., Chicago, IL). Analyses of variance were performed by the ANOVA procedure and significance of each group was verified with one-way analysis of variance
followed by Duncan’s multiple range test (P <
0.05). For multifactorial comparison, principal component analyses (PCA) and agglomerative hierarchical clustering (AHC) were used to display the correlation between the various parameters and their relationship with the different kiwi fruit cultivars. Varimax rotation was performed to produce orthogonal transformations to the reduced factors to identify the high and low correlations better. Multifactorial analysis was carried out using the XLStat-Pro 7.5 (Addinsoft, New York, USA).
RESULTS AND DISCUSSION
Five kiwifruit cultivars were categorized according to their physicochemical properties (Table 1). pH values of the five cultivars were found
December. Lowest pH values were recorded for
‘Bruno’ in the month of November (3.25) and
December (4.21) (Table 1). pH of fruit pulp of all the cultivars was lower at the start of fruit development and significantly increased as fruit matured.
Titrated acidity (TAD) varied significantly among most of the cultivars (Table 1). TAD in all the cultivars was higher at the start of fruit development, but it decreased as the fruit matured.
In the month of October and November, ‘Bruno’
contained the highest TAD, 0.70 and 0.66, respectively, while in the month of December the highest TAD was shown by Allison (0.49).
‘Abbot’ contained the lowest TAD in the month of
October (0.51) and November (0.41) among all the
cultivars. These results indicated that ‘Bruno’ had
a more acidic flavor than the other cultivars. pH
and TAD are known to contribute significantly to desirable consumer perception (Ming-Wei Sherry Kao 2006).
Soluble solids content (SSC) ranged from 8.34 (Bruno of October month) to 14.89 % (Abbot of December month) (Table 1). Abbot had the highest SSC content in the month of November (13.17 %) and December (14.89 %), followed by
‘Monty’ in same months, while lowest was
recorded for ‘Bruno’ for all the harvested months. These results showed that the more acidic flavor cultivars had a less sweet flavor, which was in agreement with earlier report (Mansour and Jila, 2010). SSC/TAD ratio ranged from 11.91 to 36.33
(Table 1). ‘Abbot’ had the highest SSC/TAD ratio
followed by ‘Monty’ of the December month
harvest, which indicated more desirable flavor.
Table 1 - Physicochemical properties of five kiwifruit cultivars measured at 3 different fruit harvesting Months. Cultivar
name
pH TAD% SSC (%) SSC/TAD
Oct Nov Dec Oct Nov Dec Oct Nov Dec Oct Nov Dec
Abbot 3.20a 3.87a 4.45a 0.51c 0.41c 0.41bc 10.53a 13.17a 14.89a 20.52a 32.63a 36.33a
Bruno 2.88a 3.25d 4.21a 0.70a 0.66a 0.44ab 8.34c 9.80d 11.17c 11.91d 14.94c 25.17c
Allison 2.95a 3.29d 4.38a 0.68a 0.54b 0.49a 9.55b 11.89b 13.59b 13.96c 21.94b 27.89bc
Hayward 3.13a 3.64c 4.57a 0.60b 0.54b 0.37c 8.72c 10.79c 11.74c 14.47c 19.93bc 32.06ab
Monty 2.57a 3.78b 4.58a 0.60b 0.52b 0.41bc 10.67a 12.67ab 14.36ab 17.59b 24.48b 35.17a
Different letters in the same column indicate significant difference using LSD (p ≤ 0.05); TAD- titratable acidity; SSC-soluble solids content. Values are the mean of three determinations.
Ascorbic acid content showed a continuous significant decrease quantitatively with the maturity of the fruit from October to December. During October harvest, its content ranged from 96.53 (Bruno) to 77.56 (Monty) mg 100 g−1 fresh
weight (Table 2). The ‘Bruno’ cultivars had the
highest ascorbic acid content in all the three harvests, which confirmed the findings of Mahboube et al. (2010). The lowest ascorbic acid
content was recorded in cultivar ‘Monty’ in all the
three months harvest. The results on the decrease in the ascorbic acid content with maturity of the
fruits were similar to many earlier published results (Sahari et al. 2004; Tavarani et al. 2008). In present study, total phenolic content was significantly higher at the start of fruit development, but decreased as the fruit matured, which confirmed the findings of Hui-Na CHOU et
al. (2008). Total phenolic contents of ‘Abbot’ was 2.15, 1.57 and 0.84 mg GAE/gram FW in the month of October, November and December harvests, respectively. In month of December,
‘Abbot’ showed highest decrease in polyphenolic
content as compared to the other cultivars.
Table 2 - Total phenolis (TP), Total flavonoids (TF) and Vitamin C concentrations of five kiwifruit cultivars measured at 3 different fruit harvesting Months.
Cultivar name
Total phenols (mg GAE/gram FW)
Total flavonoids (mg CE/100g FW)
Vitamin C (mg/100 gram)
Oct Nov Dec Oct Nov Dec Oct Nov Dec
Different letters in the same column indicate significant difference using LSD (p ≤ 0.05); GAE-gallic acid equivalence, CE-catechins equivalence, FW-fresh weight. Values are the mean of three determinations
‘Hayward’ showed lowest content of polyphenols
as compared to other cultivars in the month of October and November (Table 2). The kiwifruit had significantly lower total flavonoids content at the start of fruit development, which increased as
the fruit matured. ‘Allison’ contained the highest
total flavonoids during all the three months (Table 2) while the lowest was recorded in ‘Monty’ in all the three months. At full maturity in December month, total flavonoids varied from 51.12 to 12.34 mg CE/100g FW. The range of phenolics and total flavonoids was in agreement with the previous study (Ming-Wei Sherry Kao 2006).
Free radical scavenging activities were measured via the ABTS and DPPH radical scavenging assays (Fig. 1). The kiwifruit had significantly higher radical scavenging activities at the start of fruit development, but it decreased as the fruit matured. Both assays showed similar trends in all
the cultivar. ‘Allison’ had the highest free radical scavenging activities for all the three months
harvest, followed by ‘Abbot’ for the month of October, ‘Bruno’ for the month of November, and ‘Hayward’ for the month of December (Fig. 1), which was in accordance with the finding of Ming-Wei Sherry Kao (2006). The DPPH radical scavenging ranged from 16.02 (Monty, December) to 64.63 % (Allison, October), while ABTS radical scavenging inhibition ranged from 16.75 (Bruno,
December) to 66.35 % (Bruno, October)
inhibition. Vitamin C (ascorbate) and polyphenols contribute a large portion of the free radical scavenging activities because these are the most effective antioxidants in the fruits and vegetables (Pal et al. 2013). The ABTS radical method is an excellent tool for determining the ability of antioxidants to quench free radicals both in aqueous and organic phase (Kim et al. 2002; Leong and Shi 2002). High free radical quenching activities associated with DPPH radicals indicated that the antioxidants were more lipids soluble and had preference toward the lipid peroxyl radicals. Ferric reducing antioxidant power (FRAP) assay and total antioxidant activity was carried out for all the five tested kiwi fruit cultivars during three months of fruit harvesting. Results showed that
‘Allison’ showed highest (353.33 µM Trolox/g FW), while ‘Monty’ showed lowest (97.80 µM
Trolox/g FW) ferric reducing antioxidant power for the month of October. In November, maximum
FRAP activity was showed by ‘Bruno’, followed
by ‘Allison’ and minimum by ‘Monty’ (Fig. 2). In the month of December; ‘Allison’, ‘Hayward’ and ‘Monty’ were at par with each other. Total
antioxidant activity was recorded highest in
cultivar ‘Allison’ in all the studied months, followed by ‘Monty’ in October and December. In November, ‘Abbot’, ‘Bruno’ and ‘Hayward’ were
at par with each other. The total antioxidant activity ranged from 250.49 (Monty, December) to 585.71 (Allison, October) µM Trolox/g FW.
Figure 1 - Scavenging effect of kiwi fruit cultivars on DPPH and ABTS free radicals during October, November and December months. Each value is expressed as mean + standard error (n=3).
Total antioxidant activity is highly correlated with total polyphenol content. Various antioxidative metabolites might react with free radicals, particularly peroxy radicals, which are the major propagators of the fat autoxidation chain (Rangkadilok et al. 2007). The antioxidant capacity of natural antioxidants is due to the termination of the free radical chain reaction (Shimada et al. 1992). The greater number of hydroxyl groups in polyphenol could increase the antioxidant activity of the plant material containing higher amount of these secondary metabolites (Rangkadilok et al. 2007).
Reducing power serves as a significant indicator of potential antioxidant. Three different fruit harvesting months were used to evaluate the reducing power of five different cultivars of kiwi fruit. Results showed that kiwifruits had significantly lower reducing power at the start of fruit development, but this increased as the fruits matured (Fig. 3). Cultivar ‘Allison’ showed highest reducing power in all the harvested months
while ‘Abbot’ showed lowest reducing power
(0.175) in December harvest. In October, (0.61) and in November (0.82) lowest reducing power were recorded in cultivar ‘Monty’. Similar observations of antioxidant properties in terms of reducing power activity have been reported for kiwi fruit by Bekhradnia et al. (2011). It was reported that reducing power activities are associated with the presence of reducing agents, which showed antioxidant action by donating a hydrogen atom and breaking the free radical chain (Mathew and Abraham 2006).
Figure 3 - Reducing power of kiwi fruit cultivars during October, November and December month. Each value is expressed as mean + standard error (n=3).
Principal Component Analysis (PCA) is a useful statistical technique, which has found application to find out interrelationships between the different variables (Mishra et al. 2013). Multifactorial comparisons using principal component analysis clearly indicated correlation between various antioxidant parameters and their relationship in different kiwi fruit cultivars. The principal component analysis (PCA) and their correlation are shown in Figure 4A. among the data, first factor F1 represented 40.32% of variability, while the second factor F2 represented 38.14% of variability. Almost all the parameters were occupied on the upper side of the biplot, and
among the parameters, the TP- (Total
Polyphenols), ABTS- (ABTS•+) radical scavenging activity (Oct-October, Nov-November, Dec- December), FRAP (Oct-October, Nov-November,
Dec- December), DPPH- DPPH• radical
scavenging activity (Oct-October, Nov-November, Dec- December), TF- Total Flavonoids, RP- Reducing power (Oct-October, Nov-November, Dec- December), Vit C- (Vitamin C) and TA- Total Antioxidant (Oct-October, Nov-November, Dec- December) was found occupied at left upper side of biplot. This suggested that vitamin C and total antioxidant activity had positive correlation, while
ABTS and FRAP showed higher positive
correlation. Also, total polyphenols, vitamin C, ABTS and DPPH showed positive correlation with one another. Physiochemical parameters such as pH, SSC, SSC/ TAD showed negative correlations with Vit C and FRAP Value. The ‘Allison’,
‘Bruno’ and ‘Hayward’ wereobserved at right side of biplot, showing high positive loadings to F1,
while ‘Abbot’ and ‘Monty’ were observed at left side of biplot, showing high negative loadings to F2.
The interpretation of the PCA results could be explained by the positioning of the kiwi fruit cultivars and antioxidant related parameters by superimposition of respective PCA plots (Fig. 4A and Fig. 4B). Superimposition showed that
‘Allison’ possessed higher ABTS radical scavenging activity, DPPH radical scavenging activity, FRAP, total flavonoids, reducing power
while ‘Abbot’ was superior in containing pH, SSC,
SSC/ TAD.
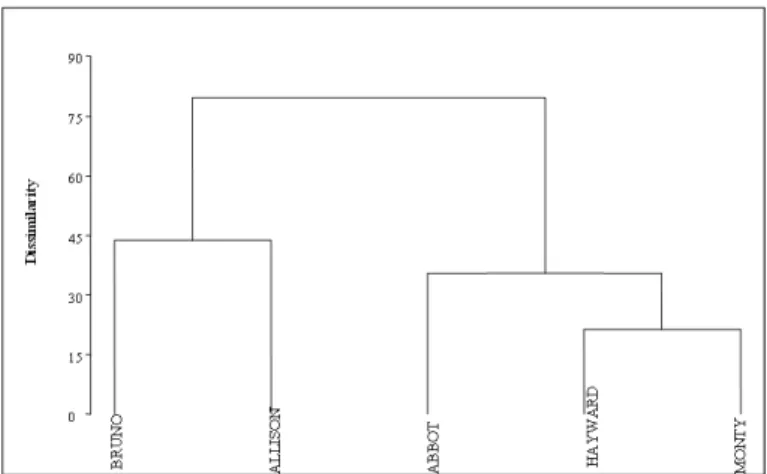
the basis of the variables introduced in the present
analysis, cluster 1 consisted of ‘Bruno’ and ‘Allison’ and cluster 2 comprised of ‘Abbot’, ‘Hayward’ and ‘Monty’. All the studied important
traits could be used in the breeding programs to
increase the variability for different
physiochemical and antioxidative characteristics and to make suitable selections that could be acceptable to the consumers.
Variable s afte r Varimax rotation (axe s F1 and F2: 78.46 %)
TP o ctTP no v TP d ec TF o ct TF no v TF d ec
Vit a C o ct Vit a C no v Vit a C d ec DPPH o ct
DPPH no v
DPPH d ec ABTS o ct
ABTS no v
ABTS d ec FRAP o ct
FRAP no v
FRAP d ec TA o ct TA no vTA de c
RP o ct RP no v RP d ec
SSC o ct SSC no v SSC d ec
p H o ct
p H no v p H d ec
TAD o ct
TAD no v TAD d ec
SSC/ TAD o ct SSC/ TADno v
SSC/ TAD d ec
-1 -0.5 0 0.5 1
-1 -0.5 0 0.5 1
-- axis F1 (40.32 %) -->
a
x
is
F
2
(
3
8
.1
4
%)
-->
Observations after Varimax rotation (axes F1 and F2: 78.46 % )
Abbot
Bruno Allison
Hayward
Monty
-2 -1.5 -1 -0.5
0 0.5 1 1.5 2
-2 -1.5 -1 -0.5 0 0.5 1 1.5 2
-- axis F1 (40.32 % ) -->
a
x
is
F
2
(
3
8
.1
4
%)
-->
(a) (b)
Figure 4 - (a) Multifactorial comparison and correlation matrix of physiochemical and antioxidant parameters obtained from kiwi fruit cultivars using Principal component analysis (PCA). Parameter codes: TP- Total Polyphenols, ABTS- ABTS•+ radical scavenging activity (Oct-October, Nov-November, Dec- December), FRAP- (Oct-October, Nov-November, Dec- December), DPPH- DPPH• radical scavenging activity (Oct-October, Nov-November, Dec- December), TF– Total Flavonoids, RP- Reducing power (Oct-October, Nov-November, Dec- December), TA- Total Antioxidant (Oct-October, Nov-November, Dec- December), Vita C– Vitamin C, SSC-soluble solids content, TAD - titratable acidity and pH (b) Multifactorial comparison of five kiwi fruit cultivars using principal component analysis (PCA).
On the basis of above results, it could be concluded that the antioxidant activity of different kiwi cultivars was dependent on the stage of fruit harvesting. In terms of antioxidant capacity and
phenolic compounds, ‘Allison’ was having highest
polyphenolic compounds and free radical
scavenging activities, while ‘Abbot’ was, superior in containing acidity, SSC, SSC/ TAD. October month harvested fruits showed higher antioxidant activities in most of the cases. Positive correlation between higher antioxidant activity and larger amount of total phenolics was found in most of the cases. Though other antioxidants were probably present in these crops, the phenolic compounds and vitamin C could make a significant contribution to the antioxidant activities. Further
studies on chemical characterization of
antioxidative components, which may have pharmacological or dietetic applications, may yield some more information regarding certain phytochemicals present in kiwi fruit in future.
ACKNOWLEDGEMENTS
Authors acknowledge the officer in-charge of
NBPGR (ICAR), regional station Bhawali,
Nainital for providing the samples and all kind of support.
REFERENCES
Arnao MB, Cano A, Acosta M. The hydrophilic and lipophilic contribution to total antioxidant activity.
Food Chem. 2001; 73:239-244.
Atkinson RG, Macrae EA. Kiwifruit. In: Pua EC, Davey MR (ed) Transgenic Crops V. Springer Berlin Heiderberg 2007; 60:329-346.
Bekhradnia S, Nabavi SM, Nabavi SF, Ebrahimzadeh MA. Antioxidant activity of kiwifruit (Actinidia chinensis). Pharmacology online. 2011; 1:758-764. Benzie I, Strain J. The ferric reducing ability of plasma
(FRAP) as a measure of antioxidant power: The FRAP assay. Anal Biochem. 1996; 239:70-76. Brand-Williams W, Cuvelier ME, Berset C. Use of free
radical method to evaluate antioxidant activity. LWT- Food Sci Technol. 1995; 28: 25-30.
Burdon J, McLeod D, Lallu N, Gamble J, Petley M, Gunson A. Consumer evaluation of "Hayward" kiwifruit of different at-harvest dry matter contents.
Postharvest Biol Technol. 2004; 34: 245-255.
Collins BH, Horska A, Hotten PM, Riddoch C, Collins AR. Kiwi fruit protects against oxidative DNA damage in human cells in vitro. Nutr Cancer. 2001; 39:148-153.
Crisosto CH, Crisosto GM. Understanding consumer
acceptance of early harvested ‘Hayward’ kiwifruit. Postharvest Biol Technol. 2001, 22:205-213. Ferguson AR, Huang HW. Genetic resources of
kiwifruit: domestication and breeding. Hort Rev.
2001; 33: 1-121.
Halliwell B, Whitemann M. Measuring reactive species and oxidative damage in vivo and in cell culture: how should you do it and what do the results mean? Br J Pharmacol. 2004; 142: 231-255.
Huda-Faujan N, Noriham A, Norrakiah AS, Babji AS. Antioxidant activity in plants methanol extract containing phenolic compounds. Afr J Biotechnol.
2009; 8:484-489.
Hui-Na C, Cheng-Chu N, Andi Shau-Mei O, Tse-Heng C, Chia-Chen C. Characterization of the physico-chemical and antioxidant properties of Taiwanese kiwifruit (Actinidia setosa). Bot Stud. 2008; 49: 215-224.
Kim KO, Lee KW, Lee HJ, Lee CY. Vitamin C equivalent Antioxidant capacity (VCEAC) of Phenolic Phytochemicals. J Agric Food Chem. 2002; 50: 3713-3717.
Leong LP, Shui G. An investigation of antioxidant capacity of fruits in Singapore markets. Food Chem. 2002; 76: 69-75.
Mahboube Z, Mohammad AS, Mohsen B, Hamidreza S. Physicochemical and Enzymatic Properties of Five Kiwifruit Cultivars during Cold Storage. Food Bioprocess Technol. 2010; 3: 239-246.
Mansour, AM, Jila RK. The comparison of carbohydrate and mineral changes in three cultivars of kiwifruit of Northern Iran during fruit development. Aust J Crop Sci. 2010; 4: 49-54. Mathew SA, Braham TE. In vitro antioxidant activity
and scavenging effects of Cinnamomum verum leaf extract assayed by different methodologies. Food Chem Toxicol. 2006; 44: 198-206.
Ming-Wei S, Kao A. Comparative Study of Antioxidant and Physicochemical Properties of Blackberry and Kiwifruit (Master of Science thesis) Auburn University. 2006.
Mishra KK, Pal RS, Arun KR, Chandrashekara C, Jain SK, Bhatt JC. Antioxidant properties of different edible mushroom species and increased bioconversion efficiency of Pleurotus eryngii using locally available casing materials. Food Chem. 2013; 138: 1557-1563.
Pal RS, Arun KR, Agrawal PK, Bhatt JC. Antioxidant capacity and related phytochemicals analysis of methanolic extract of two wild edible fruits from north western Indian Himalaya. Int J Pharm Bio Sci.
2013; 4: 113-123.
Prieto P, Pineda M, Aguilar M. Spectrophotometric quantization of antioxidant capacity through the formation of a phosphomolybdenum complex: Specific application to the determination of vitamin E. Anal Biochem. 1999; 269: 337-341.
Rababah TM, Ereifej KI, Howard L. Effect of ascorbic acid and dehydration on concentrations of total phenolics, antioxidant capacity, anthocyanins, and color in fruits. J Agric Food Chem. 2005; 53: 4444-4447.
Rangkadilok N, Sitthimonchai S, Worasuttayangkurn L, Mahidol C, Ruchirawat M, Satayavivad J. Evaluation of free radical scavenging and antityrosinase activities of standardized longan fruit extract. Food Chem Toxicol. 2007; 45: 328-336.
Sahari MA, Boostani M, Hamidi EZ. Effect of low temperature on the ascorbic acid content and quality characteristics of frozen strawberry. Food Chem. 2004; 86: 357-363.
Sheng Y, Akesson C, Holmgren K, Bryngelsson C, Giamapa V, Pero RW. An active ingredient of Cat's Claw water extracts: Identification and efficacy of quinic acid. J Ethnopharmacol. 2005; 96: 577-584.
Shimada K, Fujikawa K, Yahara K, Nakamura T. Antioxidative properties of xanthan on the autoxidation of soybean oil in cyclodextrin emulsion. J Agric Food Chem. 1992; 40: 945-948.
Singleton VL, Rossi JA. Colorimetry of total phenolics with phosphomolybdic phosphotungstic acid reagents. Am J Enol Vitic. 1965; 16: 144-158. Song P. Anticancer activity of Chinese kiwi fruit. Nutr
Res. 1984; 6: 109-114.
Sun B, da-Silva JM, Spranger I. Critical factors of vanillin assay for Catechins and Proanthocyanidins. J Agric Food Chem. 1998; 46: 4267-4274.
Tavarani S, Degl-Inocenti E, Remorini D, Massai R, Guidi L. Antioxidant capacity, ascorbic acid, total phenols and carotenoids changes during harvest and after storage of Hayward kiwifruit. Food Chem.
2008; 107: 282-288.
Thimmaiah SK. In: Standard method of Biochemical analysis, 3rd Edn, New Delhi Kalyani Publisher: 1999; pp. 278.
Yang JX. Chinese pharmaceuticals for cancers. Peking:
General people’s health Publishers. 1981; pp 121
-122.