ANDRÉ TEIXEIRA BENTO DAMAS MORA
ADVANCED IMAGE PROCESSING TECHNIQUES
FOR DETECTION AND QUANTIFICATION
OF DRUSEN
Dissertation presented to obtain the degree of Doctor of
Philosophy in Electrical Engineering, speciality on
Perceptional Systems, by the Universidade Nova de Lisboa,
Faculty of Sciences and Technology.
LISBOA
Acknowledgements
Being the development and writing of this PhD thesis an individual work, due to its complexity and extension, there were people that contributed with new ideas, discussions and motivation, which were very helpful to get this work done. Therefore, I would like to start by thanking all my friends, colleagues, students and researchers that in some way helped me during this work.
First of all, I would like to thank my PhD advisors José Manuel Ribeiro da Fonseca and Pedro Miguel Vieira, for accepting me as their PhD student, for their support, for the enriching discussions, for the motivation, especially when new challenging solutions had to be developed, for always believing in the quality of the work that was done, and for their unconditional friendship.
To José Fonseca, I also have to thank for his sacrifices workwise during my PhD licence, and again it was very enriching to work with him due to his geniality and experience.
To Pedro Vieira I would like to thank him for introducing me to this research topic and by confiding in me the task to successfully complete this work, and the liaisons with multi-disciplinary teams that have enabled me to have a medical and a technical view of the issue.
To Professor Adolfo Steiger Garção in representation of the Electrical Engineering Department and the Uninova – Centre for Technology and Systems, for giving me the conditions to carry on with this work and for his personal support during the this PhD.
A special thanks to Fundação para a Ciência e Tecnologia for awarding me a PhD
To my friend Fernando Moitinho, who was also a young researcher financed by
Fundação para a Ciência e Tecnologia, I would like to leave a special thanks for the
contributions to this work, in particular on the design and implementation of modelling and sectioning algorithms, for choosing me as the advisor in his diploma project, by the
professionalism that he puts on every task since the beginning of our professional journey together, and for his friendship.
There are also people from five institutions that were very important to the success of this work, to whom I would like to express my gratitude, and to the institutions they represent. To Ayyakkannu Manivannan from University of Aberdeen, for all his collaboration during
this work, who introduced to us the problem of drusen automatic detection, supplied retinal images, and who revised some of the articles. To Prof. Monteiro Grillo, MD Carlos Neves, MD David Lopes, MD Ana Ferreira, MD Ana Fonseca from Hospital de Santa Maria, for
supplying retinal images, for the commitment in analysing the supplied images, and for the partnerships in other projects related to ophthalmologic image analysis. To Clínica ALM – Oftalmolaser, in particular to MD Sérgio Ribeiro for analysing several images even during his
free-time. To Prof. João Goyri O’Neill from Faculdade de Ciências Médicas, for the
partnership in the DRUSAS project and for their participation on the evaluation studies by
analysing retinal images. To MD Simon Brunner from Rudolf Foundation Hospital, Austria a
special thanks for supplying several image datasets used in this work, for contributing with feedback and requisites to the development of the software applications, for using the developed software in his research activities, and for the joint publication.
A special thank you to Ana Maria by her encouragements and support, and by revising this dissertation, which also helped me to improve my writing in English.
To my family and all the friends who are still there after this last year of social hibernation, I promise to be more present and again share great moments with them. Thank you for the support and encouraging from the beginning until the end of this work.
To my father Zé Manel and in memory of my mother Tatão, I profoundly thank them for the education, the advices, the guidance they gave me, which was fundamental to reach this academic stage, and for my father’s comprehension towards my absence.
Abstract
Drusen are common features in the ageing macula, caused by accumulation of extra-cellular materials beneath the retinal surface, visible in retinal fundus images as yellow spots. In the ophthalmologists’ opinion, the evaluation of the total drusen area, in a sequence of images taken during a treatment, will help to understand the disease progression and effectiveness. However, this evaluation is fastidious and difficult to reproduce when performed manually.
A literature review on automated drusen detection showed that the works already published were limited to techniques of either adaptive or global thresholds which showed a tendency to produce a significant number of false positives. The purpose for this work was to propose an alternative method to automatically quantify drusen using advanced digital image processing techniques.
This methodology is based on a detection and modelling algorithm to automatically quantify drusen. It includes an image pre-processing step to correct the uneven illumination by using smoothing splines fitting and to normalize the contrast. To quantify drusen a detection and modelling algorithm is adopted. The detection uses a new gradient based segmentation algorithm that isolates drusen and provides basic drusen characterization to the modelling stage. These are then fitted by Gaussian functions, to produce a model of the image, which is used to compute the affected areas.
Four studies to assess the methodology accuracy involving twelve specialists have taken place. These compared the automated method to the specialists and evaluated its repeatability. The studies were analysed regarding several indicators, which were based on the total affected area and on a pixel-to-pixel analysis. Due to the high variability among the graders involved in the first study, a new evaluation method, the Weighed Matching Analysis, was developed to improve the pixel-to-pixel analysis by using the statistical significance of the observations to differentiate positive and negative pixels.
Abbreviations and Notations
AD3RI - Automated Drusen Deposits Detection on Retinal Images ARMD - Age-Related Macular Degeneration
CV - Coefficient of Variation FFT - Fast Fourier Transform FIFO - First In First Out GAs - Genetic Algorithms
GGD - Generalized Gaussian Distribution GPL - Gradient Path Labelling
ICC - Intra-Class Correlation Coefficient IHS - Intensity Hue Saturation
MD3RI - Manual Drusen Deposits Detection on Retinal Images ODD - Optic Disc Diameters
RGB - Red Green Blue
RIM - Regional Intensity Maximum RMS - Root Mean Square
ROC - Receiver Operating Characteristic ROI - Region Of Interest
RPE - Retinal Pigment Epithelium SAE - Sum Absolute Error
SLO - Scanning Laser Ophthalmoscope SP - Specificity
Table of Contents
ACKNOWLEDGEMENTS ... I
ABSTRACT... III
ABBREVIATIONS AND NOTATIONS... V
TABLE OF CONTENTS... VII
LIST OF TABLES...XI
LIST OF FIGURES ...XIII
CHAPTER 1 - INTRODUCTION ... 1
1.1-THE HUMAN VISION...2
1.2-INTRODUCTION TO RETINAL DISEASES...5
1.2.1. Diabetic Retinopathy ...5
1.2.2. Ocular Tumour ...6
1.2.3. Age-Related Macular Degeneration...7
1.2.4. Drusen as a risk factor for ARMD...11
1.3-DIAGNOSIS,FOLLOW-UP AND TREATMENT...12
1.3.1. Amsler Grid ...12
1.3.2. Imaging equipments...13
1.3.3. Treatments ...23
1.4-THE USE OF IMAGE PROCESSING TECHNIQUES FOR DRUSEN QUANTIFICATION...24
1.5-WHAT IS PROPOSED IN THIS THESIS?...25
CHAPTER 2 - LITERATURE REVIEW... 27
2.1-DRUSEN DETECTION... 28
2.1.1. Manual methods... 28
2.1.2. Automatic detection Methods... 32
2.1.3. Considerations ... 39
2.2-RETINAL IMAGE PRE-PROCESSING... 40
2.2.1. Image contrast enhancement ... 40
2.2.2. Non-uniform illumination compensation ... 44
2.3-SUMMARY... 48
CHAPTER 3 - THE METHODS OF DETECTION ... 51
3.1-THE METHODOLOGY... 52
3.2-IMAGE PRE-PROCESSING... 54
3.2.1. Region of interest definition... 56
3.2.2. Colour channel selection ... 58
3.2.3. Non-Uniform Illumination Compensation ... 59
3.2.4. Contrast Normalization ... 74
3.3-DRUSEN DETECTION... 76
3.3.1. Regional Intensity Maximums Detection Algorithms ... 77
3.3.2. The Watershed Transform ... 78
3.3.3. Gradient Path Labelling ... 85
3.3.4. Considerations ... 94
3.4-DRUSEN MODELLING... 101
3.4.1. Function Model... 102
3.4.2. Modelling technique ... 105
3.4.3. Modelling Performance Optimization ... 113
3.4.4. Considerations ... 116
3.5-DRUSEN QUANTIFICATION... 118
3.5.1. Area calculation... 118
3.5.2. Integral estimation... 120
3.5.3. Number of Drusen... 120
3.6-SUMMARY... 121
CHAPTER 4 - THE METHODS OF VALIDATION ... 123
4.1-MANUAL DRUSEN DEPOSITS DETECTION IN RETINAL IMAGES... 125
4.2-AUTOMATIC DRUSEN DEPOSITS DETECTION IN RETINAL IMAGES... 130
CHAPTER 5 - RESULTS EVALUATION... 139
5.1-MATERIALS &METHODS...140
5.1.1. Images Datasets...140
5.1.2. Methods ...142
5.2-STUDIES...147
5.2.1. Study I – TRIAL I...147
5.2.2. Study II – TRIAL II ...160
5.2.3. Study III – REP I...166
5.2.4. Study III – REP II ...171
5.3-SUMMARY...176
CHAPTER 6 - CONCLUSIONS ... 179
CHAPTER 7 - FUTURE WORK ... 183
ANNEX A -GENERALIZED GAUSSIAN FUNCTION ... 185
ANNEX B –IMAGE GRADING PROTOCOL... 187
ANNEX C –LIST OF PUBLICATIONS ... 190
List of Tables
Table 2.1 – List of selected epidemiologic studies where drusen was evaluated on the
last twenty years. ...29
Table 3.1 – The Watershed Transform compared to the GPL algorithm. ...95
Table 3.2 – Performance of the fitting algorithm. ...114
List of Figures
Figure 1.1 – Cross-sectional view of a human eye. ...2
Figure 1.2 – Light propagation in the retina...3
Figure 1.3 – Retina Layers distribution...4
Figure 1.4 - Global causes of blindness due to eye diseases and uncorrected refractive errors estimated in 2006. ...5
Figure 1.5 – A retina affected by Diabetic Retinopathy...6
Figure 1.6 – Examples of retinas showing signs of Ocular Tumours...7
Figure 1.7 – Visual perception from a patient with ARMD...9
Figure 1.8 –Examples of: retinal abnormalities...10
Figure 1.9 – The appearance of drusen between the Bruch’s membrane and the RPE...11
Figure 1.10 – Retinal images containing hard drusen and soft drusen...12
Figure 1.11 – Amsler Grid...13
Figure 1.12 – Direct Ophthalmoscopes. ...14
Figure 1.13 – Fundus camera diagram. ...15
Figure 1.14 –Fundus camera examples. ...16
Figure 1.15 – Fluorescein (A) and Indocyanine (B) angiograms comparison...17
Figure 1.16 – Retinal illumination diagrams. (a) fundus camera (b) SLO...18
Figure 1.17 – An optical diagram of the SLO. ...18
Figure 1.18 – Diagram for an SLO...19
Figure 1.19 – Retina images containing drusen taken with SLO. ...20
Figure 1.20 – Monochromatic retinal images obtained with different laser beams. ...20
Figure 1.21 – Cross-sectional OCT images from a retina showing drusen...22
Figure 1.23 – Volumetric OCT images from a normal retina showing the fovea
depression... 23
Figure 2.1 – Distribution of the number of patients in the selected studies... 30
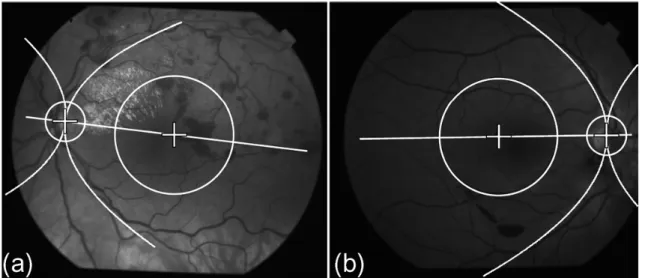
Figure 2.2 –Wisconsin grid and standard circles ... 30
Figure 2.3 – Manual drawing over printed fundus photographs... 31
Figure 2.4 – Retinal images decomposition in RGB channels. ... 40
Figure 2.5 – Retinal images decomposition in IHS channels. ... 41
Figure 2.6 – Colour normalization on retinal images. ... 42
Figure 2.7 – Histogram Specification for colour normalization. ... 43
Figure 2.8 – Morphological transformation... 44
Figure 2.9 – Retina image with non-uniform illumination. ... 45
Figure 2.10 – Correction of the non-uniformity of the illumination using Gaussian convolution... 46
Figure 2.11 – Homomorphing filtering... 47
Figure 3.1 – Methodology for automatic drusen detection and quantification... 53
Figure 3.2 – Examples of retinal images acquired with different conditions. ... 54
Figure 3.3 – Retinal images with analogue contrast Improvement... 55
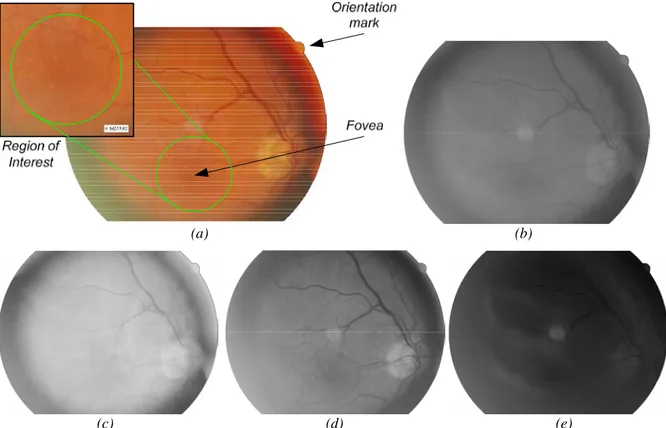
Figure 3.4 – Retina image description. ... 56
Figure 3.5 – Locating of the macula using the geometric configuration of blood vessels and optic disc. ... 57
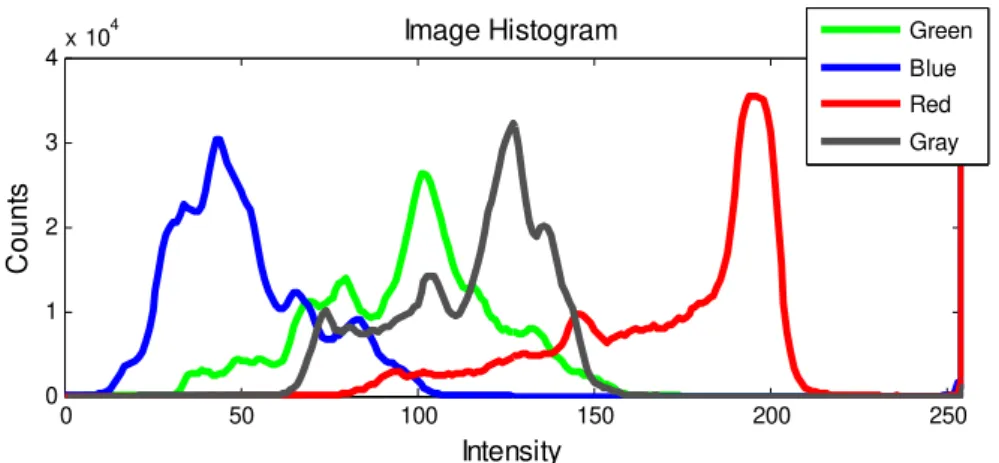
Figure 3.6 – RGB and Grey histograms of the retina image in figure 3.4.a. ... 58
Figure 3.7 – Red-free light illumination. ... 59
Figure 3.8 – Image processing in the Frequency domain. ... 60
Figure 3.9 – Filtering in the frequency domain using a Butterworth high-pass filter... 62
Figure 3.10 – Examples of the homomorphic filtering technique... 64
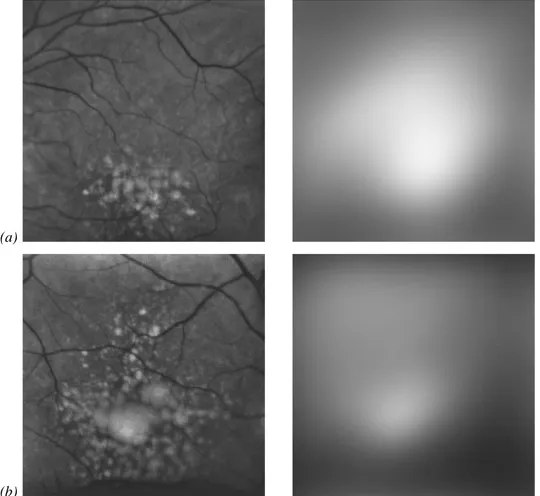
Figure 3.11 – Illumination compensation using Gaussian fitting. ... 65
Figure 3.12 – Examples of application of the Gaussian Blurring Algorithm.. ... 66
Figure 3.13 – Smoothing Spline Fitting examples for different p values. ... 67
Figure 3.14 – Smoothing Spline Fitting Algorithm with a single pass... 68
Figure 3.15 – Iterative Smoothing Spline Fitting over an image containing large confluent drusen... 70
Figure 3.16 – Iterative Smoothing Spline Fitting over an image with medium sized drusen... 71
Figure 3.18 – Morphology changes after illumination correction...72
Figure 3.19 - Parameters graphical representation (with weighs). ...73
Figure 3.20 – Overall ranking of the correction algorithms. ...74
Figure 3.21 – Examples of the normalization procedure and their sliding windows with standard deviations. ...75
Figure 3.22 – Images and their correspondent histograms before and after intensity and contrast normalization.. ...77
Figure 3.23 – Regional Intensity Maximums detection methods...78
Figure 3.24 – Laplacian filter mask...78
Figure 3.25 – Geographical Watersheds...79
Figure 3.26 – The Watershed Transform...79
Figure 3.27 – Lower complete image generation...81
Figure 3.28 – Lower complete diagram...82
Figure 3.29.- Watershed Transformed applied to retinal images. ...85
Figure 3.30 – Image gradient...86
Figure 3.31 – Horizontal and vertical filter masks for Prewitt and Sobel edge detection filters...87
Figure 3.32 – GPL Labelling procedure...88
Figure 3.33 – Example of the sequential label propagation procedure...88
Figure 3.34 – Gradient calculus on image boundaries. ...89
Figure 3.35 – GPL final labels image...89
Figure 3.36 – Over-segmentation provoked by plateaus. ...91
Figure 3.37 – GPL merging method...92
Figure 3.38 – Image segmented using the gradient path labelling. ...93
Figure 3.39 – Performance comparison between Watershed Transform and GPL. ...100
Figure 3.40 – Result of an edge detection filter applied to a retina region containing drusen and vessels. ...101
Figure 3.41 –Wavelet Transform applied to a retina image. ...101
Figure 3.42 – Drusen modelling (three dimensional views). ...103
Figure 3.43 – GGD function profile in reference to three -β- values. ...104
Figure 3.44 – Example of GGD functions parameters initialization...110
Figure 3.45 – Examples of drusen modelling viewed in three-dimensions...110
Figure 3.46 – Parameters progression for fitting image 1. ...111
Figure 3.48 – Initial stage of the sectioning method for three examples. ... 115
Figure 3.49 – Output from the image sectioning and from the modelling step. ... 116
Figure 3.50 – Output from the modelling step... 117
Figure 3.51 – Area calculation for different parameterizations. ... 119
Figure 3.52 – Drusen area calculation. ... 119
Figure 3.53 – Integral quantification procedure... 120
Figure 3.54 – Integral estimation process. ... 121
Figure 3.55 – Examples of drusen detection with more than one GGD per drusen. ... 121
Figure 4.1 – Gold Standard images preparation. ... 124
Figure 4.2 – Example of one image marked by hand and by computer. ... 124
Figure 4.3 – Example Screenshot of MD3RI User Interface... 125
Figure 4.4 – Example of a calibration image. ... 126
Figure 4.5 – Image enhancement panel. ... 127
Figure 4.6 – MD3RI functional drawing procedure. ... 128
Figure 4.7 – Drawing mode configuration and area calculation... 128
Figure 4.8 – Drusen contour using MD3RI. ... 129
Figure 4.9 – Example of MD3RI semi-automatic contour drawing procedure. ... 129
Figure 4.10 – Algorithm of operation Crop to Centre.... 130
Figure 4.11 – Drusen quantification window. ... 131
Figure 4.12 – GPL and sectioning frontend... 131
Figure 4.13 – Output images from the Gradient Path Labelling... 132
Figure 4.14 – Panel for the drusen modelling... 133
Figure 4.15 – Modelling results panels... 133
Figure 4.16 – Modelling using the sectioning procedure... 134
Figure 4.17 – Quantification of drusen and marked Images... 135
Figure 4.18 –Drusen contours drawn with MD3RI. ... 137
Figure 5.1 – Wisconsin grading subfields (right eye)... 142
Figure 5.2 – Weighing matching analysis example. ... 146
Figure 5.3 – Examples of image #1 marked by the specialists, by the AD3RI and the image template for the weighed matching analysis. ... 148
Figure 5.4 – Examples of image #20 marked by the specialists, by the AD3RI and the image template for the weighed matching analysis. ... 149
Figure 5.6 – Variability analysis among the four trained graders for three repeated
markings of each image...151
Figure 5.7 – Graphical comparison of areas between AD3RI and the specialists...152
Figure 5.8 – Mean area variability...153
Figure 5.9 –Image #1 marked by specialists OP1 and OP3. ...153
Figure 5.10 – Mean ICC values for the dataset without outliers...154
Figure 5.11 –Mean Sensitivity and Specificity Analysis . ...155
Figure 5.12 – Kappa Coefficient analisys. ...156
Figure 5.13 –Mean Sensitivity and Specificity analysis. ...157
Figure 5.14 – Mean Kappa Coefficient analysis. ...158
Figure 5.15 – Graphical comparison of areas between AD3RI and the specialists...161
Figure 5.16 – Mean area variability...162
Figure 5.17 – Mean ICC values for the dataset without outliers...163
Figure 5.18 – Analysis of mean Sensitivity and Specificity...164
Figure 5.19 – Mean Kappa Coefficient analysis. ...165
Figure 5.20 – Examples of repeated images and their correspondent analysis. ...167
Figure 5.21 – Graphical comparison of areas between the analysis 1 and 2 and total areas details for each image...167
Figure 5.22 – Mean area variability...168
Figure 5.23 – Mean ICC values...168
Figure 5.24 – Sensitivity and Specificity analysis...169
Figure 5.25 – Kappa Coefficient analysis. ...169
Figure 5.26 – Examples of repeated images and their correspondent analysis. ...172
Figure 5.27 – Graphical comparison of areas between the analysis 1 and 2 and total area details for each image. ...173
Figure 5.28 – Mean area variability...173
Figure 5.29 – Means ICC values. ...174
Figure 5.30 – Sensitivity and Specificity analysis...174
Chapter 1
-Introduction
The development of medicine in order to provide longer and better quality of life is probably one of the oldest interests of Man. For a long time has He induced and motivated the development of new treatment and diagnostic techniques aside with the development of new technologies introduced to new equipments, new materials and new computer-aided tools. This has also been the case for Ophthalmology, which has taken care of one of the most important of human senses, the vision, in which new diagnostic equipments, new drugs and others techniques have been constantly developed.
This medical speciality is mainly focused on keeping the human vision functioning correctly; however, the research has shown that the eye and, in particular the retina, is like a mirror showing early signs of many other hidden diseases, like diabetes, hypertension and others, making it even more important for screening purposes. The analysis of the retina is then able to identify several diseases which in some cases don’t provoke vision disorders but are early signs of other pathologies.
process reproducibility and provide quantitative data to the Ophthalmologist, enabling him to focus his attention on the diagnosis.
This work has dedicated especial focus on ARMD and in particular on drusen which are one of its early signs. These are yellow spots which appear in the retina surfaceand can vary in size depending on their type and disease evolution. For the ophthalmologists the quantitative evaluation of the total area affected by this disease in a sequence of images taken during a long term treatment will positively help on assessing its effectiveness. Currently, to assess it, they need to manually mark drusen in the retinal images and quantify these areas. This is a procedure that requires attention, precision and time from the ophthalmologists, which is incompatible with their daily interventions. The subjectivity of the criterion to detect drusen also affects the reproducibility of the technique and increases the variability among ophthalmologists analysis.
This thesis proposes a methodology which is able to automatically process retinal images and quantify the area affected by drusen, using digital image processing techniques. The complexity of these images along with the low contrast and non-uniform illumination make the development of these techniques a difficult task. The work is a contribution to both medicine and engineering fields, in the sense that the tools developed will certainly improve the clinicians’ work by freeing them from the manual markings and the engineering field which will benefit from the developments of new image processing algorithms, as well as a case-study for other biomedical applications of image processing.
The next subsections will introduce the reader to the anatomy of the human visual system, to the pathologies which are related to the retina and to the diagnosis and treatment of ARMD.
1.1 -
The human vision
Of the five human senses, the eye is one of its most important sense organs by the
quality and precision of the signals it captures and by the reduction of quality of life within its absence. It was estimated that 70% of the sensorial information interpreted by humans is captured by the eye (Davidovits 2001). It has the ability to capture the light and convert it in the retina into electric signals that are sent to human brain for interpretation. Its functioning is similar to conventional image capture systems due to its lenses that refract and focus the incoming light in the sensorial region.
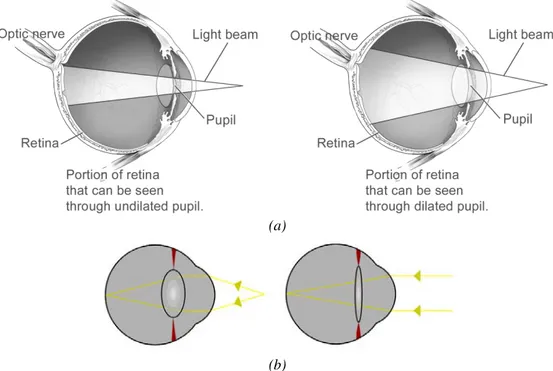
The optical system (figure 1.1) is composed by the lens, the iris and the cornea. As a result of the incoming light and in order to refract and focus, the lens reshapes with the help of auxiliary muscles. The control of the amount of light that enters the eye through the pupil is done by the iris, which is a tissue that is able to contract and expand, by decreasing or increasing the size of the pupil, respectively (figure 1.2.a). The cornea is a transparent and protective layer that covers the iris and the pupil and is the first refracting layer. With approximately 43 dioptres of refractive power the human cornea is the major focusing element of the eye, although it is fixed. The variable focus is obtained by the lens which in a natural environment has approximately 18 dioptres of refractive power (figure 1.2.b).
The light that enters the eye is projected into the retina, which contains the photoreceptors. There are different types of photoreceptors, some are for low-light vision and black-white perception (rods) and others are for colour perception and daytime vision (cones). Although these are dispersed along the retina, which occupies 72% of a sphere with 22mm of
(a)
(b)
diameter, they are more concentrated on the central part of the retina, the macula. This latter is about 6000µm of diameter and contains a high density of photoreceptors. The photoreceptors that are outside the macula capture the peripheral vision, which in case of damage is less noticed or even unnoticed than in the macula. In the centre of the macula with 1000µm of diameter is the fovea. It contains 50% of the photoreceptors of the retina being responsible for the sharp and high resolution central vision used by humans for reading, watching television, driving, and any other activity where visual detail is of primary importance.
The retina is divided into layers from the nerve fibre layer to the Bruch’s Membrane. The light that reaches the retina crosses the nerve fibre and the ganglions’ layers to be captured by the photoreceptors (rods and cones). These return the light information to the ganglions which gather and compress the information from several neighbouring photoreceptors and send it through the nerve to the brain. The Retinal Pigmented Epithelium (RPE) is a layer of cells that protects and nourishes the retina, removes waste products, prevents new blood vessel growth into the retinal layer and absorbs light not absorbed by the photoreceptor cells; these actions prevent the scattering of the light and enhance vision clarity. Finally, the Bruch’s Membrane is a thin layer that acts as a blood-retinal barrier and as a support to both RPE and Choroid.
The information collected by the retina is gathered into a set of nerve fibres which are forwarded to the brain through the optic nerve. This latter includes also the veins and arteries which supply the blood to the eye. The optic disc is located within the retina and does not have photoreceptors which create a blind spot in the visual field.
1.2 -
Introduction to Retinal Diseases
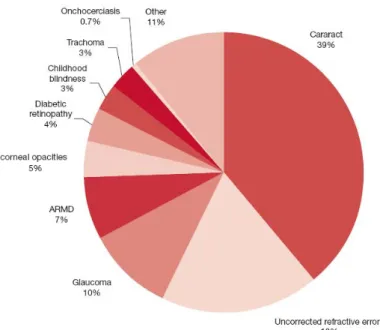
Blindness is one of the most undesirable consequences of any eye disease. According to the World Health Organization (2007) the major causes of blindness that occur nowadays worldwide are the opacity of the lens provoked by Cataracts, Glaucoma which affects the optic nerve and involves the loss of ganglions, and Retinopathies that affect the retina, such as ARMD and Diabetic Retinopathy by distorting the image, or in an advanced stage, with the loss of photoreceptors (figure 1.4).
In this work only a particular retinopathy is approached, the ARMD. However, in order to contextualize the reader an overview on other retinopathies which can have confounding characteristics such as the Diabetic Retinopathy and the Ocular Melanoma will be presented in the following sections.
1.2.1.Diabetic Retinopathy
A patient with Diabetes may experience several ocular complications, such as Cataracts, Glaucoma and Diabetic Retinopathy, which can lead to irreversible blindness. This latter is the most common within the patients with diabetes and is one of the leading causes of American Adults blindness (Prevent Blindness America 2008). It is caused by changes in the blood vessels of the retina that can lead to haemorrhages, blurring the vision. These changes can be new vessels that grow on the surface of the retina or vessels that swell and start bleeding.
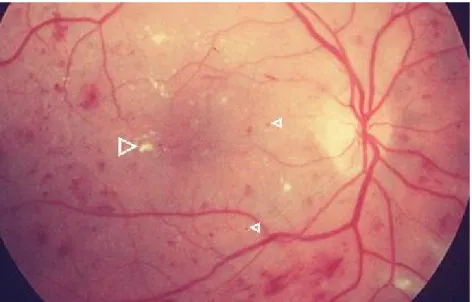
This disease often has no early signs. Only after small haemorrhages do the patients feel their vision blurred. Firstly this sensation can be temporary. However, after some days or weeks, a severe bleeding is likely to occur and damage the retina irreversibly. In a funduscopic examination of a retina affected by Diabetic Retinopathy, the ophthalmologist may find cotton wool spots and haemorrhages (figure 1.5). The cotton wool spots are regions where the blood supply has been obstructed, exhibiting a white reflection in a distorted region as a consequence. The haemorrhages are the darker spots which exhibit an irregular shape, as illustrated in figure 1.5.
1.2.2.Ocular Tumour
Ocular Tumour is a rare disease which can appear either in the iris or in the Ciliary Body or in the choroid. According to Liverpool Ocular Oncology Centre (2005), within the various types of tumours the most commons are Uveal Melanoma, Naevi and tumours metastasis. Those affecting the retina are the ones which grow in the Choroid. Most of these tumours remain unnoticed until they are detected in a routine retinal examination. However, in an advanced stage they affect the patient’s vision, leading in many cases to irreversible blindness and ultimately become fatal.
The Uveal Melanoma is a malignant tumour that develops in the three eye structure specified above. Its consequences are a visual field deficit, pain and eventually the loss of vision. It is also common to develop metastasis which can be fatal to the patient. Most patients with Choroidal Melanoma have no symptoms at all, only detected in a routine fundus examination appearing with a different pigmentation (figure 1.6.a).
Naevi tumours are benign tumours which present no health risks unless they develop into malignant tumours which are then classified as Melanomas. They are from the same class as the skin mole, being characterized in fundus images by a darker region (figure 1.6.b). This coloration is due to a high concentration of the pigmenting agent, melanin. The patients usually do not have symptoms, being also only detected on a retinal examination.
Other class of ocular tumours are the metastasis of other malignant tumours, which can develop in the eye growing rapidly and leaking large amounts of fluid which cause progressive loss of vision. They usually appear as large sized spots in yellow or white colour, as it is show in figure 1.6.c.
1.2.3.Age-Related Macular Degeneration
The ARMD is the most common cause for irreversible blindness in the developed countries (Friedman, O'Colmain et al. 2004; AMD Alliance International 2006; Cook, Patel et al. 2008). According to the World Health Organization it is the third cause of irreversible
(a) (b)
(c)
blindness. It is a disease that causes progressive damage to the macula, leading to a distorted vision and ultimately to a complete loss of central vision. Peripheral vision is usually retained in ARMD and therefore total blindness (inability to see all light) does not typically occur even in advanced macular degeneration.
As the name suggests ARMD is age related, common among people aged 55 years and older. Many epidemiologic studies were and are being carried out to evaluate the causes, the risk factors and its prevalence in some races, genders or parts of the globe (Vingerling, Hofman et al. 1996; Pagliarini, Moramarco et al. 1997; Curcio, Medeiros et al. 1998; Frank, Puklin et al. 2000; Oshima, Ishibashi et al. 2001; Jonasson, Arnarsson et al. 2003; Varma, Fraser-Bell et al. 2004; Augood, Vingerling et al. 2006; Wang, Rochtchina et al. 2007; Chen, Cheng et al. 2008; Xu, Li et al. 2008). One of the conclusions taken from these studies was the profile of the patients that have higher probability of developing ARMD, which is:
- Age - signs are present in about 14% of people aged between 55 and 64, 20% aged between 65 and 75 and up to 37% of people over 75 (Wang, Mitchell et al. 2007). - Gender - more common with women than with men. This partially may be
explained by the fact that women live longer than men (Klein, Klein et al. 2002; Wang, Mitchell et al. 2007).
- Race - more common in Caucasians than other races. This partially may be due to the pigment in the eye or eye colour. It may also have to do with differing diets and sun exposure (Schachat, Hyman et al. 1995; Frank, Puklin et al. 2000; Varma, Fraser-Bell et al. 2004).
- Eye Colour - more common with people with blue eyes. Although, there is no strong association, this may be related to damage associated with exposure to ultraviolet light (Frank, Puklin et al. 2000).
- Genetics – It was found that a genetic factor is associated with ARMD. If someone in the family contracted ARMD it is likely that some of their descendents may develop it also (Frank, Puklin et al. 2000; Smith, Assink et al. 2001; Haddad, Chen et al. 2006).
These studies found also risk factors which can be the genesis of ARMD. Most of these are due to people’s habits, which can be avoided to reduce the probability of developing ARMD. Some of the identified factors were:
- Cardiovascular problems – It was found a higher incidence of ARMD on people having hypertension (Tan, Mitchell et al. 2007; Cukras and Ferris 2008).
- Exposure to Sunlight – The long exposures to sunlight, especially to ultraviolets without protective sunglasses are related to a higher incidence of ARMD. The exposure to blue light has also been identified as an increase factor (Fletcher, Bentham et al. 2008).
- Dietary habits - The dietary habits may also influence negatively or positively the risk of ARMD. It was found that a fat dietary increases the risk, while a dietary based on fish reduces it (Seddon, George et al. 2006).
- Smoking – Smoking is being highly correlated with the presence of ARMD. It has been consistently confirmed in several studies that the risk is two to three times higher in smokers than non-smokers (Vingerling, Hofman et al. 1996; Delcourt, Diaz et al. 1998; Seddon, George et al. 2006).
- Drusen – These are small lipid deposits that appear in retina surface and can lead to ARMD. Alone they do not provoke macular degeneration, but contribute for its development (Pauleikhoff, Barondes et al. 1990).
The patient’s symptoms are a distorted vision and/or occlusions in the formed image, as exampled on figure 1.7. If untreated, these symptoms will increase progressively until a total occlusion. It is characterized by a detachment of the macula from the Choroid, which contributes to a deficient nutrition of the macular cells causing their death progressively. This detachment can be originated from one of two forms of ARMD: wet or dry.
The wet form is less common but more severe and is caused by choroidal
neovascularisation, i.e., the development of abnormal vessels beneath the RPE layer. These can provoke macular detachment and bleed causing profound loss of vision. It usually appears in fundus images as darker regions due to the bleeding (figure 1.8 (a,b)).
The dry form is characterized by the presence of drusen which can degenerate and grow provoking a gradually distorted vision and occlusions. When they appear outside the macula, in the peripheral vision, the brain compensates the failures with the neighbours’ photoreceptors not being noticed by the patient. Its last stage is the Geographic Atrophy which is identified as a yellow and brighter region with a size larger than 175µm with sharp edges (figure 1.8(c,d)). The first stage where the drusen are visible, which is the core of this work, will be deeper explained in the next section.
(a) (b)
(c) (d)
Figure 1.8 –Examples of: retinal abnormalities. (a,b) Choroidal Neovascularisation. On the right-side image there is a mixture between neovascularisation and drusen; (c,d) Geographic Atrophy.
1.2.4.Drusen as a risk factor for ARMD
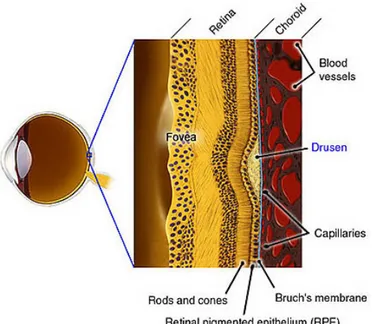
The drusen are deposits of extracellular materials in retina between the RPE and the Bruch’s membrane (figure 1.9) and they are considered a strong risk factor for ARMD (Pauleikhoff, Barondes et al. 1990; Hageman, Luthert et al. 2001). They have also been related to the appearance of retinal detachments, which provokes loss of vision (Hartnett, Weiter et al. 1992; Bonanomi, Maia et al. 2006). By separating the two retinal layers the drusen will make it difficult to transfer the nutrition and oxygen from the Choroid to the RPE which potentially leads to the degeneration of some photoreceptor regions (Johnson, Lewis et al. 2003).
Drusen deposits can appear scattered or concentrated, depending on the stage of ARMD. In the early stages the accumulation and size of drusen is usually small. In these cases as the human brain compensates the small size abnormalities, the patient feels little or no impact on his vision. However, when it degenerates in ARMD, the drusen deposits grow in accumulation and size developing symptoms such as blurred vision. The patients will generally require more light and will often indicate a loss of vision that is more pronounced in the centre of the eye.
Drusen appear in fundus images as yellowish spots in or around the macula. Clinically, they can be divided in two types: the hard drusen and the soft drusen (Bird, Bressler et al. 1995). Hard drusen (figure 1.10.a) are mainly characterized by small sized
spots with less then 63µm of diameter and sharp edges, while soft drusen (figure 1.10.b) are medium sized spots between 63µm and 250µm of diameter with smooth edges, which can be confluent with irregular shapes. They also provoke elevations on the retina surface, as consequence of the accumulation of deposits beneath the retina.
The detection of drusen in early stages and the control of its progression is therefore important to reduce the risk of degeneration and consequently the development of ARMD. There are several possible treatments and diagnosis techniques which will be presented next.
1.3 -
Diagnosis, Follow-up and Treatment
Many of the pathologies that affect the retina can be visible in retina surface, hidden in a deeper layer or appear in other invisible forms. Thus, some of these pathologies require different complementary diagnostic exams to correlate information between them and produce a reliable and well supported diagnosis. In this work it is analysed the most common diagnostic techniques for drusen detection, which are the Amsler Grid and retinal imaging. The biogenesis, causes or effects are not analysed, although its main goal is to study the progression of the drusen and evaluate the treatment efficiency.
Further on it will be presented an overview of the Amsler Grid and the imaging techniques used in retinal diagnosis which can be used to detect and evaluate drusen. As contextual information for the reader the available drusen treatments will also be presented.
1.3.1.Amsler Grid
A simple method for early detection of ophthalmologic abnormalities is a self-test to detect changes in the visual perception of the surrounding environment. With a monocular
(a) (b)
inspection of straight lines, such as, door frames, lines of text, buildings edges and others, visual acuity changes can be detected if these lines present signs of distortion. This is called environmental Amsler (Fine, Elman et al. 1986; Amsler Grid 2010), in relation to the Amsler Grid, which is also a visual acuity exam.
The Amsler Grid (figure 1.11.a), a grid of horizontal and vertical lines with a small dot at the centre, was developed in 1945 by Marc Amsler (a Swiss Ophthalmologist) and is a non-invasive and low-cost diagnostic tool to analyze visual disturbances caused by changes in the retina. A patient with macular disease may see wavy lines and some lines may be missing, as showed in figure 1.11 (b,c).
The test begins when the ophthalmologist asks the patient to look at the grid, centred on the small dot, at a predefined distance (14 in.), with an eye at a time, followed by the description of the image they are seeing. If they see distorted lines or missing ones, these are probably signs of ARMD. However, it is not very accurate, being required further diagnostic techniques.
1.3.2.Imaging equipments
For the retina examination there are retinography equipments to capture images from its surface, for tomography and topography analysis. The first retinal in-vivo examinations were made in 1851 with the invention of the ophthalmoscope by Hermann Von Helmholtz. Since then with optics and fast electronics developments the current equipments can capture and store on computer high-quality retinal images without the need of pupil dilation as it was before. These equipments can capture images from the retina surface layers and deeper layers, giving ophthalmologists important information which is used to elaborate patient diagnosis.
In the following subsections it will be presented the available techniques to study the retina. The mean of some of them is beyond the scope of this work which is to apply image
(a) (b) (c)
processing algorithms to images captured from the retina’s surface. However, they will be presented as a contextual perspective.
1.3.2.1 Direct Ophthalmoscope
The first equipment used for retinal examination, which is still widely used, is the ophthalmoscope. It was originally invented by Charles Babbage in 1847, although Hermann Von Helmholtz in 1851 reinvented it to what it is nowadays (Helmholtz 1851). Helmholtz showed that when light is transmitted into the pupil it is reflected in the retina and follows the same path when entering the pupil but in opposite direction, and he developed a prototype in which he could see the retina surface.
The ophthalmoscopes are handheld equipments that illuminate the retina, used by observers that place themselves in the light path, between the retina and the lamp to view the light reflected on the retina’s surface (see figure 1.12 (a,b)). To accomplish this process, a set of condensing lens conduct the light into the pupil with a semi-transparent mirror. The mirror reflects the light from the lamp into the pupil being semi-transparent in order to enable the observer to see the reflected light from the retina. Besides their conducting objective, they are also used to correct the refracting errors of the patient or the observer and to magnify the image.
This equipment is used for routine examinations, because it is practical and portable, being a very important instrument for early detection of retinal abnormalities. However, the devices that can capture the image for further processing in the computer are not so practical and are less common.
1.3.2.2 Indirect Ophthalmoscope - Fundus cameras
The fundus is the interior surface of the eye on the other side of the lens. It contains the retina, the optic nerve and the macula, and can be observed through the lens. A fundus
(a) (b)
camera or retinal camera is similar to an ophthalmoscope which is able to view the fundus and record this observation either on analogue or digital media.
The optical principle is similar to the ophthalmoscope (figure 1.13) although the observation light (6) is focused on the pupil through a series of lenses and apertures to form an annulus light (7). The reflected light (5) follows a different path passing through the centre of the annulus. Since the light paths of the two lights are independent, there are minimal reflections of the light source captured in the formed image. It has two different light sources to illuminate the retina, one with less intensity used for the alignment (6) and another with a flash light (8) to capture the image. When the observer presses the capture button the mirror in front of the camera (2) is lifted, the flash light (8) is fired and the image is captured (3).
The camera can be analogue or digital. Most retinograph setups are connected to a monitor and professional printer; only the recent ones have a digital output and are directly connected to a computer. The normal procedure is to digitalize the 35mm slide or, in some cameras with analogue output, to capture these same images using an image acquisition board.
There are two distinct versions for these retinal cameras. Those that require pupil dilation, which are the mydriatic retinal cameras (see figure 1.14.a), and those that don’t, the non-mydriatic cameras (see figure 1.14.b). When the eye is being illuminated for alignment
the pupil contracts decreasing the field of view and limiting the amount of light that can illuminate the retina. This is the reason why the pupil must be dilated during the image capture for the mydriatic retinograph. The non-mydriatic retinograph uses infrared light to
illuminate the retina during the image alignment, similar to darkness, which stimulates natural
pupil dilation. Notice in the figure 1.14 that the mydriatic uses optical viewer as the non-mydriatic uses a LCD to display the retina illuminated by infrared light. However, some
studies (Lim, LaBree et al. 2000) revealed that the non-mydriatic retinographs have a low
sensitivity rate and a high specificity rate, being clinically less useful than standard dilated 35-mm fundus slide images.
These retinographs are equipped with light filters to obtain images with different characteristics. One of such is the red-free filter that is used to obtain higher contrasted images, by enhancing the visibility of the retinal vasculature, haemorrhages, drusen and exudates. To obtain angiographies the filter is changed to a band-pass of blue light or infrared depending on the fluorescent dye used.
In angiography the patient receives an intravenous injection of a fluorescent dye which enhances the vessels contrast over the background. The method starts by illuminating the retina with a specific wavelength for the dye to fluoresce on another wavelength. Then, by filtering the illuminating wavelength, the fluorescent one passes producing thus very high-contrast image of vessels. The capture of a sequence of photographs of the progression of the dye into the vessels which reveals the flow dynamics and related pathologies is one of the main diagnostic exams. The two most common angiography methods use sodium fluorescein
dye, which emits a yellow-green light (wavelength = 530nm) when illuminated by a blue light
(wavelength = 490nm) or an Indocyanine green dye (ICG) which absorbs and emits light in
the near infrared spectrum (wavelength 805nm and 835nm, respectively). The ICG is a
method which captures an image of the choroid, which can be useful for some clinical purposes. In figure 1.15 it is shown some of the differences between these two dyes.
(a) (b)
According to Owens (1996) the physical properties of ICG make it potentially useful for the assessment of ARMD. However, the theoretical advantages are not verified in the practice. There were few studies referring drusen assessment in angiographs, one of such evaluated 37 patients (Scheider and Neuhauser 1992) where drusen were hypofluorescent 70% and hyperfluorescent only 22%. This showed that angiography images were not suitable for drusen detection.
1.3.2.3 Scanning Laser Ophthalmoscope
A Scanning Laser Ophthalmoscope (SLO) is a retinograph which uses a narrow beam of light from a laser to scan the retina in a raster fashion. The light reflected from the spot is
detected and synchronously decoded to form an image on a monitor. This process takes few milliseconds to complete a single image scan that avoids image blurring due to eye movements. This is a low power laser to avoid damaging the retina (Sharp and Manivannan 1997).
To illuminate the retina, the SLO uses a different approach than the fundus cameras. Since the reflected light is less powered than the illumination, this technique maximizes the capturing area using a small aperture in the central part of the pupil for the laser beam and uses the remaining area to collect the reflected light (figure 1.16). With this technique the efficiency is improved, allowing a low powered light to be used.
The functioning is similar to the previous ophthalmoscopes where the key-point is to transport the light one way and the reflected light the other way, through the same path
(a) (b)
Figure 1.16 – Retinal illumination diagrams. (a) fundus camera (b) SLO. (from (Sharp and Manivannan 1997))
without interferences. Here the illumination is easier to mask, since its diameter is narrower. The diagram (figure 1.17) presents a generic schema for SLO equipments.
The equipment’s purpose is to focus the laser on the retina, by passing it through the lens (L1) and the mirror aperture (M1), which is responsible for separating the illumination
from the reflected light. The laser is then deflected horizontally and vertically using an optical system (M2, M3 and M4) to scan the retina surface. The reflected light follows the same path
back to the equipment and is forwarded by the mirror (M1) to the focusing lens (L2) and then
to the photo-detector before crossing the confocal aperture.
The SLO can be used on one of three possible modes: direct or non-confocal, confocal
and indirect, depending on the size and position of the confocal aperture. In the direct mode
the confocal aperture is larger when compared to the laser beam width (figure 1.18.a). In this mode the scattered light that is reflected from the retina is also captured by the photo-detector. The resulting images have a high overall brightness as the light reflected from all retina layers is captured.
In the confocal mode (figure 1.18.b) the aperture size is reduced in order to filter only
the direct reflected light. By adjusting the distance between the confocal aperture and the photo-detector it is possible to focus the receptor to one of the retina layers (figure 1.18.d and
figure 1.19.a). This enables topographic imaging to be performed.
Finally, the indirect mode (figure 1.18.c) uses a large confocal aperture with a central
(a) (b)
Confocal Layer Confocal beams
(c) (d)
stop to cut the direct reflected beams and capture only the scattered ones. This method has been found to be useful in taking drusen images (Manivannan, Sharp et al. 1993) as illustrated in figure 1.19.b.
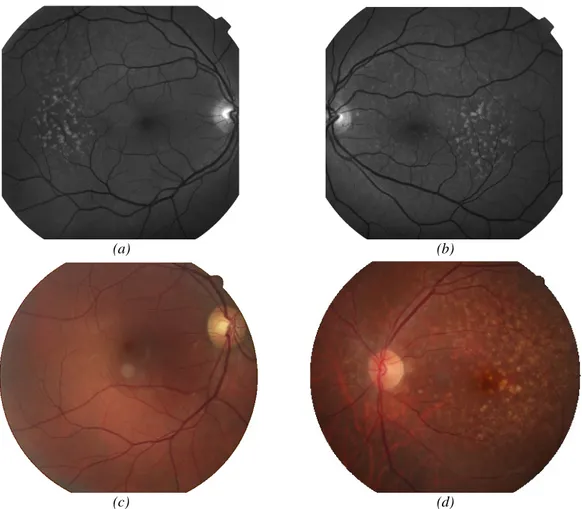
One of the limitations of these techniques is that the image is illuminated with a single colour, producing monochromatic images. To overcome this issue, some authors (Manivannan, Kirkpatrick et al. 1998; Vieira, Manivannan et al. 2002) have improved the conventional SLO to produce true colour images of the fundus. Their method endorsed a retina illumination with a three laser colour (blue, green, red) sequence and combined them to
(a) (b)
Figure 1.19 – Retina images containing drusen taken with SLO. (a) confocal mode; (b) indirect mode. (from (Aberdeen-Biomedical-Imaging-Centre 2009))
produce one true colour image (RGB). The image characteristics are slightly different from fundus retinographs, but with the advantage to photograph deeper layers of the retina. In figure 1.20 (a,b,c) the three monochromatic images taken with blue (488nm), green (523 nm) and red (670 nm) lasers are presented, as is the combined colour image in figure 1.20.d.
1.3.2.4 Optical Coherence Tomography
The Optical Coherence Tomography (OCT) is a non-invasive imaging equipment which performs three-dimensional depth scans of the retina. The first in vivo two-dimensional
depth scan using OCT in ophthalmology was presented by Fercher (1990). In the following years it was further developed achieving micrometer resolution and cross-sectional imaging capabilities. It is able to capture images from a depth of 1 to 2 mm below the surface in the retina.
The OCT is based on interferometry1 techniques to analyze the reflection from the retina surface. Typically an infrared light source (800nm or 1.3µm), which provides a deeper penetration in the tissues with a low scattering, is used. In (Wang, Nelson et al. 2003) the relation between the resolution of OCT and the light source wavelength was studied. It was shown that to reduce the dispersion caused by the water in the tissue, a light source with a central wavelength of 1.0µm with less than 100nm width was adequate, achieving a 1.3µm longitudinal resolution.
The optical functioning principle for an OCT is a Michelson interferometer as shown in figure 1.22. This equipment analyses the interference between the light that was reflected from the retina and the identical reference light that travelled the same distance. The physics is that the light reflected by the retina is coherent, i.e. retains the optical phase that causes light rays to propagate in one or another direction, and produce an interference pattern with a coherent light travelling the same distance.
The scattered light will not produce interference and therefore will be filtered out. To produce this interference pattern, the light beam passes through a beam splitter dividing it into two directions: to the retina and to a reference mirror. The reflected beams from the retina and from the mirror are gathered in the same beam splitter, and captured by a detector. The interference pattern between the two beam lights that are in phase is their cross-correlation, as presented in figure 1.22 (Single reflection site).
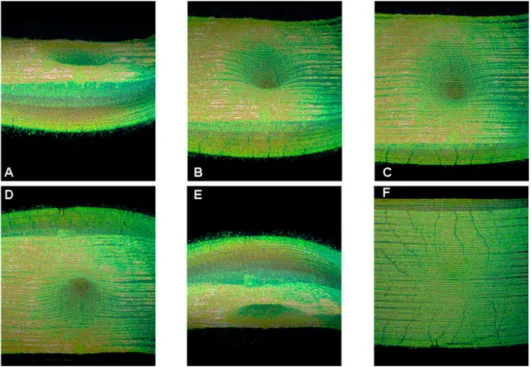
By computing the signal envelope and its amplitude, it is obtained a single point of an OCT image. If the distance of the reference mirror is changed, the depth of the reflecting layer is also changed accordingly. This movement produces the so called A-scan, which is a depth scan. By moving longitudinally the sample or the optical system or capturing the interference light with a line CCD, it is obtained a cross-sectional image, called B-scan or longitudinal scan (figure 1.21). Finally the full-field OCT, which is less common, is obtained by moving in both X and Y axis generating a volumetric image (figure 1.23). Although these images have a good diagnostic potential, their visualization and comprehension are difficult, and therefore trained personnel are required.
In figure 1.21 it is shown two fundus images containing drusen in parallel with a cross-sectional OCT image. In these pictures it is very clear the presence of drusen in the layer below the retina surface. Although this equipment is very important for an accurate evaluation of drusen, by achieving micrometric resolution using an analogue, non-invasive and safe technology, the fundus photography is still the most commonly used in the regular
Figure 1.21 – Cross-sectional OCT images from a retina showing drusen. (from (Khanifar, Koreishi et al. 2008))
retina examinations and on the epidemiologic studies for its wider availability.
1.3.3.Treatments
The ARMD treatments, developed so far and clinically used, are aimed to slow down drusen progression and to prevent the appearance of ARMD disease on people with high risk factors (Miller 2010). It is difficult to achieve a complete treatment, since it provokes changes in retinal structures which are not reversible. However, recent experimental studies show that damaged photoreceptors and the retinal pigment epithelium can be successively replaced using stem cells (Enzmann, Yolcu et al. 2009). Genetic studies on gene associations with ARMD (Donoso, Kim et al. 2006), which can identify the predisposal of some individuals to develop ARMD, will also play an important role as a new treatment option in the following decade.
For controlling the progression of wet ARMD (Choroidal Neovascularisation) there
are treatments using Laser Photocoagulation that destroys new blood vessels preventing leakage. However, it creates blind spots and cannot be used in the macula due to its destructive effect. Other alternatives are drug based, such as Verteporfin (Visudyne, Novartis), Pegaptanib (Macugen, Eyetech), Bevacizumab (Avastin, Genentech) or Ranibizumab (Lucentis, Genentech), which control the new vessels growth. These latter have
been showing good results by controlling the progression of ARMD in 90% of the patients and by having improved the patients’ vision in 70% of the cases.
The approved treatments of dry ARMD (drusen) include only drug-therapy. Although
there were some clinical trials involving a technique named as Rheopheresis, which is similar to blood filtration removing substances considered as vascular risk factors, it had no FDA-approval1. The clinical trials were concluded with a correlation of improvements of patient’s
vision, although further developments were abandoned due to financial reasons. The administration of nutritional supplements containing antioxidants and zinc, such as the AREDS formula, lutein, and zeaxanthin, are the current treatments used to stabilise the progression of drusen before advancing to the wet stage, which are obtaining good results. In the US a second large multi centre study conducted by the National Eye Institute (2009) was launched to assess the effect of these nutritional supplements, as a consequence of the success of the first edition.
1.4 -
The use of image processing techniques for drusen quantification
As it was shown in previous sections drusen are one of the risk factors for ARMD. As the disease has no effective treatment the only solution is to control its progression. This is one of the roles for the ophthalmologists which follow their patients with ARMD, so one can evaluate the progress of drusen. In order to perform an accurate assessment it is required to quantify the affected area and compare it along the treatments.
The quantification of drusen from fundus photographs using manual methods over fundus photographs is a choice for the ophthalmologists. The procedure is to manually draw drusen contours over fundus images and quantify the areas, but it is not commonly used as it is a fastidious process, and lacks reproducibility. Also, the variability within the analyses performed by different ophthalmologists limits the use of this technique, which will be further described in the next chapter.
There are few grading centres which are specialized in the characterization of drusen in fundus photographs using a semi-quantitative way. They classify it according to an international classification system (Bird, Bressler et al. 1995) which grades drusen in soft and hard categories and evaluates their number of occurrences. However, it is not feasible to send all the funduscopic examinations to these centres, due to delays and to the necessary logistic. As consequence, these centres are specialized on clinical trials and on epidemiological
studies. The common practice for the general ophthalmologist is to evaluate qualitatively the drusen progression and then act accordingly.
1.5 -
What is proposed in this thesis?
This thesis proposes the use of advanced digital image processing techniques to assess the drusen affected area from fundus images. This tool will certainly help the general ophthalmologists in the follow-up of their patients, by providing them a method, which is accurate and reproducible, to measure the progression of the drusen area. It should be noticed that any technique that is developed for this purpose should be open for the clinician to validate and eventually to make adjustments to the detection suggested by the computer.
The quality of the fundus images are many times poor being affected by the optical characteristics of the retinograph and by the lack of collaboration of the patient during the exam. A misalignment between the patient eye and the flash light or a contracted pupil can produce images with non-uniform illumination patterns which can complicate their automatic analysis.
The automatic quantification of drusen that is proposed herewith is adapted to be used with fundus photographs, the most common within the ophthalmic community. The main goal was to create a method which is less parametric as possible. Parameters should be calculated based on the image information, requiring less user intervention.
The methodology includes a pre-processing step for normalization of the image intensity and contrast in order to prepare the image for further processing. A new algorithm for detection of drusen based on the labelling of gradient paths was developed, providing the drusen location and size for a modelling stage. In this latter the drusen are modelled using mathematical functions, providing an analytical characterization. By using this model the affected area is finally quantified.
This methodology was also validated clinically with the collaboration of several ophthalmologists who marked the same image set as the automated method for comparison purposes. They marked the images in the computer using a semi-automated method developed specifically for the drusen quantification. Later these images were compared to the automated method using different statistical techniques.
1.6 -
Thesis structure
quantification will be described in chapter 3, being divided into five subsections. In these subsections it will be introduced the methodology steps, starting with the image pre-processing, followed by the drusen detection, drusen modelling and finally the drusen quantification methods.
Chapter 2
-Literature Review
The automatic detection of drusen has been object of research for almost three decades, where articles dated since 1986 can be found. The challenge is to develop methods using digital image processing that can consistently detect drusen on retinal images. These methods are not only used to detect the presence or absence of drusen, but also to determine their number, size and type. A good repeatability is also one of the pursued targets in order to maintain the same criteria among several analyses. The ability to study the drusen progression on series of images during a treatment without changing the detection criteria is very useful for ophthalmology specialists, who can accurately detect if the disease is stable or progressing.
The purpose of these researchers is to find a Gold Standard1 Technique for the quantification
of drusen. However, the subjectivity of the analysis and the need of complementary exams to support the analysis, turn it difficult to achieve a consensus among ophthalmologists of which technique is the most reliable. The areas of interest in the retina, the shape and size of drusen are some of the factors that differ among these specialists, mainly due to their different learning background (Bird, Bressler et al. 1995). The adjustments of the image slide projector or of the computer monitor and exterior light conditions are also some of the external factors that influences the detection criteria (Krupinski, Weinstein et al. 1996). These conditions should be maintained constant for every image being analysed, which is almost impossible to achieve.
1
Gold Standard - denotes a practice or principle that is a model of excellence and which objects of the same
Another aspect is that most cameras in the retinograph equipments, available in ophthalmologists’ practices, are still using analogue acquisition. Some are used to capture to photographic slides and others analogue video which is displayed in a TV monitor and/or is printed on paper. Therefore, in order to apply digital image processing these images need to be digitalized first. A way to improve the use of digital image processing tools in the Ophthalmology practice is the reconversion of the analogue systems into digital image acquisition ones, in order to increase the number of image sources.
With the advances during the last decade in computing facilities, and image processing techniques, the interest in this subject has grown being published several articles on this subject, even though there are not many ongoing works on the subject (Duanggate and Uyyanonvara 2008). The ophthalmologists are requiring tools that can reproduce their analyses over their patient retinal images. Nowadays, these quantitative analysis are mainly employed on scientific studies of disease progression and on evaluation of automatic detection tools. The fastidious process of grading the retinal images is not compatible with the standard ophthalmology appointment. Therefore, to introduce these new tools into the everyday interventions, they must be user friendly, being fast at processing, and accurate for clinicians to rely on them. A chronological overview of previous works on drusen detection is presented on the following sections.
2.1 -
Drusen Detection
The drusen detection methods aim to quantify the presence of the abnormalities, and additionally to characterize them according to their shape and size. Their classification into one of the two main drusen categories is also targeted by the detection methods. However their differences, contour smoothness and shape are hard to be recognized by computer software and are normally only distinguished on manual detection.
In this chapter, some of the works and techniques that were developed in the past to detect and quantify drusen will be described.
2.1.1.Manual methods
Over the past twenty years there were more than fifteen studies (Schachat, Hyman et al. 1995; Vingerling, Hofman et al. 1996; Pagliarini, Moramarco et al. 1997; Delcourt, Diaz et al. 1998; Friedman, Katz et al. 1999; McCarty, Mukesh et al. 2001; Oshima, Ishibashi et al. 2001; Klein, Klein et al. 2002; Jonasson, Arnarsson et al. 2003; Varma, Fraser-Bell et al. 2004; Buch, Nielsen et al. 2005; Ferris, Davis et al. 2005; Skenduli-Bala, de Voogd et al. 2005; Augood, Vingerling et al. 2006; Wang, Rochtchina et al. 2007; Bressler, Munoz et al. 2008; Chen, Cheng et al. 2008; Hubbard, Danis et al. 2008; Xu, Li et al. 2008) all over the world with more than one thousand patients each, and the majority with more than three thousand patients (table 2.1 and figure 2.1). Considering that both right and left eyes of each patient were analysed, the size of this bank of images doubled, making their analysis an arduous task.
In these studies the maintenance of the analysis criteria was of most importance, not only to achieve accurate results, but also to allow the comparison among different studies. In most studies, the images were analysed by two different graders to guarantee the accuracy, and when their analyses differed, a third grader, usually a trained ophthalmologist, defined the final grading. Some studies with only one evaluator, applied a statistical evaluation over a selection of random images to maintain the criteria during the grading period. It was revealed in some studies the agreement among graders using the kappa statistics. In the Copenhagen
Eye Study it was achieved an agreement of k=0.97, which is a high coefficient, although only
Table 2.1 – List of selected epidemiologic studies where drusen was evaluated on the last twenty years.
Study Country Date Nr. Patients Image1 Region of Interest
Drusen
classification2 gradersNr. Interobserver variability
The Italian eye study Italy 1991 368 A 5600µm 3 levels* 2+1 k=0.68
The Barbados Eye Study USA 1992 3444 A NA 3 levels 2+1 k=0.54 - 0.80
The Salisbury Eye Evaluation Project USA 1993 2520 A 6000µm 1+3 levels 2+1 k =0.72
The Visual Impairment Project Australia 1995 4744 A 6000µm 3 levels 2 NA
The Reykjavik Eye Study Iceland 1996 1021 A 6000µm 3 levels 2+1 NA
The POLA Study France 1997 2196 A 6000µm 2 levels 1+1 NA
The Hisayama study Japan 1998 1486 A NA 3 levels 2 NA
The Baltimore Eye Study USA 1999 5308 A 3000µm 3 levels NA NA
The Beaver Dam Eye Study USA 1990-2000 4926-2764 A 6000µm 4 levels 2 NA
The Shihpai Eye Study Taiwan 2000 1105 A NA NA NA NA
The Age-Related Eye Disease Study USA 2001 4757 A 3000µm 3 levels NA NA The Copenhagen City Eye Study Danmark 1988-2002 946 - 359 A 6000µm 4 levels 1 k=0.97 The European Eye Study NO, EE, FR, UK,
IT, GR, SP 2002 5040 D 6000µm 3 levels 2 k=0.79
Los Angeles Latino Eye Study USA 2003 7789 A 6000µm 3 levels 2 NA
The Rotterdam Eye Study Nederland 1995-2005 6125-3761 A NA 3 levels 1 NA
The Beijing Eye Study China 2001-2006 4378-3218 A 6000µm NA NA NA
The Age-Related Eye Disease Study 2 USA 2008 ongoing DA NA NA NA NA
Legend:
1Image 2Drusen Classification
A - Analogue 3 Levels - < 63 µm, 64–125 µm or > 125 µm
D - Digital 4 Levels - < 63 µm, 64–125 µm, 125-250 µm or > 250 µm DA - Both digital and analogue 1+3 Levels - none, < 63 µm, 64–125 µm or >250 µm
2 Levels - < 125 µm or > 125 µm