Paula Sofia Fonseca Nabais
Departamento de Conservação e RestauroMestrado em Conservação e Restauro
Spectroscopic characterization of natural
dyes by their non-invasive identification on
pre-Columbian codices: the Maya yellow
Dissertação para obtenção do Grau de Mestre em
Mestrado em Conservação e Restauro, especialização em Ciências da Conservação
Orientador
: Doutora Costanza Miliani, CNR, Universidade de
Perugia, Itália
Co-orientador
: Doutor Aldo Romani, CNR, Universidade de
Perugia, Itália
Júri:
Presidente
: Professora Doutora Maria João Melo, DCR,
Faculdade de Ciência e Tecnologia, UNL
Arguente
: Doutora Solange Muralha, DCR, Faculdade de
Ciência e Tecnologia, UNL
Paula Sofia Fonseca Nabais
Department of Conservation and Restoration
Master degree in Conservation and Restoration
Spectroscopic characterization of natural dyes by their
non-invasive identification on pre-Columbian codices: the
Maya yellow
Faculdade de Ciências e Tecnologia, Universidade
Nova de Lisboa, Dissertation for the Master degree in
Conservation and Restoration, specialisation in Conservation Science
Supervisor: Dr Costanza Miliani
Co-supervisor: Dr Aldo Romani
Juri:
President
: Professora Doutora Maria João Melo, DCR, Faculdade de
Ciência e Tecnologia, UNL
Examiner
: Doutora Solange Muralha, DCR, Faculdade de Ciência e
Tecnologia, UNL
II
Spectroscopic characterization of natural dyes by their non-invasive identification on
pre-Columbian codices: the Maya yellow ©
III Acknowledgements
I would like to thank first to professor Maria João Melo, who believing in my capabilities, got me a project in a foreign country to learn more with a great group of conservation scientists, allowing me to expand my horizons. Moreover, Italy was an experience I shall never forget. Besides learning a new language and connecting with so many different people, it made me grew in so many ways that I could not have grown in Portugal. Because of this opportunity I am certain I became a better person, but also, a better professional.
Secondly, I have to thank to the wonderful people that received me in Perugia. Being alone in a new country is not easy, especially while doing a master thesis and these people made it a little bit better. To Dr Costanza Miliani I owe the success of this project, because without all the help and attention provided it wouldn’t have been possible. By supporting all my ideas, and following me throughout all the complications, she became someone I admire very much. Also, David Buti, who helped me through my first laboratory days, answered all my questions and work side by side with me throughout all the experiments, either they were successful or not. He was a pillar in this project for all the help, but most of all, the support he gave me. All the people in the MOLAB laboratory deserve my many thanks, for helping when I needed the most, or just to find a spatula. Most of all, thank you to Celeste, Francesca e Chiara, who helped me becoming a better professional by accompanying me while I was learning to work better with FT-IR, SERS and UV-Vis. Without them it would have been much harder.
Thirdly, thank you to all my friends, both the ones made in Italy, who enjoyed with me the wonderful pleasures of this country, but also to the ones left in Portugal. To these latter I must say that you brought a little bit of home every time you spoke to me. Besides all the distance, you made this journey with me and helped me in ways you cannot grasp.
Finally, but most importantly, I thank to my grandparents. Without them this project abroad would not have been possible. I thank to my father, for all the help, worries and beliefs he put in me, knowing I could do this. To João Lourenço I owe more than a thank you. You believed in me and supported me in so many ways I shall never forget. We made this adventure together and I could not have had it any other way.
V Abstract
Mesoamerican cultures had a strong tradition of written and pictorial manuscripts, called the codices. In studies already performed it was found the use of Maya Blue, made from a mixture of indigo and a clay called palygorskite, forming an incredibly stable material where the dye is trapped inside the nanotubes of the clay, after heating. However, a bigger challenge lies in the study of the yellows used, for these civilizations might have used this clay-dye mixture to produce their yellow colorants.
As a first step, it was possible to provide identification, by non-invasive methods, of two colorants (a flavonoid and a carotenoid). While the flavonoid absorbed between 368-379 nm, the carotenoid would absorb around 455 nm. A temperature study also conducted allowed to set 140ºC as the desirable temperature to heat the samples without degrading them. FT-IR, conventional Raman and SERS allowed us to understand the existence of a reaction between the dyes and the clays (palygorskite and kaolinite), however it is difficult to understand it in a molecular point of view.
As a second step, five species of Mexican dyes were selected on the basis of historical sources. The Maya yellow samples were produced adapting the recipe proposed by Reyes-Valerio, supporting the yellow dyes extracted from the dried plants on the clays, with addition of water, and then heated at 140ºC. It was found that the addition of water in palygorskite would increase the pH, hence deprotonating the molecules having a clear negative effect in the color.
A second recipe was developed, without the addition of water; however, it was found that the use of water based binders would still alter the color of the samples with palygorskite. In this case, kaolinite without heating yield better results as a Maya yellow hybrid.
It was found that the Maya chemistry might not have been the same for all the colors. The Mesoamericans might have found that different dyes could work better to their desires if matched with different clays.
It was noticeable that for a clear distinction between flavonoids and carotenoids the reflectance and emission studies suffice, but when clay is added, Raman techniques will perform better. For this reason, conventional Raman and SERS were employed in order to create a database for the Mesoamerican dyestuffs for a future identification.
VII Resumo
As civilizações mesoamericanas tinham uma forte tradição de manuscritos escritos e pictóricos, denominados códices. Em estudos já realizados verificou-se a utilização de Azul Maia, feito a partir da mistura de índigo e uma argila denominada paligorsquite, formando um material extremamente estável, onde o corante está preso no interior dos nanotubos da argila, após aquecimento. No entanto, o grande desafio encontra-se no estudo dos amarelos utilizados, pois estas civilizações poderão ter utilizado este hibrido de argila-corante para produzir tons amarelos.
Como primeira fase, tornou-se possível a identificação, por meio de métodos não invasivos, de dois corantes (um flavonóide e um carotenóide). Enquanto o flavonóide absorve entre 368-379 nm, o carotenóide absorveria a cerca de 455 nm. Um estudo de temperatura realizado permitiu definir 140 º C como a temperatura desejável para aquecer as amostras sem causar degradação. Métodos como FT-IR, Raman convencional e SERS permitiram compreender a existência de uma reacção entre os corantes e a argila (paligorsquite e caulino), no entanto, é difícil compreendê-la de um ponto de vista molecular.
Como segunda fase, cinco espécies de corantes mexicanos foram seleccionadas com base em fontes históricas. As amostras de amarelo Maia foram produzidas adaptando a receita proposta por Reyes-Valerio, misturando os corantes amarelos extraídos das plantas secas com as argilas e a adição de água, seguido de aquecimento a 140 º C. Verificou-se que a adição de água em paligorsquite iria aumentar o pH, desprotonando as moléculas tendo um efeito negativo na cor. Uma segunda receita foi desenvolvida, sem a adição de água. No entanto, verificou-se que a utilização de ligantes à base de água iria alterar a color das amostras com paligorsquite. Neste caso, caulino, sem aquecimento, produziu melhores resultados como um híbrido amarelo Maia.
Verificou-se que não existia apenas uma receita-tipo para estes híbridos maias. Os mesoamericanos podem ter compreendido que diferentes corantes funcionariam melhor se combinado com diferentes argilas. Para distinguir entre flavonóides e carotenóides, os estudos efectuados com UV-vis serão suficientes, mas quando a argila é adicionada, as técnicas Raman irão ter uma performance melhor. Por esta razão, Raman convencional e SERS foram utilizados com o fim de criar uma base de dados para os corantes mesoamericanos, permitindo uma identificação futura.
IX Index of Contents
Acknowledgements III
Abstract V
Resumo VII
Index of Contents IX
Index of Figures XI
Index of Tables XV
1. Introduction 1
1.1.Pre –Columbian codices 1
1.2.Maya hybrid pigments 2
1.2.1.“White earth” 2
1.2.2.The Maya Blue 3
1.3.Maya hybrid pigments: the Maya yellow 4
1.4.Objectives 5
2. Materials and Methods 7
3. Results and Discussion 9
3.1.Spectroscopic characterization of simplified Maya yellow replica: the morin
and the annatto 9
3.1.1.UV-vis reflection and emission spectroscopy 9
3.1.2.FT-IR spectroscopy 11
3.1.3.Conventional Raman spectroscopy 11
3.1.4.SERS 12
3.1.5.Discussion 13
3.2.Maya yellow replica 14
3.2.1.Reyes-Valerio Method 14
3.2.2.Modified Method 18
3.2.2.1. UV-vis reflectance spectroscopy 20
3.2.2.2. UV-Vis emission spectroscopy 20
3.2.2.3. SERS 21
3.2.3. Discussion 21
3.3.Analysis of the codices 23
4. Conclusion 26
X
Annex 1 - Materials and Methods 31
1.1.Laboratory analytical methods Reyes-Valerio recipe (2006)
31 32
1.2.Analytical methods 32
Annex 2 – Simplified Maya yellow replica 35
2.1. Temperature effect 35
Morin 35
Annatto 37
Palygorskite and Kaolinite 39
2.2. UV-vis reflectance spectroscopy 41
2.3. UV-Vis emission spectroscopy 42
2.4. FT-IR spectroscopy 43
Annex 3 – Maya yellow replica 45
3.1. Reyes-Valerio method 45
3.1.1. UV-vis reflectance spectroscopy 45
3.1.2. UV-Vis emission spectroscopy 46
3.2. Modified method 48
3.2.1. UV-vis reflectance spectroscopy 48
3.2.2. UV-Vis emission spectroscopy 51
3.2.3. SERS 53
Annex 4 – Photographs of the samples 55
4.1. Simplified Maya yellow replica 55
XI Index of Figures
1. Introduction
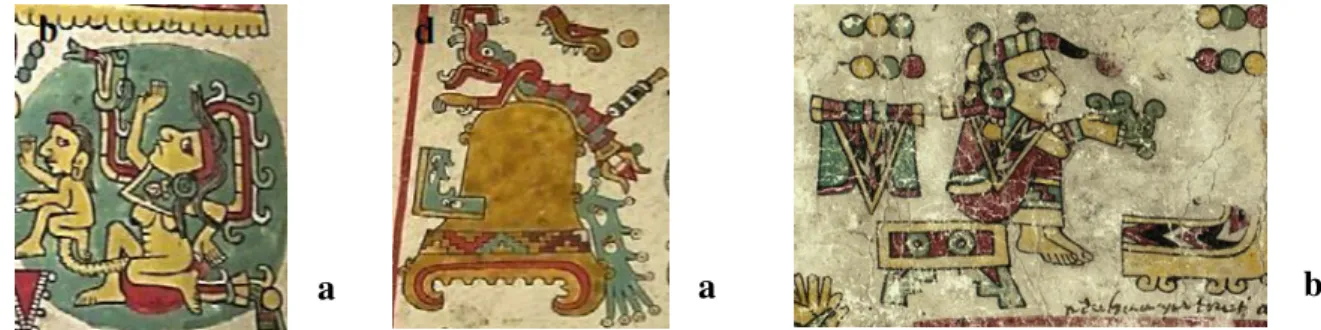
Figure 1.1 –Details from different pre-Columbian codices studied by MOLAB: a) Codex
Cospi, b) Codex Zouche-Nuttall, c) Codex Tro-Cortesianus, d) Codex Fejérváry Mayer. 2
Figure 1.2 –Structure of palygorskite. 2
Figure 1.3 – Chemical structure of indigo. 3
Figure 1.4 – Structure of Maya Blue. 3
Figure 1.5 –Yellow colored details from a) Codex Zouche-Nuttall and b) Codex Colombinus. 4
3. Results and Discussion
Figure 3.1 – UV-vis spectral properties of morin MY’s unheated and heated at 140ºC. Morin@palygorskite: a) reflectance and b) emission (λexc= 375 nm). Morin@kaolinite: a) reflectance and b) emission (λexc= 375 nm).
9
Figure 3.2 – UV-vis spectral properties of annatto MY’s unheated and heated at 140ºC. Annatto@palygorskite: a) reflection and b) emission (λexc= 375 nm). Annatto@kaolinite: a) reflection and b) emission (λexc= 375 nm).
10
Figure 3.3 – Normalized Raman spectra of a) annatto@palygorskite and b) annatto@kaolinite, (20% w/w), with heating at 140ºC (λexc=514).
12
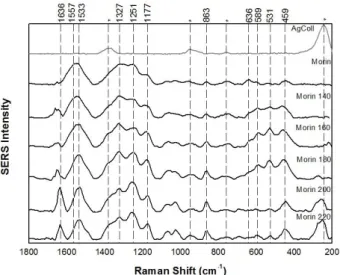
Figure 3.4 –Normalized SERS spectra of a) morin@palygorskite and b) morin@kaolinite, with heating at 140ºC (λexc=514).
12
Figure 3.5 –Illustration of the excited states of Morin. 13 Figure 3.6 –Quercetin molecule following type I oxidation or type II. 19 Figure 3.7 –Proposed structures of 1:1 luteolin-aluminum complexes. 19
Figure 3.8 –MIR measurements of Codex Borgia. 24
Figure 3.9 –XRF measurements of Codex Vaticanus A 24
Figure 3.10 –UV-vis measurements of Codex Vaticanus B. 24 Figure 3.11 –Spectral properties of the yellow areas from Codex Borgia: a) MIR in the
7000-500 cm-1 region; b) MIR in the 2000-500 cm-1 region; c) emission (λexc= 375 nm).
25
Figure 3.12 –S pectral properties of the orange areas analysed from Codex Borgia: a) MIR in the 7000-500 cm-1 region; b) emission (λexc= 375 nm).
25
Annex 2 – Simplified Maya yellow replica
XII Figure A.4 - FT-IR spectra of morin with increasing temperature (1750 – 450 cm-1). 36 Figure A.5 - Normalized SERS spectra of morin, with increasing temperature (λexc=514). 37 Figure A.6 - Chemical structures of some bixin/norbixin isomers: all-trans isomer (left) and 9’
-cis-bixin (right). If R1=H, R2=H = norbixin; if R1=H, R2=CH3 = bixin.
37
Figure A.7 - Reflectance spectrum of annatto, with heating. 38 Figure A.8 - Chemical structure of the main product of degradation from 9’-cis-bixin. 38 Figure A.9 - Laser induced (λexc=375) emission spectrum of annatto, with heating. 38 Figure A.10 - FT-IR spectra of annatto with increasing temperature (4000 – 450 cm-1). 39 Figure A.11 - Normalized Raman spectra of annatto, with increaing temperature (λexc=514). 39 Figure A.12 - FT-IR spectra of palygorskite with increasing temperature (4000 – 450 cm-1). 40 Figure A.13 - FT-IR spectra of kaolinite with increasing temperature (4000–450 cm-1). 40 Figure A.14 - UV-vis emission properties (λexc= 445 nm) of morin MY’s unheated and heated at
140ºC. a)Morin@palygorskite and b)Morin@kaolinite. 42
Figure A.15 - Normalized fluorescence emission of Chlorophyll-a: PSII (straight line) and PSI
(dotted line) [44]. 43
Figure A.16 - FT-IR spectra of a) Morin@palygorskite and b) Morin@kaolinite at 140°C (2000 – 650 cm-1
). 43
Figure A.17 - FT-IR spectra of annatto@palygorskite at 140°C in the a) 2000 – 650 cm-1 region and b) 4000 – 2500 cm-1
region 43
Figure A.18 - FT-IR spectra of annatto@kaolinite at 140°C in the a) 2000 – 650 cm-1 region and b) 4000 – 2500 cm-1
region 44
Annex 3 – Maya yellow replica
Figure A.19 - Reflectance spectra of fustic@clay. 45
XIII Figure A.32 - Reflectance spectra of Orange Cosmos@clay heated at 140ºC. 49 Figure A.33 - Reflectance spectra of Yellow Cosmos@clay heated at 140ºC. 49 Figure A.34 - Reflectance spectra of Orange Marigold@clay with heated at 140ºC. 50 Figure A.35 –Reflectance spectra of Yellow Marigold@clay heated at 140ºC. 50 Figure A.36 - Reflectance spectra of Zacatlaxcalli@clay heated at 140ºC. 50 Figure A.37 - Laser induced (λexc=375) emission spectra of Fustic@clays heated at 140ºC. 51 Figure A.38 - Laser induced (λexc=375) emission spectra of Orange Cosmos@clays heated at
140ºC. 52
Figure A.39 -Laser induced (λexc=375) emission spectra of Yellow Cosmos@clays heated at
140ºC. 52
Figure A.40 -Laser induced (λexc=375) emission spectra of Orange Marigold@clays heated at
140ºC. 52
Figure A.41 - Laser induced (λexc=375) emission spectra of Yellow Marigold@clays heated at
140ºC. 53
Figure A.42 - Laser induced (λexc=375) emission spectra of Zacatlaxcalli@clays heated at
140ºC. 53
Figure A.43 - SERS spectra of Fustic and Orange Cosmos with both clays (λexc=785). 53 Figure A.44 - SERS spectra of Yellow Cosmos and Orange Marigold with both clays
(λexc=785).
54
Figure A.45 - SERS spectra of Yellow Marigold and Zacatlaxcalli with both clays (λexc=785). 54 Figure A.46 - SERS spectra of Yellow Marigold + palygorskite (a), dye + palygorskite heated at 140ºC (b), dye + palygorskite heated at 140ºC and washed (c), dye + palygorskite + water added during preparation (d), dye + palygorskite washed (e) (λexc=785).
XV Index of Tables
1. Introduction
Table 1.1 - Identification of the main yellow and orange colours, with their Nahuatl names,
European names, source and chemical components found by HPLC. 5 Table 1.2 –Table with the characterization of the methods and materials used. 7
3. Results and Discussion
Table 3.1 - Photographs of the Maya yellow replica samples following the Reyes-Valerio
recipe with heating at 100ºC and with heating at 140ºC (20% in weight of the dye). 15 Table 3.2 - Representation of the color and the pH of the pure dyes before addition of sodium
hydroxide (NaOH) (with distilled water, pH=6) and after the addition of NaOH (pH=9). 15 Table 3.3 - Representation of the color and the pH measurements made to Yellow Marigold
and the hybrid pigments with both clays (with water, pH=6). 16
Table 3.4 - Photographs of Yellow Marigold, comparing the effect of water in the color. 16 Table 3.5 - Main structures found at pH= 6 and 9 for the various flavonoid compounds
identified in the UV-Vis and SERS studies. 17
Table 3.6 - Photographs of the Maya yellow replica samples following the modified recipe,
with and without heating at 140ºC (50% dye). 18
Table 3.7 - Summary of what was found in this work through the spectroscopic methods
employed. 23
Table 3.8 - Physical and historical characteristic of the three codices studied in the Vatican
library. 23
Annex 2 – Simplified Maya yellow replica
Table A.1 - Absorption maxima of the pure dyes and the dye-clay hybrids. 41 Table A.2 - Emission maxima of the pure dyes and the dye-clay hybrids. 42
Annex 3 – Maya yellow replica
Table A.3 - Absorption maxima of the samples with the Reyes-Valerio method (λmax abs
(nm)). 45
Table A.4 - Emission maxima of the Reyes-Valerio method (λexc= 375 nm). 46 Table A.5 - Absorption maxima of the samples with the Modified method (λmax abs). 48 Table A.6 - Emission maxima of the Modified method (λexc= 375). 51
Annex 4 – Photographs of the samples
Table A.7 - Photographs of the simplified Maya yellow replica samples recipe with and
XVI Table A.8 - Photographs of the Annatto samples recipe with and without heating (50% dye). 55
Annex 5 – Non-invasive characterization of the codices
Table A.9 - Representation of all the known codices, provenance (area), group and
conservation site. 57
Table A.10 - Representation of all the materials found in the non-invasive analysis performed
1 Chapter 1: Introduction
1.1. Pre –Columbian codices
For thousands of years, sophisticated civilizations prospered in what is now South and Central America and various cities were built by different civilizations, such as the Maya (300 B.C. – 900 A.D.) in Yucatán and Mexico, and the Aztecs (1325–1521 A.D.), in the Valley of Mexico [1].
As stated by Haude [1], the culture of these civilizations culminated in a strong tradition of written and pictorial manuscripts. The scribes had an important role in Aztec society, for they produced extensive manuscripts recording in images and logophonetic writing, religious, calendrical and astronomical information [2]. After the Spanish conquest of Mexico, many of these written books, the codices, were lost. However, some of them survived and were brought to Europe, as bizarre objects. Nowadays, around 15 of these codices rest in several universities and libraries around the world [3, 4]. These codices show considerable beauty, very different from that found on European illuminated manuscripts. Little is known about the colorants that were used in Mesoamerican codices; however, sources such as the Florentine Codex can be very valuable in understanding the tradition of painting. As understood by Wallert, a description from the Florentine Codex suggests the use of inorganic pigments (“…grinds pigments…”) as well as organic dyes (“…a painter who dissolves colours”) [2].
The analysis of these codices presented for many years a big challenge. The lack of non-invasive methodologies did not allow for proper analysis to be made without affecting the structural unity of the manuscripts. However, in the last few decades, several non-invasive analytical tools and methodologies were developed, and provided ways for a better characterization of the artwork materials, without damaging the manuscripts. Four codices have already been studied by the MOLAB facility of Eu-ARTECH and CHARISMA European project [5] (namely Codex Cospi [6], Codex Fejérváry Mayer, Codex Zouche-Nuttall and Codex Tro-Cortesianus [7]) and one other (Codex Colombinus [8]) by a group of investigators from the Universidad Nacional Autónoma de México.
2 Fig. 1.1– Details from different pre-Columbian codices studied by MOLAB: a) Codex Cospi, b) Codex
Zouche-Nuttall, c) Codex Tro-Cortesianus, d) Codex Fejérváry Mayer.
1.2. Maya hybrid pigments
Very interesting was the use of dye-clay complexes to make very lasting paints. Such complex is very well known in the Maya blue. In fact, dye-clay complex of various colours such as yellow, red, blue and green have been identified in the Mayan mural painting tradition [3]. However, it was found that the usage of dyes was more similar to the textile industry than the mural painting [4].
1.2.1. “White earth”
Clays are nowadays widely applied in many fields due to their high specific surface area, chemical and mechanical stabilities, and a variety of surface and structural properties. Several clays, because of their unique structure have high binding affinities with various chemical species, such as organic molecules. Kaolinite and palygorskite are presented in this work as silicates capable of encapsulating such molecules.
Kaolinite, with the formula Al2Si2O5(OH)4, has crystals which are pseudo-hexagonal, along with plates, larger books, and vermicular stacks. However it has relatively low surface area in comparison to palygorskite [9, 10]. Fibrous clay minerals, such as palygorskite (Si8Mg5O20(OH)2(H2O)4·4H2O), have great potential for the retention of dyes, thanks to its high surface area [10]. Palygorskite is known as the clay in the Maya blue complex. The structure of this clay is based on a continuous tetrahedral sheet in which the SiO4 tetrahedrons periodically (every two pyroxene-like chains) invert the orientation of their apical oxygen, which are bonded to z-elongated, discontinuous octahedral ribbons containing both magnesium and aluminum ions (Fig. 1.2).
The structure is crossed by tunnels usually filled by weakly-bound zeolitic water molecules connected to the magnesium cations of the Mg (Al,Fe) ribbon edges of the channels [11, 12]. The palygorskite channels might be filled with water or organic molecules. In order for the organic molecule to be adsorbed, some water, such as the zeolitic water, must leave the palysgorekite structure.
Fig. 1.2 - Structure of palygorskite. The microchannels are deprived of zeolitic water
[11]1.
a
b
c
d
3 This phenomenon happens with high temperature. In fact, it is proven that the heat from burning incense was one method to produce the Maya blue pigment [13]. It was found that dehydration of palygorskite takes place in a series of steps being the most important at approximately 120ºC with the loss of free pore water and water adsorbed on surface. The loss of both zeolitic and hygroscopic water occurs until 200°C [12].
1.2.2. The Maya blue
Produced in the Yucatán peninsula (Mexico) from the VII to XVI century A.D., the Maya blue pigment forms when the clay is mixed and heated (<200ºC) with the indigo dye [14]. Indigo (Fig. 1.3) is a natural blue dye formed by a mixture of coloring species of which indigotin is the primary species responsible for the distinctive blue color. The Mayas obtained indigo from a group of plants generically named añil or xiuquitlitl (mainly Indigofera suffruticosa (which the Mayans called ch’ooh)).
This compound can be considered an ancestor of modern hybrid materials, for an organic guest molecule is adsorbed within the pores of the hosting palygorskite frameworks [11].
Fig. 1.3– Chemical structure of indigo.
The indigo in Maya blue is expected to diffuse, in some proposed models, inside the palygorskite tunnels and form specific host/guest interactions with the clay matrix. Encapsulation and bonding within the clay tunnels shield the dye molecules from external environment thus ensuring the pigment stability [11].
In 2008, Chiari G. et al., presented a new model, in which the grooves (half channels, cut along their axis), were the main encapsulation sites for the indigo molecule (Fig. 1.4). Indigo cannot infiltrate the channels, since the formation of hydrogen bonds strongly binds the first molecule to the clay framework, preventing it from further penetration and impeding other molecules from entering [15].
Fig. 1.4 - Structure of Maya blue. Indigo (yellow) is occupying both channels and grooves (H=white;
C=yellow; N=blue; O=red; Si=light blue; Mg=gray) [15]2.
Doménch A. et al. [16] found that the hue of the Maya blue is not just due to the indigo molecule, but is accompanied by other minority dyes which are distributed in different sites in the host palygorskite matrix, and different proportions of these components can give different hues. Also, because of its yellow color, dehydroindigo has been considered by many as a possible component to the formation of Maya yellow [16, 17].
4 1.3. Maya hybrid pigments: the Maya yellow
For several years, scientists and historians thought they could understand the material with which the great civilizations of South and Central America made the color yellow. It was found in some codices the presence of orpiment and, although surprising, it was easily identified by Raman spectroscopy [3]. However, it was suggested by Vandenabeele et al. [18] that other pigments similar to Maya blue might exist. On mural paintings, Doménech et al. [19] reported the use of pigments similar in formation to Maya blue, and on codices as described before, it was found an emitting yellow dye precipitated onto a clay base, found through FTIR in reflection mode[3, 4, 6]. Therefore these evidences point out to the use of a yellow organic-inorganic hybrid pigment, besides Maya blue. It was found that, for Codex Cospi, several other organic-inorganic hybrids were used (light yellow, bright orangeish-yellow and orange) all composed by a mixture of a clay with an unknown yellow dye (found by UV-vis). On Codex Fejérváry-Mayer more dyes (red, orange and brown) were found to be mixed with clay, while on the Codex Colombinus the yellow dyes were not added to the latter. Also, to obtain an orange color, red and yellow dyes were mixed, while another orange was obtain by a single dye. This way is noticeable the plurality of different dyes, used to obtain different tonalities, which characterizes the different codices. In fact, sometimes it was found orpiment and no yellow dye at all (table A.12 of Annex 5) [3, 18].
Fig. 1.5– Yellow colored details from a) Codex Zouche-Nuttall and b) Codex Colombinus.
Buti did, in 2012, a series of studies comprising five species of Mexican dyes were selected both for their importance and availability in Mexico cultures [3]. Identification problems arose with the in situ study of Mesoamerican codices, suggesting the guidelines for the laboratory study and so Maya yellow pigments replicas were produced and characterized. Pure samples were preliminary investigated with HPLC-DAD in order to characterize the extract compounds from the selected plants (table 1.1). Afterwards, Raman, UV-vis reflectance and fluorescence spectroscopies were performed to highlight the characteristic
spectral features of each dye and to investigate the clay-dye
interaction occurring in the hybrid pigments. Furthermore, SERS technique was also applied
only on pure dyes where conventional Raman appeared to be unsuitable due to the high fluorescence background.5
Table 1.1 - Identification of the main yellow and orange colours, with their Nahuatl names,
European names, source and chemical components found by HPLC [3].
Nahuatl name European name Botanical source Chemical component
Zacatlaxcalli Barba de León Cuscuta sp.
Cassytha sp.
Quercetin, Kaempferol, Isorhamnetin
Xochipalli Yellow Cosmos
Orange Cosmos Cosmos sulphureus
Luteolin-O-glucoside, Butein-O-glucoside, Luteolin, Quercetin,
Butein
Achiotl Annatto Bixa orellana Bixin, Crocetin
- Pallo Amarillo
Yellow fustic
Cholophora tinctoria
Maclura tinctoria Morin, Kaempferol
Zempoalxóchitl Yellow Marigold
Orange Marigold Tagetes erecta
Quercetagetin-O-hexose, Quercetagetin, Patuletin
1.4. Objectives
This work intends to unveil the mysteries surrounding the Maya Yellow (MY), presenting a better understanding of this hybrid material, as well as to provide a database for yellow dyes not common in the European art history. For this, it is necessary to understand also the differences between some classes of colorants, such as the flavonoids and the carotenoids, present in plants that were most likely used to produce the yellow color in the Mesoamerican culture. This study tries to shed a light on their differences as colorants in the clay-dye hybrids, as well as the type of interaction they might have with the clay to understand how the Mesoamericans created such stable colorants. Also, since heating was used as an important step for the production of these hybrids, a detailed study on the effects of temperature on the molecules was performed.
Therefore, this study is separated in two parts:
• The simplified Maya yellow replica: where two basic colorants are used (a flavonoid and carotenoid) and mixed with two clays (palygorskite and kaolinite). This study intents to understand the dye-clay hybrid, has well as provide possible identification, by non-invasive methods, of flavonoids and carotenoids when mixed with clay.
7 Chapter 2: Materials and Methods
Table 2.1 –Table with the characterization of the methods and materials used.
Replica Materials Recipe Short name Details
S im p li fi ed M aya ye ll ow re p li ca
Morin Morin and Annatto were prepared at 20% in mixture with the two clays and several temperatures were employed from 140ºC to 220ºC.
MY simplified
replicas
Percentage of dye set at 50% for annatto. Annatto Clays: palygorskite and kaolinite M aya ye ll ow r ep li ca Fustic
1) Reyes –Valerio Recipe (dye + clay +
water)
2) Modified Recipe (dye + clay)
MY replica
Percentage of dyes was set at 50%. Dyes were selected by their importance in Mexican culture and for their availability (see table 1.1)
Orange Cosmos Yellow Cosmos Orange Marigold Yellow Marigold Zacatlaxcalli Clays: palygorskite and kaolinite
9 Chapter 3: Results and Discussion
3.1. Spectroscopic characterization of simplified Maya yellow replicas: the morin and the annatto
The spectral characterization of simplified MY replicas is here reported and discussed. Because all the dyes at different extend showed a degradation at temperature higher than 140-160ºC (See the Temperature study in Annex 2) it was chosen to focus only the hybrid samples unheated and those heated at 140ºC.
3.1.1. UV-vis reflectance and emission spectroscopy
The UV-vis reflectance and emission spectra collected on simplified MY replica as powder are reported in figures 3.1-3.2 and compared with those of pure dyes and clays (See Annex 2 for the spectra and the tables with the absorption/emission maxima for all the samples). It’s necessary to underline that all MY reflectance spectra are characterized by a sharp band in the near infrared region (at 1427 and 1404 nm for palygorskite and kaolinite respectively) assigned to the OH stretching combination bands (7280 and 7163 cm-1 for palygorskite and kaolinite respectively).
Morin
MY’s
Fig. 3.1– UV-vis spectral properties of morin MY’s unheated and heated at 140ºC. Morin@palygorskite: a) reflectance and b) emission (λexc= 375 nm). Morin@kaolinite: a) reflectance and b) emission (λexc= 375 nm).
Morin is characterized by a band I and 368 nm and two shoulders at higher wavelengths. When kaolinite and palygorskite are added, the main band at 368 nm shifts to 400 nm indicating an
a
c
10 interaction of the hydroxyflavone with both clays. Differently from the thermal behavior of pure dye powder, for morin MY’s it has barely no modification with increasingly higher temperatures, proving that the clays prevent thermal degradation.
Morin at the solid state exhibits a very low emission having a maximum at about 600 nm. It’s important to report here that the emission of morin in solution is measured at circa 500 nm and is ascribed to a proton-transfer tautomer fluorescence band [21].The emission spectra of the morin with the two clays give confirmation that some interaction takes place. The most evident effect is the quite important increase of emission intensity observed for both morin MY’s with respect to pure morin. In particular, for morin@palygorskite excited at λexc= 375 nm, we see a hypsochromic shift, since the maxima go towards lower wavelengths (from 630 to 598 nm). For morin@kaolinite it is possible to see a creation of a double band (at 512 and 621 nm) in the spectrum, more evident in the heated sample. It is also very important to state the temperature stability that morin acquires when added to clay. In fact it remain very stable, because the maxima don’t change abruptly until 180-200ºC, while the pure morin would only remain stable until 140-160ºC.
Annatto MY’s
It is possible to see that there is almost no change or shifts in the reflection spectra.
Emission spectra recorded on the annatto MY’s when compared with the spectrum of pure annatto in solid phase, suggest an interaction between carotenoid dyes and palygorskite. In fact, the maxima of emission bands of the specimens annatto@palygorskite both unheated and heated are blue shifted of c. 50 nm with respect to pure annatto. This shift is not occurring for the samples annatto@kaolinite. Also, the chlorophyll-a fluorescence emission spectrum is characterized by a major peak at 683 nm attributable to photosystem II which tends to decrease with higher temperatures.
11 Fig. 3.2– UV-vis spectral properties of annatto MY’s unheated and heated at 140ºC. Annatto@palygorskite: a) reflection and b) emission (λexc= 375 nm). Annatto@kaolinite: a) reflection and b) emission (λexc= 375 nm).
3.1.2. FT-IR spectroscopy
The infrared spectra collected of the simplified MY replica, collected in transmission mode, are reported in Annex 2 (reference spectra of pure dyes and clays are also shown for comparison). In the morin-palygorskite spectrum, it is identifiable the bands corresponding to the clay: the 1191 cm-1 corresponds to the Si-O-Si bond between ribbons [22]. However, the peak at 1656 and 1606 cm-1 indicate the presence of morin, for they are related to the CC stretching of ring A and C, and to the C=O stretching of ring C, respectively. Also other peaks related to the morin molecule are presented in the morin-palygorskite hybrid, although with very small intensity. In the morin@kaolinite spectra, it can be seen the peaks corresponding to the clay, such as 1111, 1031 and 1007 cm-1 (Si-O stretching), but also 940 and 914 cm-1 (OH deformation of hydroxyl groups). However, it becomes very difficult to detect the dye when clay is added.
The spectra of annatto and both clays (20%) clearly show almost no presence of annatto, more specifically bixin, except for a small part in the higher wavenumber region. The region between 2000 and 1000 cm-1 should have several bixin bands if the molecule was present. However the presence of the bands in the 4000-2500 cm-1 region belonging to the hydrocarbon skeleton of bixin could indicate a small presence of the molecule, although not enough to produce a usable color. In fact Kohno Y. et al. [23] stated that the annatto did not adsorbed into motmorillonite by itself, and so, the samples were
not colored, has it was found in this work. Because the FT-IR didn’t present extensive results it was found unnecessary to perform these analyses in the 50% Annatto samples.
3.1.3. Conventional Raman spectroscopy
All the simplified MY samples were analyzed through conventional Raman. However, as stated before by Buti D. [3], while carotenoids presented characteristic scattering signals, the flavonoids show only a strong fluorescence background. As in this work, the extreme fluorescence of the morin molecule did not allow for conclusive results to be taken. For this matter, SERS was performed to the morin samples. Conventional Raman spectra of annatto MY’s are reported in figure 3.3 and compared with that of pure annatto. Typical Raman bands of carotenoid structure are visible in
12 all the spectra, namely 1522, 1186, 1153 and 1005 cm-1 corresponding to the C=C stretching, CH bending and CC stretching and the CH3 bending of bixin, respectively [24]. It is important to underline that the scattering spectra did not shown any indication of a molecular interaction between annatto and the clays.
Fig. 3.3– Normalized Raman spectra of a) annatto@palygorskite and b) annatto@kaolinite, (20% w/w), with heating at 140ºC (λexc=514).
The pure annatto degraded easily after 140ºC, as we see in the spectrum of the dye alone (Annex 2). However the clay might have sheltered the molecule until 180ºC. The Annatto at 50% was analyzed with λexc=785 nm and so the signal was too weak to represent.
3.1.4. SERS
In the SERS spectra of figure 3.4, representing the morin@clay hybrid it is possible to identify several peaks very similar to the ones found in the pure morin spectrum. The attemp of attribuition can be applied and several peaks such as 1639 and 1541 cm-1 can find similarities in the spectra already studied of morin (Annex 2). However it is possible to find some changes, such as in the area were it is likely related to the torsion of several CCCH bonds in the different rings (600-400 cm-1). This could indicate a possible reaction with the clay. The ‘*’ symbolizes the contribuition of the colloid.
Fig. 3.4– Normalized SERS spectra of a) morin@palygorskite and b) morin@kaolinite, with heating at 140ºC (λexc=514).
a
b
13
3.1.1. Discussion
As Buti D. [3], found, all the flavonoids show absorption maxima at 300-385 nm, and in fact here it was found that the morin absorbs between 368-379 nm. In fact, the UV–visible spectra of flavonoids are characterized by an intense Band I (here noticed at 368 nm) and diminished Band II absorptions (not visible in the reflectance spectra of morin) [25].
In morin, these two band transitions are π-π* and can be represented by two ressonance structures (Fig. 3.5). The band at 368 nm suffers a bathochromic shift when clay is added to the morin samples, as well as the maxima at 424-494 nm. Also the emission spectra show that an interaction has taken place. In the morin@palygorskite spectra we see a
Fig. 3.5 - Illustration of the excited states of Morin [26]3.
hypsochromic shift while for morin@kaolinite we see a creation of a double band that becomes more evident with increasing temperature.
Also in the analyses of carotenoids, the UV-Vis spectroscopy is a valuable tool, because the absorption maxima, form, and fine structure of spectra are characteristic of the molecules chromophore [27]. Buti D. [3], found that most carotenoids absorb in the 433-500 nm region. In fact, these absorptions are found in the spectra above, but a bit shifted. It might have to do with the isomer in the powder – 9’-cis-bixin. This shift actually simplifies the distinction between flavonoids and carotenoids but not when the clays are added. Therefore this method might not be very reliable for this distinction, and other methods, such as vibrational techniques might show to be more useful.
The emission spectra of annatto@palygorskite show a possible interaction between the carotenoid and the clay, because the maxima of these species shifted 50 nm in relation to the pure annatto. The same does not occur for annatto@kaolinite.
The FT-IR presented some problems in understanding the possible reactions between the dyes and the clays. It was valuable for identifying between the dyes alone and also to characterize both clays. However when clay is added to the dyes it hides the signal from the latter. In this sense, Raman is presented as better tool because it picks up more effectively the dye, when using an excitation in the visible. SERS is necessary when dealing with flavonoids because of their strong fluorescence in Conventional Raman. With SERS some changes relating with both the morin and the morin@clay heated, were found, such as in the area were it is likely related to the torsion of several CCCH bonds in the different rings. This could indicate a possible reaction with the clay.
For the annatto dye, the conventional Raman method was in fact much more useful, since it was possible to see a better thermal stability of the molecule with the clays. In fact, bixin is considered to be unstable in the presence of heat, but some studies showed that the techniques of complexation and encapsulation decrease the degradation rate of bixin caused by high temperature [28]. This could
14 indicate that it is present a small, but existing reaction between the clay and the bixin. One hypothesis is that the bixin molecule is too long to fit in the inner channels of palygorskite, or between the plates and stacks of kaolinite. It might be a simple outer-surface reaction were the molecule sets in the grooves of palygorskite, or in the surface of the crystals of kaolinite, in such a small quantity that is not enough to color visibly the clay.
3.2. Maya yellow replica
3.2.1. Reyes-Valerio Method
The Reyes-Valerio method samples were first prepared by Buti D. [3] and then were further heated at higher temperatures (140ºC). These samples are prepared, has stated before, mixing the dyes (20% in weight) with the clay (kaolinite or palygorskite) while adding water. Images of the MY’s replicas obtained following this method are shown in table 3.1.
It is clear that the heating followed by washing (see table 3.1) darkens the colors, specially those made with palygorskite. In fact, with heating at either 100ºC or 140ºC, the colors obtain with this clay are not similar to the real cases. Marigold is a clear example, where it acquires a green tone with palygorskite, but with kaolinite however, it shows a better tone, when it is heated at lower temperatures. Other dyes, such as cosmos or fustic, when heated at lower temperatures, present good similarities with the real cases of orange, but not yellow. Also zacatlaxcalli does not present, with palygorskite, a tone similar to the dye. It is clear, however, in zacatlaxcalli@kaolinite that the amount of dye is not sufficient. See Annex 2 for the UV-vis spectra of these samples.
15
Table 3.1– Photographs of the Maya yellow replica samples following the Reyes-Valerio recipe with
heating at 100ºC and with heating at 140ºC (20% in weight of the dye).
Samples
Heated at 100ºC Heated at 140ºC
Dye Dye @
Palygorskite
Dye @
Kaolinite Dye
Dye @ Palygorskite
Dye @ Kaolinite
Fustic
Orange Cosmos
Yellow Cosmos
Orange Marigold
Yellow Marigold
Zacatlaxcalli
Table 3.2 –Representation of the color and the pH of the pure dyes before addition of sodium
hydroxide (NaOH) (with distilled water, pH=6) and after the addition of NaOH (pH=9).
Compound Before addition of NaOH After addition of NaOH pH color of the solution pH color of the solution
Annatto4 6 transparent 7/8 yellow
Fustic 6 light orange 7/8 light orange
Orange Cosmos 6 orange 7/8 dark orange
Yellow Cosmos 6 light yellow 7/8 dark orange
Orange Marigold 6 light yellow 7/8 greenish yellow
Yellow Marigold 6 light yellow 7/8 greenish yellow
Zacatlaxcalli 6 transparent 7/8 yellow
16 Yellow marigold was chosen to perform the pH study because it was the dye that changed more when palygorskite and water were added (table 3.3). The measurement of pH with yellow marigold@palygorskite + water rendered a pH= 7/8, between the pH=6 of the dye and the pH=9 of the palygorskite. With kaolinite, the pH remains the same after the mixture. It is clear that the deprotonation of the molecules in a basic environment, caused by palygorskite, changes the color of the dyes (table 3.5 for main structures at different pH). A similar effect was found for alizarin with palygorskite which showed a remarkable red shift [14]. For these reason, this recipe does not presented good results for a MY replica. In fact, in table 3.4 it is possible to see that the addition of water, even without heating, clearly changes the color.
Table 3.3 – Representation of the color and the pH measurements made to Yellow Marigold and the
hybrid pigments with both clays (with water, pH=6).
Sample pH Color
Yellow Marigold 6 light yellow
Palygorskite 8/9 white
Kaolinite 6 white
Yellow Marigold + Palygorskite 7/8 dark green
Yellow Marigold + Kaolinite 6 yellow
Table 3.4 – Photographs of yellow marigold, comparing the effect of water in the color (see Annex 3
for the UV-vis and SERS spectra).
Samples Yellow Marigold@Palygorskite
Without heating
Without Water Prepared with water Washed after preparation
Heated at 140ºC
17
Table 3.5 – Main structures found at pH= 6 and 9 for the various flavonoid compounds identified in
the UV-Vis and SERS studies(Chemicalize, ChemAxon, accessed May 2014, www.chemizalize.com).
Main structures found at pH=6
Main structures found at pH=9
M
or
in
L
u
te
oli
n
B
u
te
in
P
at
u
let
in
Qu
er
ce
tage
tin
B
ixi
n
Qu
er
ce
tin
18 3.2.2. Modified Method
Since it was clear that the water causes the deprotonation of the molecules in the Reyes-Valerio method, some changes were employed such as not including water in the preparation and increasing the amount of dye to 50%.
Table 3.6– Photographs of the Maya yellow replica samples following the modified recipe,
with and without heating at 140ºC (50% dye).
Samples
Without heating Heated at 140ºC
Dye@Palygorskite Dye@Kaolinite Dye@Palygorskite Dye@Kaolinite
Fustic
Orange Cosmos
Yellow Cosmos
Orange Marigold
Yellow Marigold
Zacatlaxcalli
It is possible to see by table 3.6 that the removal of water in the preparation of the hybrid causes a positive effect. In fact, not only Marigold presents a better tone, but even Yellow Cosmos appears as a possible Maya yellow hybrid. However, it is noticeable the small darkening of the samples when heated, especially those with palygorskite.
19 In particular, the authors found that the flavonoids containing two OH groups in the B ring would suffer a two-electron, two-proton oxidation (Type I), which occurs for quercetin, luteolin, butein, patuletin and quercetagetin. However, this process could be accompanied by the oxidation of one of the OH groups of the B ring and the OH of the C3 carbon in the ring C (Type II), which Fig. 3.6– Quercetin molecule following type I oxidation or type II
[29]5.
occurs for morin, isoharmnetin and kaempferol. They found that thermal treatment above 100ºC was the key, promoting the redox tuning accompanying the penetration of the dye in the palygorskite structure by linkage of the ring B to the clay channels.
It might be possible to consider that the heating promotes the creation of these oxidized species that may be water sensitive, altering greatly the color of the samples. In this case, kaolinite without heating yield better results as a Maya yellow hybrid, because the pH of kaolinite is equal to the protonated species of dyes and so the water in non-heated samples would not alter the color. Palygorskite, however, because of its basic pH when water is added might not perform as kaolinite with these binders.
It is necessary to state also the clear change in color of the dye when the clays were added. Flavonoids are known for their possible chelation with metal ions. For these, there are three potential coordination sites: between 5-hydroxy and 4-carbonyl group, between 3-hydroxy and 4-carbonyl group and between 3’, 4’-hydroxy group in B ring. Quercetin, for example, chelates metals via 3’, 4’ -hydroxy group in B ring by its -hydroxyl groups and also morin can form complexes with several metals like copper (II) [30].
Rygula A. et al., found that luteolin connects with aluminum (III) by a conjugated system of an oxo group at C4 and a double bond at C2=C3. The complex is confirmed by the presence of 396 nm band in the UV– vis spectrum [31].
Fig 3.7– Proposed structures of 1:1 luteolin-aluminum complexes [31]6.
20 3.2.2.1.UV-vis reflectance spectroscopy
The flavonoid molecules are known to be characterized in solution by two important absorptions: an intense Band I (300-390 nm) and a shorter Band II (220-270 nm) [3, 25]. In fact, with the exception of Annatto (already studied before), with its main component being a carotenoid, all of the other four botanic species (Fustic, Cosmos, Marigold and Zacatlaxcalli) are characterized by the presence of flavonoids and so, it is clear the presence of these two important bands in all the spectra (the band at 220-270 nm might be due to the low sensitivity of the detector at short wavelength). Also, the spectra of morin previously presented are easily compared to that of Fustic. There is a hipsochromic shift of these peaks related to those of morin, but this could be indicator of the presence of other species such as kaempferol.
Other important bands at 400-415 nm and 515-525 nm are described as Buti D. [3] as justifying the reddish and orange color of some speciemens. In fact these bands are only present in Fustic, Orange Cosmos and Zacatlaxcalli. These correlates the statement that the difference in color between Orange Cosmos and Yellow Cosmos is due to minor unidentified components, while the difference between Orange and Yellow Marigold might be due to different amounts of components.
Zacatlaxcalli is characterized by a main band at 400 nm which has not been identified. It does not coincide with any reflectance maxima of quercetin, kaempferol or isorhamnetin. Orange Cosmos presents small bands at 330 and 400 nm which can be attributed to the bands 324 and 399 nm of luteolin [32], visible also on the reflectance spectrum of Yellow Cosmos. Orange and Yellow Marigold both present a main peak at ≈375 nm that can be atribuited to patuletin. However, as Buti D. [3] found, both Marigold don’t present the three main peaks at 430-470 nm of the carotenoid lutein, reported in literature as its main component. The addition of clay created a bathochromic shift of all the main peaks in all the dyes. See Annex 2 for the reflectance database created for the samples.
3.2.2.2.UV-vis emission spectroscopy
Chlorophyll is clearly present is some of the dyestuff similarly to Annatto. In fact, both Marigold and Zacatlaxcalli show a sharp emission around 680 nm (see Annex 2). It is important to state that Buti D. [3] didn’t identify chlorophyll in any of the real case studies, but it is necessary to take into account its propensity to degrade.
21 both Cosmos, Yellow Marigold and Zacatlaxcalli, but it is difficult to ascertain if a chelation does indeed occur. See Annex 2 for the emission spectra of the samples.
3.2.2.3.SERS
Since all the dyestuffs have flavonoids in their composition, the Conventional Raman spectra showed only fluorescence as expected. See Annex 2 for the SERS spectra.
SERS spectrum of Fustic is very similar to that of morin. In fact, even the band at 1644 cm-1 that appear in morin with palygorskite is present in Fustic with the same clay. It is to be noted that this band, however, is not present when the dye is added to kaolinite.
Orange and Yellow Cosmos do not present the characteristic bands of luteolin as expected, but instead show significant closeness to the bands report for quercetagetin, found in Marigold. The bands at ≈537, 732, 968 and 1327 cm-1 are reported in literature as belonging to this flavonoid [33]. The bands at ≈460, 400 and 333 cm-1 could be attribuited to butein. In fact, as showed by Buti D. [3], this flavonoid presents three small bands at 472, 407 and 339 cm-1. In fact, the SERS spectra of both Cosmos could be a mixture of characteristic vibrations from these flavonoids. When the clays are added there is a decrease of intensity of the band at 732 cm-1.
Both Orange and Yellow Marigold present bands correspondent to quercetagetin. According to Casanova-González E. et al. [33], the main dye of Tagetes erecta (Marigold) is quercetagetin, and it is possible to find similarities between the SERS spectrum of this study and the present one. In the low wavenumber range it is possible to find an intense band at 732 cm-1, with more intense bands at 537 and 633 cm-1. In the high wavenumber range we find bands at 1132, 1329, 1462 and 1609 cm-1. The attribution of these bands to vibrational characteristics is still to be made. In the contrary to that of Cosmos, the band at 732 cm-1 does not decrease with the addition of clay.
SERS spectrum of Zacatlaxcalli is very similar to SERS spectrum of quercetin, as stated by Buti D. [3]. Also Casanova-González E. et al [33] found while studying Mexican dyestuffs, including Zacatlaxcalli, that the SERS spectrum corresponded to that of quercetin. The band at 417 cm-1 is related to the OH bending on ring C, and at 480 cm-1 there is the in-plane rotation of ring B and also an OH bending of ring C, while at 590 cm-1 there is the in-plane deformation of rings A and B, which is also represented by the band at 732 cm-1. The bands at 1257 and 1457 cm-1 represent an OH, CH in-plane bending, while the band at 1507 cm-1 represents only a CH bending in ring B. Finally, at 1601 cm-1 there is the C=O stretching [34]. Very interesting is the differences between the spectra when a clay is added to the dye. In fact, there is a shift of the band at 480 cm-1, but more importantly, the band at 732 cm-1 completely disappears.
3.2.3. Discussion
22 water in the Reyes-Valerio method has a negative role in the changes in color and shifts in the spectra observed. In fact, in this method, the red shifts of the spectra were visible immediately after adding the clays, and were more notable with palygorskite. This was found to be a problem related to a pH effect. In fact, flavonoids are known to have acidochromic properties.
Some of the compounds found in this work have already been studied in regards to their dependence on pH. Tungjai M. et al. [35] found that in acidic solutions the flavonoid kaempferol has an absorption band between 250 nm to 450 nm with the maximum absorbance at 363 nm, similar to that found by Buti D. [3]. When the pH of solutions was increased, they found that the peak was shifted toward the red end of the spectrum. Jurasekova Z. et al. [36] studied the effect of pH in various flavonoids and found that the UV-Vis spectrum of luteolin showed that a molecular deprotonation occurs. While with low pH there is an intense band at 345 nm, with increasingly higher pH this band decreases and a new band appears at 400 nm. Quercetin was reported to undergo several structural changes under alkaline conditions. This red shift is attributed to the deprotonation of OH groups in the B-ring. In SERS, these alterations are seen in the range of 500-400 cm-1. The bands characteristic of quercetin, at 480 and 417 cm-1 tend to shift with higher pH [36].
This change in pH is responsible for the change in color of the samples. Therefore, it is possible to state that the protonation of the molecule has a very important role in these organic-inorganic hybrids. It is possible to admit that there is not only the original molecule, but various molecules with different states of deprotonation, depending on the pH (table 3.5).
The spectroscopic methods used were useful to distinguish between dyes, e.g. SERS, where it was found that the flavonoids present bands preferentially in the spectral ranges of 1600-1200 and 600-400 cm-1. The band at 700-800 cm-1 seems to appear in all of the spectra as a characteristically vibration of flavonoids: in-plane C–C deformations of rings A and B.
Buti D., in 2012 [3], identified several components by HPLC-DAD which are represented in table 1.1. During his studies with conventional Raman and SERS, however, he found other species, namely a carotenoid (lutein), present in Marigold, not identified by HPLC. In the present study it was not possible to find lutein either by UV-Vis or conventional Raman. The excitation used in the Raman experiment (785 nm) was not the indicated one to identify carotenoids and in this case, the fluorescence of the other flavonoid components would mask the bands of lutein.
23
Table 3.7 – Summary of what was found in this work through the spectroscopic methods employed.
Dye
Spectroscopic study Recipe
UV-Vis SERS and Raman Reyes-Valerio Modified
Zacatlaxcalli carotenoid? quercetin
negative effect in the changes in color and shifts in the spectra due to a pH effect with
palygorskite.
no changes in color if water is not added. With palygorskite,
heating and water-based binders have a
negative role.
Cosmos Orange luteolin quercetagetin
butein Yellow
Annatto bixin bixin
Fustic morin morin
Marigold Orange patuletin quercetagetin
Yellow
Conclusion Palygorskite is not the ideal clay for a MY replica if these dyes are used. In fact, Kaolinite presented the best results even with water-based binders.
3.3.Analysis of the codices
The MOLAB team was able to study three codices conserved in the Apostolic Library of the Vatican (Rome) and belonging to the Borgia group: Codex Borgia, Vaticanus A and B. The in-situ measurements allowed for a better understanding of these beautifull manuscripts. Because the aim of this work is the understanding of the Maya yellow hybrid, it was decided to represent only the data from the yellow measurements.
Table 3.8 – Physical and historical characteristic of the three codices studied in the Vatican library.
Codices Borgia Vaticanus A (3738) Vaticanus B (3773)
Provenance
Probably from the centre of Cholula in the Puebla-Tlaxcala region, XV-XVI century
Probably painted in 1562, being copied from the Telleriano Remensis
Probably from the Puebla-Tlaxcala region, XV-XVI century
Contents Ritual-divinatory book
Vary from
mythological to calendrical.
Ritual-divinatory book
Characteristics
Typical pre-Columbian codex, composed of 16 pieces of animal skin joined to form a whole strip.
Colonial, large
in-folio book,
composed of 102 folios of European paper
Typical pre-Columbian codex, composed of 10 pieces of animal skin joined to form a whole strip.
Preparation Composed of several white
layers White ground layer
Drawing Preparatory drawing
Painting
All pages were painted both sides, except for the first and last, left blank
Most of the pages are painted and contain a lentthy italian text
24 Methodology and spectroscopic characterisation of the codices:
All the codices were analysed by portable instruments such as Mid-Infrared spectroscopy (MIR), conventional Raman, UV-vis spectroscopy and X-ray fluorescence (XRF).
Codex Borgia: Preparation layer composed of gypsum and calcium carbonate. Several of the yellow/orange areas analysed are characterised by such a strong signal from the preparation layer, becoming difficult and sometimes impossible to distinguish any other component by MIR. However, for other areas, inverted bands at around 950, 980 and 1000-1010 cm-1 appeared, indicanting the possible presence of a clay. For the blue areas, the two most intense bands at 1033 and 980 cm-1 corresponding to the stretching mode of the Si-O bond of palygorskite, were successfully identified, probably indicating that this is not the clay present in the yellow areas, or it would have been identified.
Fig 3.8– MIR measurements of Codex Borgia
Codex Vaticanus A: This colonial codex is characterised by the presence of several interventions and repaintings, which makes it difficult to analyse the original materials. In fact, for the yellow areas it was found tin (Sn) with XRF, malachite was found by MIR in the green areas and even Prussian blue and azurite were
identified in the blue areas. Fig 3.9– XRF measurements of Codex Vaticanus A.
Codex Vaticanus B: Original preparation layer composed of calcium carbonate and kaolinite; repainted preparation layer composed of aragonite. A protein component was found which could indicate the presence of a protenaicious binder. Similar to codex Vaticanus A, some areas were repainted, which was indicated for the presence of other materials, such as Prussian blue.
Fig 3.10– UV-vis measurements of Codex Vaticanus B.
25 Fig. 3.11– Spectral properties of the yellow areas analysed from Codex Borgia: a) MIR in the 7000-500
cm-1 region; b) MIR in the 2000-500 cm-1 region; c) emission (λexc= 375 nm).
Fig. 3.12– Spectral properties of the orange areas analysed from Codex Borgia: a) MIR in the 7000-500 cm-1 region; b) emission (λexc= 375 nm).