Munich Personal RePEc Archive
Measuring (socio-)economic systems
using the SNA. A SAM approach.
Santos, Susana
ISEG (School of Economics and Management), UTL
(Technical University of Lisbon), UECE – Research Unit on
Complexity and Economics, DE – Department of Economics
12. August 2011
Online at
http://mpra.ub.uni-muenchen.de/32758/
Measuring (socio-)economic systems using the SNA. A SAM approach.
Susana Santos∗∗∗∗
ISEG (School of Economics and Management)/UTL (Technical University of Lisbon); UECE – Research Unit on Complexity and Economics and DE – Department of Economics
Abstract
A SAM (Social Accounting Matrix) can be an important tool for measuring a society’s activity, underlying which there are systems that can be worked upon in different ways. This tool will be presented as an alternative support for those who intervene in the policymaking process, which can be directed towards different parts of those systems.
Both numerical and algebraic versions of the SAM will be referred to, while the method to be used in constructing the former from the System of National Accounts (SNA), implemented by the United Nations, will be examined. The SAM’s basic structure and consistency within the whole system will be studied, as well as any possible disaggregations, extensions, aggregates, indicators and balances that can be calculated. Other aspects beyond that basic structure will also be examined.
Key words: Social Accounting Matrix; National Accounts;
JEL classification: C82; E01; E61
(August 2011)
∗ Rua Miguel Lupi, 20, 1249-078 Lisboa, Portugal ([email protected]).
Contents
1. Introduction ... 1
2. The SAM-based approach ... 1
3. Constructing numerical versions of SAMs from the SNA. An application to Portugal ... 3
3.1. The SAM’s basic structure and its consistency with the whole system ... 4
3.2. Disaggregations and extensions ... 12
3.2.1.Production and trade accounts ... 12
3.2.2.Institutions and Rest of the World accounts ... 13
3.3. Aggregates, indicators and balances ... 16
3.4. Examples of policy-type questions that can be addressed using SAMs ... 21
4. Going beyond the basic structure ... 25
5. Concluding remarks ... 26
1. Introduction
In this paper, the Social Accounting Matrix (SAM) will be presented as a tool for measuring a society’s activity, underlying which there are systems that can be worked upon in different ways. Thus, the SAM will be presented as an alternative support for those who intervene in the policy decision process, which can be directed towards different parts of those systems.
Adopting a conceptual framework based on the works of Graham Pyatt and his associates, Section 2 specifies the main features of the SAM-based approach, according to which the SAM can describe a society’s activity either empirically or theoretically, depending on whether it is presented in a numerical or an algebraic version, respectively.
Accompanied by an application to Portugal, Section 3 provides some methodological details regarding the construction of numerical versions of SAMs, adopting the national accounts based on the United Nations System of National Accounts (SNA) as the base source of information. Different possibilities of analysis, provided by aggregates, indicators and balances that can be calculated from such versions, will precede two examples of policy-type questions that can be addressed using the same tool.
Section 4 examines certain aspects that lie outside the basic structure, which were presented in the previous section.
The concluding remarks, presented in Section 5, systematise the main ideas of the other sections in order to show that, since countries have national accounts based on the SNA, they can use SAMs to approach (socio-)economic systems and support policy decision processes.
2.The SAM-based approach
Richard Stone and Graham Pyatt played a key role in the implementation of the SAM-based approach. Both worked on the conceptual details of that approach: the former worked more in numerical terms, within the framework of a system of national accounts, while the latter worked more in algebraic terms, mainly within the scope of input-output analysis. Their work has been decisive for understanding the importance of the SAM as a measurement tool.
construction of which “it may be possible to adopt a hierarchical approach, first adjusting the entries in a summary set of national accounts and then adjusting subsets of estimates to these controlling totals.” (Pyatt and Roe, 1977: xix, xxiii).
In turn, in the abstract to his article, “A SAM approach to modeling”, Graham Pyatt says: “Given that there is an accounting system corresponding to every economic model, it is useful to make the accounts explicit in the form of a SAM. Such a matrix can be used as the framework for a consistent dataset and for the representation of theory in what is called its transaction form.” In that transaction form (or TV (transaction value) form), the SAM can be seen ... “as a framework for theory” and its cells...“can be filled instead with algebraic expressions, which describe in conceptual terms how the corresponding transaction values might be determined”. Thus, the SAM is used as “the basic framework for model presentation.” (Pyatt, 1988: 327; 337).
Looking at the question from the perspectives outlined above, it can be said that a SAM can have two versions: a numerical version, which describes the activity of a society empirically; and an algebraic version, which describes that same activity theoretically. In the former version, each cell has a specific numerical value, with the sums of the rows being equal to the sums of the columns. In the latter version, each cell is filled with algebraic expressions that, together with those of all the other cells, form a SAM-based model, the calibration of which involves a replication of the numerical version.
In the words of Graham Pyatt, “the essence of (...) the SAM approach to modelling is to use the same SAM framework for both the empirical and the theoretical description of an economy.” (Pyatt, 1988: 337).
Therefore, supported by the words of Richard Stone quoted above, the national accounts and their underlying system will be adopted, consequently determining the SAM design and guaranteeing the credibility of the available data.
In 1953, with the first and most fundamental contribution written by that same author, the United Nations implemented the System of National Accounts (SNA), which continued to be published in successive versions until 2008 (ISWGA, 2008). This system establishes the rules for measuring the activity of countries or groups of countries, which, in turn, have been adopted and adapted to specific realities by the corresponding statistical offices.
The construction of algebraic versions can be seen, among others, in: Pyatt (2001; 1988), Pyatt and Roe, (1977), Pyatt and Round (1985), Santos (2010; 2009).
3. Constructing numerical versions of SAMs from the SNA. An application to Portugal.
The latest versions of the SNA have devoted a number of paragraphs to discussing the question of SAMs. The 2008 version mentions SAMs in Section D of Chapter 28, entitled “Input-output and other matrix-based analysis” (ISWGA, 2008: 519-522), in which a matrix representation is presented of the accounts identified and described in the whole SNA. This representation is not to be identified with the SAM presented in this paper, although they both cover all the transactions recorded by those accounts. The SAM that will be presented below results from the work that the author has undertaken within a conceptual framework based on the works of Graham Pyatt and his associates (Pyatt, 1988 and 1991; Pyatt and Roe, 1977; Pyatt and Round, 1985) and from the efforts made to reconcile that framework with what has been defined by (the successive versions of) the SNA (Pyatt, 1985 and 1991a; Round, 2003).
Working within the framework of the European System of National and Regional Accounts in the European Community of 1995 (the adaptation for Europe of the 1993 version of the SNA), Santos (2007) makes an application to Portugal at an aggregate level, explaining the main differences between these two matrices. Pyatt (1999) and Round (2003) also approach this same issue. Because the general differences between the accounts identified and described in the 1993 and 2008 versions of the SNA are not significant, this analysis still remains valid. It is also valid for the application to Portugal in 2007, presented in the following subsections.
Thus, following on from what was said above, a square matrix will be worked upon, in which the sum of the rows is equal to the corresponding sum of the columns. As is conventionally accepted, resources, incomes, receipts or changes in liabilities and net worth will be represented in the entries made in the rows, while uses, outlays, expenditures or changes in assets will be represented in the entries made in the columns. Each transaction will therefore be recorded only once, in a cell of its own.
3.1.The SAM’s basic structure and its consistency with the whole system
Adopting the working method recommended by Richard Stone in the second paragraph of Section 2 of this paper, the basic structure for the SAM presented here will be a summary set of the national accounts and the controlling totals for the other levels of disaggregation. Thus, besides a rest of the world account, the SAM will include both production and trade accounts and institutional accounts.
In keeping with what has been said above, the design of the SAM will, on the one hand, follow the conceptual framework of the works of Graham Pyatt and his associates and, on the other hand, will adhere to the conventions and nomenclature defined by the SNA.
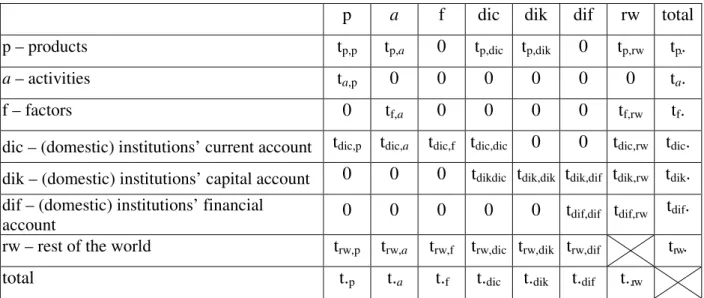
Table 1 shows the above-mentioned basic structure, representing nominal transactions (“t”) with which two indexes are associated. The location of these transactions in the matrix framework is described by those indexes, the first of which represents the row account and the second the column account. Each cell of this matrix will be converted into a submatrix, with the number of rows and columns corresponding to the level of disaggregation of the row and column accounts.
Table 1. The basic SAM
p a f dic dik dif rw total
p – products tp,p tp,a 0 tp,dic tp,dik 0 tp,rw tp..
a – activities ta,p 0 0 0 0 0 0 ta .
f – factors 0 tf,a 0 0 0 0 tf,rw tf .
dic – (domestic) institutions’ current account tdic,p tdic,a tdic,f tdic,dic 0 0 tdic,rw tdic. dik – (domestic) institutions’ capital account 0 0 0 tdikdic tdik,dik tdik,dif tdik,rw tdik. dif – (domestic) institutions’ financial
account 0 0 0 0 0 tdif,dif tdif,rw t
dif.
rw – rest of the world trw,p trw,a trw,f trw,dic trw,dik trw,dif trw.
total t.p t.a t.f t.dic t.dik t.dif t..rw
Sources: Santos (2010).
Note: The first three accounts (p = products, a = activities and f = factors (of production)) are the production and trade accounts of the economy and the next three accounts (dic = current; dik = capital; dif = financial) are the accounts of the (domestic) institutions. The last account (rw = rest of the world) represents the “outside” part of the (domestic) economy.
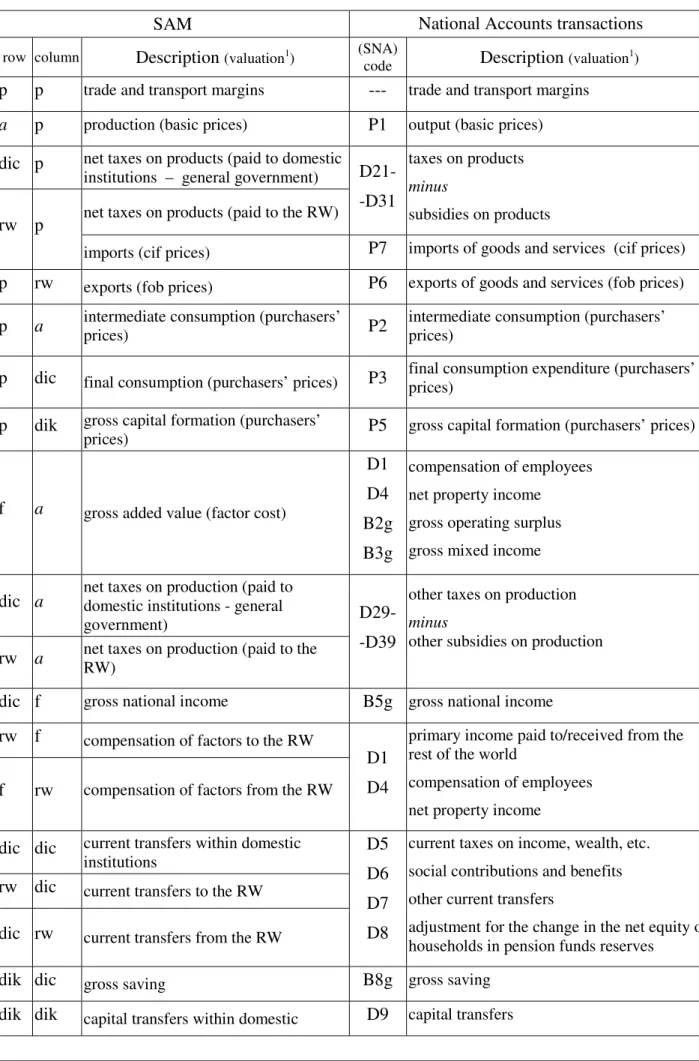
Table 2. The National Accounts transactions in the cells of the basic SAM
SAM National Accounts transactions
row column Description (valuation1) (SNA) code Description (valuation1)
p p trade and transport margins --- trade and transport margins
a p production (basic prices) P1 output (basic prices)
dic p net taxes on products (paid to domestic
institutions – general government) D21-
-D31
taxes on products
minus
subsidies on products
rw p net taxes on products (paid to the RW)
imports (cif prices) P7 imports of goods and services (cif prices)
p rw exports (fob prices) P6 exports of goods and services (fob prices)
p a intermediate consumption (purchasers’
prices) P2
intermediate consumption (purchasers’ prices)
p dic final consumption (purchasers’ prices) P3 final consumption expenditure (purchasers’
prices)
p dik gross capital formation (purchasers’
prices) P5 gross capital formation (purchasers’ prices)
f a gross added value (factor cost)
D1 D4 B2g B3g
compensation of employees
net property income
gross operating surplus
gross mixed income
dic a net taxes on production (paid to domestic institutions - general
government) D29-
-D39
other taxes on production
minus
other subsidies on production
rw a net taxes on production (paid to the
RW)
dic f gross national income B5g gross national income
rw f compensation of factors to the RW
D1 D4
primary income paid to/received from the rest of the world
compensation of employees
net property income
f rw compensation of factors from the RW
dic dic current transfers within domestic
institutions
D5 D6 D7 D8
current taxes on income, wealth, etc.
social contributions and benefits
other current transfers
adjustment for the change in the net equity of households in pension funds reserves
rw dic current transfers to the RW
dic rw current transfers from the RW
dik dic gross saving B8g gross saving
SAM National Accounts transactions
row column Description (valuation1) (SNA)
code Description (valuation
1
)
institutions
dik rw capital transfers from the RW
rw dik capital transfers to the RW
dik dif - net lending/borrowing (see k) in de
description of the SAM blocks) B9 net lending/borrowing
dif dif financial transactions within domestic
institutions F1 F2 F3 F4 F5 F6 F7
monetary gold and special drawing rights (SDRs)
currency and deposits
securities other than shares
loans
shares and other equity
insurance technical reserves
other accounts receivable/payable
rw dif financial transactions to the RW
dif rw financial transactions from the RW
p total aggregate demand row sum of the p account’s cells (see above)
total p aggregate supply column sum of the p account’s cells (see above)
a total production value P1 output (basic prices)
total a total costs column sum of the a account’s cells (see above)
f total
aggregate factors income
row sum of the f account’s cells (see above)
total f column sum of the f account’s cells (see above)
dic total
aggregate income
row sum of the dic account’s cells (see above)
total dic column sum of the dic account’s cells (see above)
dik total investment funds row sum of the dik account’s cells (see above)
total dik aggregate investment column sum of the dik account’s cells (see above)
dif total
total financial transactions
row sum of the dif account’s cells (see above)
total dif column sum of the dif account’s cells (see above)
rw total transactions value to the rest of the
world row sum of the rw account’s cells (see above)
total rw transactions value from the rest of the
world column sum of the rw account’s cells (see above)
Source: Santos (2010).
Outline 1: The nominal flows between the accounts of the basic SAM
DOMESTIC ECONOMY
Source: Santos (2009: 6)
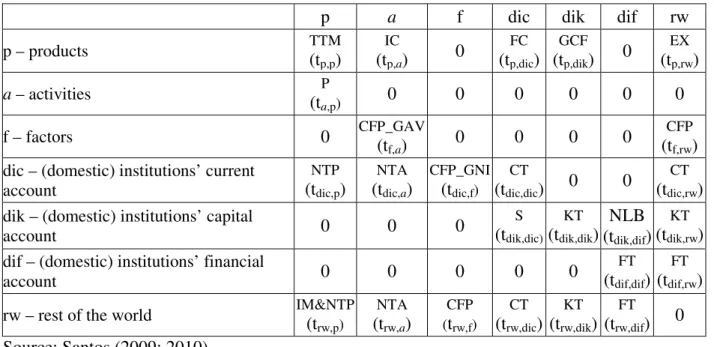
The SAM blocks, identified in Table 3, are submatrices or sets of submatrices with common characteristics. The specification of these blocks will be made below and involves an identification of the transactions of the National Accounts.
P rod u ct ion an d T rad
e Factors of Production Activities
Current Account
Capital Account
Gross Saving
REST OF THE WORLD
In st it u ti on s Capital Transfers Gross National Income
net taxes on products
Capital Transfers Current
Transfers Current
Transfers Financial Account Financial Transactions Financial Transactions Compensation of Factors Services
trade and transport margins
Products
net taxes on production
Compensation of Factors Services (Gross Added Value)
Imports and net taxes on products (-) Net lending/
borrowing
Exports
net taxes on production
Table 3. The basic SAM by blocks
p a f dic dik dif rw
p – products TTM
(tp,p)
IC
(tp,a) 0
FC
(tp,dic)
GCF
(tp,dik) 0
EX
(tp,rw)
a – activities (tP
a,p) 0 0 0 0 0 0
f – factors 0 CFP_GAV (t
f,a) 0 0 0 0
CFP
(tf,rw) dic – (domestic) institutions’ current
account
NTP
(tdic,p)
NTA
(tdic,a)
CFP_GNI
(tdic,f)
CT
(tdic,dic) 0 0
CT
(tdic,rw) dik – (domestic) institutions’ capital
account 0 0 0
S
(tdik,dic)
KT
(tdik,dik)
NLB (tdik,dif)
KT
(tdik,rw) dif – (domestic) institutions’ financial
account 0 0 0 0 0
FT
(tdif,dif)
FT
(tdif,rw)
rw – rest of the world IM&NTP (t rw,p)
NTA
(trw,a)
CFP (trw,f)
CT
(trw,dic)
KT
(trw,dik)
FT
(trw,dif) 0
Source: Santos (2009; 2010)
Description:
a) Production – P (cell: ta,p) represents the output of goods and services (transaction P1 of the
National Accounts).
b) Domestic Trade is represented by the value of domestically transacted products, which can be either domestically produced or imported.
b.1) Intermediate Consumption – IC (cell: tp,a)consists of the value of the goods and services
consumed as inputs through a process of production, excluding those fixed assets whose consumption is recorded as consumption of fixed capital (transaction P2 of the National Accounts).
b.2) Final Consumption – FC (cell: tp,dic) consists of the expenditure incurred by resident
institutional units on those goods or services that are used for the direct satisfaction of individual needs or wants, or the collective needs of members of the community (transaction P3 of the National Accounts).
b.3) Gross Capital Formation – GCF (cell: tp,dik) includes: gross fixed capital formation
(transaction P51 of the National Accounts), changes in inventories (transaction P52), and acquisitions minus disposals of valuables (transaction P53).
c) External Trade – includes the transactions in goods and services from non-residents to residents, also known as imports (transaction P7 of the National Accounts), or IM (cell: trw,p),
d) Trade and Transport Margins – TTM (cell: tp,p) are realised on goods purchased for resale
and are a part of the production of wholesale trade services, retail trade services and the repair services of motor vehicles, motorcycles and personal and household goods. They amount to zero, since they are negative in relation to the three above-mentioned activities (because the corresponding value has already been recorded in the production submatrix), but are positive and have the same amount in relation to all the other ones.
e) Net indirect taxes or net taxes on production and imports
e.1) Net Taxes on Production – NTA (cells: tdic,a; trw,a) represents the (other) taxes on
production (transaction D29 of the National Accounts) minus the (other) subsidies to production (transaction D39 of the National Accounts).
e.2) Net Taxes on Products – NTP (cells: tdic,p; trw,p) represents the taxes on products
(transaction D21 of the National Accounts) minus the subsidies on products (transaction D31 of the National Accounts).
f) Compensation of factors of production – CFP (cells: tf,a; tdic,f; tf,rw; trw,f) consists of the
income of the institutional sectors originating from the compensation of the services provided through their real and financial assets to the activities of production and to the rest of the world, namely compensation of employees (transaction D1 of the National Accounts) and compensation of own-account assets, including the compensation of employers and/or own-account workers, and of capital, namely property income (transaction D4, balances B2g and B3g of the National Accounts).
g) Current Transfers – CT (cells: tdic,dic; tdic,rw; trw,dic) includes: current taxes on income, wealth,
etc. (transaction D5 of the National Accounts); social contributions (transaction D61); social benefits in cash (transaction D62); other current transfers (transaction D7); and the adjustment made for the change in the net equity of households in pension fund reserves (transaction D8).
h) Capital Transfers – KT (cells: tdik,dik; tdik,rw; trw,dik) includes: capital taxes (transaction D91 of
the National Accounts), investment grants (transaction D92); other capital transfers (transaction D99); and acquisitions less disposals of non-financial non-produced assets (transaction K2)
i) Financial Transactions – FT (cells: tdif,dif; tdif,rw; trw,dif) represents the transactions in financial
securities other than shares; loans; shares and other equity; insurance technical reserves; and other accounts receivable/payable (F1-7 of the National Accounts).
j) Gross Saving – S (cell: tdik,dic)measures the portion of aggregate income that is not used for
final consumption expenditure and current transfers to domestic institutions or to the rest of the world.
k) Net borrowing/lending – NLB (cell: tdik,dif).
The net lending (+) or borrowing (-) of the total economy is the sum of the net lending or borrowing of the institutional sectors. It represents the net resources that the total economy makes available to the rest of the world (if it is positive) or receives from the rest of the world (if it is negative). The net lending (+) or borrowing (-) of the total economy is equal (but with an opposite mathematical sign) to the net borrowing (-) or lending (+) of the rest of the world.
Here, those amounts that fall short of (+) or exceed (-) the investment funds used to cover aggregate investment are recorded in the capital and financial accounts, since they are financial transactions either from the rest of the world (in the case of net borrowing) or to the rest of the world (in the case of net lending). This is why the mathematical signs defined in the first paragraph of this item have been exchanged.
The construction of a SAM is easier when performed by blocks.
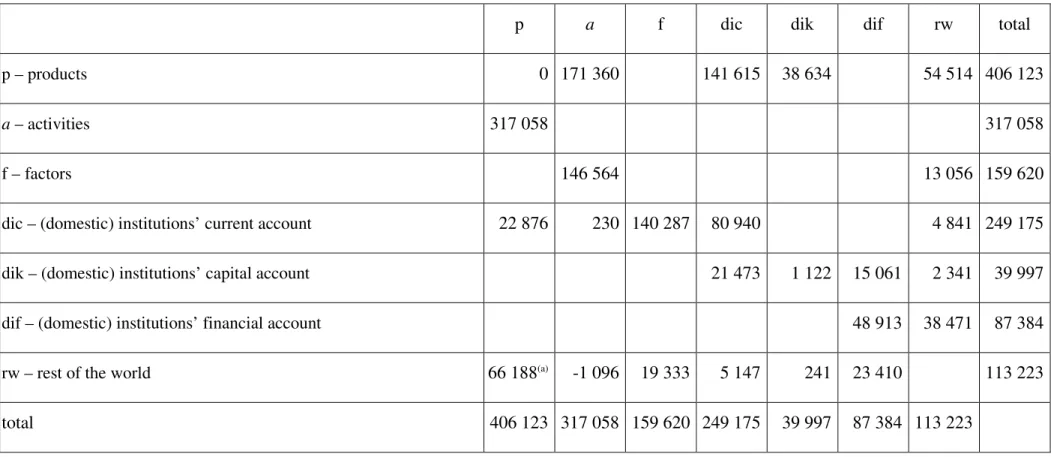
Table 4. Basic SAM of Portugal in 2007 (un: 106 euros)
p a f dic dik dif rw total
p – products 0 171 360 141 615 38 634 54 514 406 123
a – activities 317 058 317 058
f – factors 146 564 13 056 159 620
dic – (domestic) institutions’ current account 22 876 230 140 287 80 940 4 841 249 175
dik – (domestic) institutions’ capital account 21 473 1 122 15 061 2 341 39 997
dif – (domestic) institutions’ financial account 48 913 38 471 87 384
rw – rest of the world 66 188(a) -1 096 19 333 5 147 241 23 410 113 223
total 406 123 317 058 159 620 249 175 39 997 87 384 113 223
Source: Integrated Economic Accounts Table for Portugal in 2007 (Appendix).
Note: Since direct purchases abroad by residents (2 019 * 106 euros) are not expenditures within the domestic economy, they were considered as a current transfer to the rest of the world and were therefore deducted from the final consumption of the households and from imports.
(a)
Therefore, as mentioned above and again using the words of Richard Stone, the basic SAM that has just been described is the most aggregate “summary set of national accounts” and can represent a first level of the intended hierarchical method (approach), with all the controlling totals for the next level of that hierarchy.
3.2. Disaggregations and extensions
Some other levels of the above-mentioned hierarchical method can be identified within the national accounts, providing other controlling totals for greater levels of disaggregation – with or without the use of national accounts.
Thus, with the expected appearance of quarterly national accounts, although these will not be as complete as the annual ones, it will be possible to make some disaggregation in terms of time. Furthermore, disaggregations can be made in terms of space, since regional accounts are also considered. Here, with the same SNA, it is possible to work with regions and countries, either individually or as a group. Round (1994; 1991), for example, experimented with the case of Europe. It would even be possible to think in world terms, if the SAM could be adopted worldwide.
Extensions are also possible, either from the national accounts or from other sources of information. The 2008 SNA dedicates its Chapter 28 to “Satellite accounts and other extensions” (ISWGNA, 20008: 523-544), where the main idea is to serve specific analytical purposes, in a way that is consistent with the central framework, although not fully integrated into it (ISWGNA, 2008: 37-38). In this respect, the author would like to support Steven Keunning and Willem Ruijter’s idea of a “complete data set” which “could be tentatively labelled: a System of Socio-economic Accounts” (Keunning and Ruijter, 1988: 73).
3.2.1. Production and trade accounts
The SNA uses the Central Product Classification (CPC) Version 2 (completed in December 2008) to classify products (ISWGNA, 2008: 19), which are organised into 10 sections, with it being possible to go to the 5th level of disaggregation within each of these.
In turn, the International Standard Industrial Classification of All Economic Activities (ISIC) Revision 4 (officially released in August 2008) is used to classify the activities (ISWGNA, 2008: 20), organised into 23 sections, the disaggregation of which is perfectly consonant with that of the product classification. The Supply and Use Table provides this information, usually at an intermediate level of disaggregation.
As described above, in the characterisation of the block representing the compensation of factors of production, the possible disaggregation from the tables of the national accounts is between labour (or the compensation of employees) and what the author called the compensation of own-account assets, which includes the compensation of employers and/or own-account workers, and the compensation of capital, namely property income. Such information can only be derived from the Integrated Economic Accounts Table if the products and activities accounts are not disaggregated or from the Supply and Use Table if those accounts are disaggregated. Table 5, which contains the above-mentioned application to Portugal, in which the products and activities accounts are not disaggregated, presents the possible disaggregation of the factors of production accounts based on the Integrated Economic Accounts Table (in Appendix).
The extensions for tourism and health are presented by the SNA as examples of satellite accounts (ISWGNA, 2008: 531-534; 538-542).
3.2.2. Institutions and Rest of the World accounts
All the linkages between the domestic economy and the rest of the world, i.e. all the transactions between resident and non-resident units, are recorded both in the SAM and in the SNA through the rest of the world account (Santos, 2007).
Chapter 4 of the 2008 SNA specifies the institutional sectors, including the rest of the world, and their possible disaggregation, which in some cases can be taken as far as the third level (ISWGNA, 2008: 61-85), although normally it cannot be taken beyond the first level. In the case of the rest of the world, such disaggregation will certainly depend on the country, or group of countries, that adopt and adapt this system.
At the first level of disaggregation, the accounts of the institutions, as well as the rest of the world account, are part of the Integrated Economic Accounts Table. Higher levels of disaggregation, whenever these are possible, are usually published in separate accounts.
Even at the first level of disaggregation, any work conducted with the institutional sectors requires, in addition to the Integrated Economic Accounts or the Accounts of the Institutions, the so-called “from whom to whom matrices”, which are not normally published, but can be acquired from the national statistical offices. These matrices make it possible to fill in the cells of the submatrices of transactions taking place within domestic institutions, recorded in the above-described blocks of current and capital transfers and financial transactions.
As far as this aspect is concerned, the author would like to underline the importance of the information provided by the possible disaggregations of the financial account, especially in a SAM framework, in which interactions can be identified at many different levels. Regarding this issue, see Roe (2003).
The disaggregation of specific institutional sectors makes it possible to analyse the most diverse aspects of a society’s activity: income distribution, with disaggregated households and factor of production accounts (Santos, 2009, is an example of this); the role of the government and its subsectors, with a disaggregated general government account (Santos, 2004 and 2007a, are other examples); the role of the non-profit institutions serving households, as well as of the non-financial and/or financial corporations, etc. The interaction between production and trade processes and income distribution can also be studied.
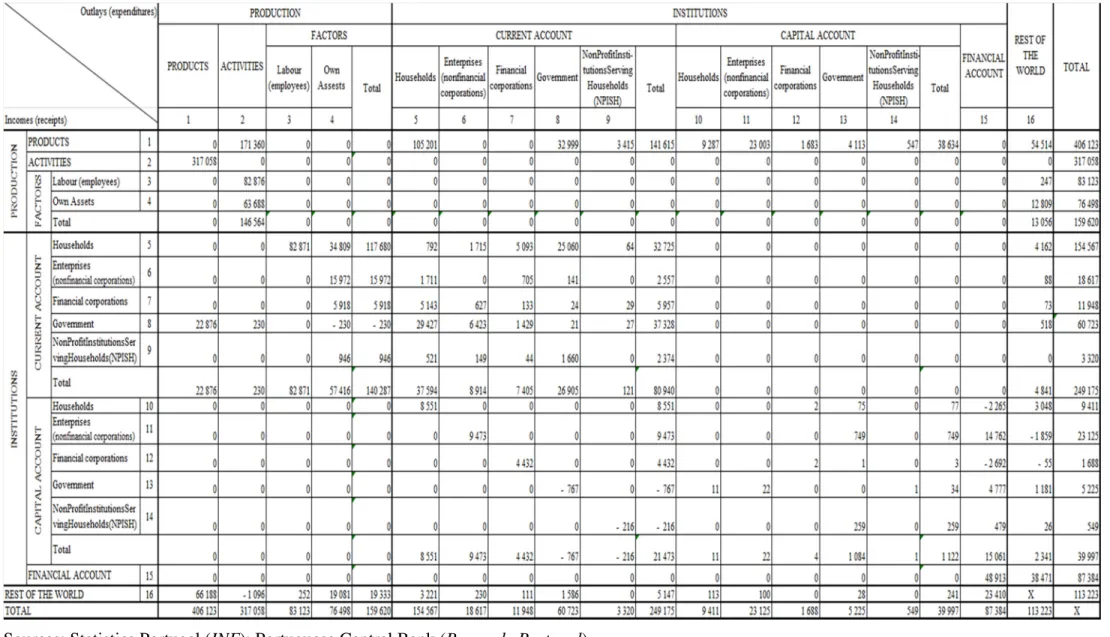
Table 5. SAM of Portugal in 2007 (in millions of euros), with disaggregated factors of production and the (domestic) institutions’ current and capital accounts (un: 106 euros)
Sources: Statistics Portugal (INE); Portuguese Central Bank (Banco de Portugal)
3.3.Aggregates, indicators and balances
As was seen above, all the transactions of the national accounts are covered by the SAM, so that macroeconomic aggregates, indicators and balances can be identified from it (see the description of the cells or blocks in Tables 1 or 3).
Gross Domestic Product at market prices (GDPpm), which is usually considered the main
macroeconomic aggregate, can be calculated in the three known approaches: - Production approach: GDPpm = P – IC + NTP = ta,p – tp,a + (tdic,p+ (part of) trw,p );
- Expenditure approach: GDPpm = FC + GCF + Ex – IM = tp,dic + tp,dik + tp,rw – (part of) trw,p;
- Income approach: GDPpm = GAV + NTP + NTA = tf,a + (tdic,p+ (part of) trw,p ) + (tdic,a + trw,a).
The Portuguese GDPpm in 2007 was 168 737 * 106 euros, which can be calculated from these three
approaches as follows:
- Production approach: GDPpm = 317 058 – 171 360 + (22 876 + 163); - Expenditure approach: GDPpm = 141 615 + 38 634 + 54 514 – 66 026; - Income approach: GDPpm = 146 564 + (22 876 + 163) + (230 – 1096).
Domestic Product can be converted into National Product by adding the compensation of factors received from the rest of the world and deducting the compensation of factors and the net indirect taxes (on both products and production) sent to the rest of the world. Thus, from the described cells of the basic SAM, GDPpm can be converted into Gross National Product at market prices (GNPpm)
or Gross National Income (GNIpm), as follows: GDPpm + tf,rw – trw,f – trw,a– (part of) trw,p. On the other
hand, as the SAM directly provides Gross National Income at factor cost, this can also be calculated just by adding the net indirect taxes (on both products and production) received by domestic institutions: tdic,f + tdic,p + tdic,a. The corresponding amount for Portugal in 2007 is 163 394 * 106
euros, for which the underlying calculations are as follows: GNPpm= 168 737 + 13 056 – (19 333 –
1096 + 163); GNIpm= 140 287 + 22 876 + 230.
In turn, Gross aggregates can be converted into Net aggregates (and balances) by deducting the consumption of the fixed capital (transaction K1 of the National Accounts, which lies outside the basic SAM, as will be seen in Section 3.4, but is part of the Integrated Economic Accounts)
Disposable Income (Domestic or National; Gross or Net) is also very important and can be calculated by adding to GNIpm the net current transfers received by domestic institutions: GNIpm +
((received)tdic,dic+ tdic,rw) – ((paid) tdic,dic+ trw,dic). In our application: 163 394 + (80 940 + 4 841) –
Gross Saving (S) and Net Lending or Borrowing (NLB) are given directly by the SAM, through tdik,dic and tdik,dif, respectively, which in the case of Portugal in 2007 are: 21 473 and 15 061 * 106
euros. As explained in Subsection 3.1- k), the last amount represents net borrowing.
The application for Portugal of all the described aggregates can be checked in the Integrated Economic Accounts Table, in the Appendix.
It is also possible to calculate structural indicators of the functional and institutional distribution of generated income, as well as indicators of the use of disposable income.
In the functional distribution of generated income, the distribution of gross added value (at factor cost, GAV) among factors of production is given by the structure of the submatrix in the cell (tf,a) of
the basic structure, with its level of detail depending on the disaggregation of the activities (column account) and of the factors of production (row account). Table 6 shows the results for the application to Portugal.
Table 6. Portuguese functional distribution of the income generated in 2007
(in percentage terms)
% Factors of Production
(generated income = gross added value, at factor cost)
Labour
(employees)
56.5
Own assets
(employers and/or own-account workers; capital)
43.5
Total 100.0
Source: Table 5.
In the institutional distribution of generated income, the distribution of gross national income (at factor cost, GNI) is given by the structure of the submatrix in the cell (tdic,f) of the basic structure. In
Table 7. Portuguese institutional distribution of the income generated in 2007 (in percentage terms)
Factors of Production Labour
(employees)
Own assets
(employers and/or own-account workers; capital)
Total
Institutions
(generated income = gross national income)
Households 100.0 60.6 83.9
Non-financial corporations 27.8 11.4
Financial corporations 10.3 4.2
General government - 0.4 - 0.2
Non-profit institutions serving households 1.6 0.7
Total 100.0 100.0 100.0
Source: Table 5.
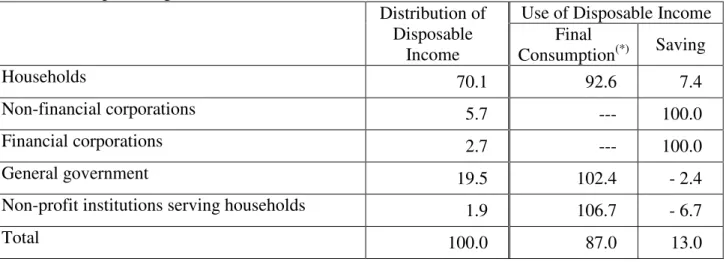
As described above for the whole economy, the disposable income of the institutional sectors can be calculated in the same way, and then its distribution and use can also be studied – see Table 8.
Table 8. Portuguese distribution and use of disposable income among institutions in 2007
(in percentage terms).
Distribution of Disposable
Income
Use of Disposable Income Final
Consumption(*) Saving
Households 70.1 92.6 7.4
Non-financial corporations 5.7 --- 100.0
Financial corporations 2.7 --- 100.0
General government 19.5 102.4 - 2.4
Non-profit institutions serving households 1.9 106.7 - 6.7
Total 100.0 87.0 13.0
Source: Table 5.
(*)
The expenditure (transaction P3 of the national accounts) and not the “actual” final consumption (transaction P4 of
the national accounts), i.e. the amount really spent by each institution, although a part of the final consumption of the
general government and all that of the NPISH will take the form of social transfers in kind (transaction D63 of the
national accounts) and will include the “actual” final consumption of households.
Some additional data can allow for the study of additional details, for instance per capita indicators with demographic information.
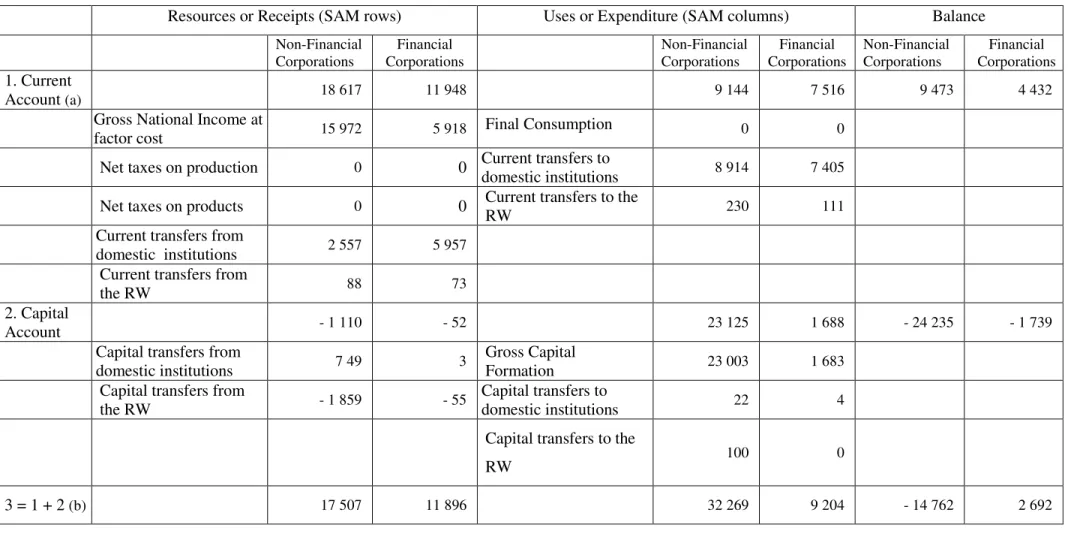
Table 9. Institutional balances of Portuguese Non-Financial and Financial Corporations in 2007 (un: 106 euros)
Resources or Receipts (SAM rows) Uses or Expenditure (SAM columns) Balance
Non-Financial Corporations
Financial Corporations
Non-Financial Corporations
Financial Corporations
Non-Financial Corporations
Financial Corporations 1. Current
Account (a) 18 617 11 948 9 144 7 516 9 473 4 432
Gross National Income at
factor cost 15 972 5 918 Final Consumption 0 0
Net taxes on production 0 0 Current transfers to
domestic institutions 8 914 7 405
Net taxes on products 0 0 Current transfers to the
RW 230 111
Current transfers from
domestic institutions 2 557 5 957
Current transfers from
the RW 88 73
2. Capital
Account - 1 110 - 52 23 125 1 688 - 24 235 - 1 739
Capital transfers from
domestic institutions 7 49 3
Gross Capital
Formation 23 003 1 683
Capital transfers from
the RW - 1 859 - 55
Capital transfers to
domestic institutions 22 4
Capital transfers to the
RW 100 0
3 = 1 + 2 (b) 17 507 11 896 32 269 9 204 - 14 762 2 692
Source: Table 5 (rows/columns 6, 7, 11 and 12)
(a) Balance = Gross saving
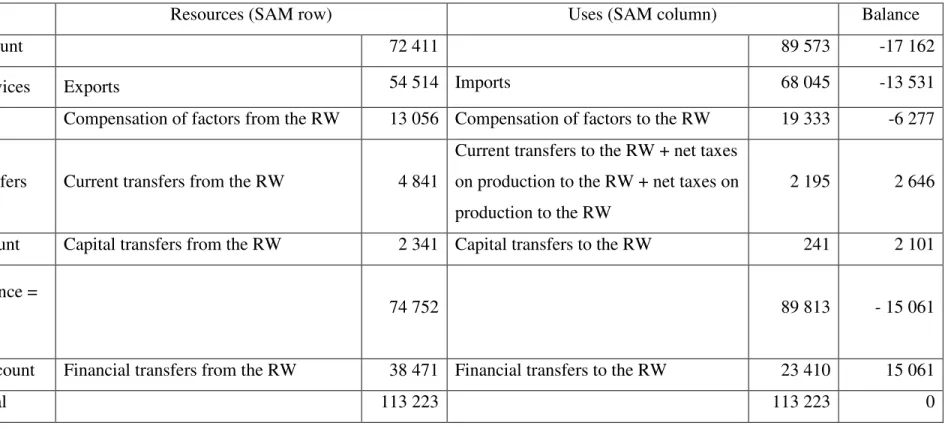
Table 10. Balance of Payments of Portugal in 2007 (un: 106 euros)
Resources (SAM row) Uses (SAM column) Balance
1. Current Account 72 411 89 573 -17 162
- Goods & Services Exports 54 514 Imports 68 045 -13 531 - Income Compensation of factors from the RW 13 056 Compensation of factors to the RW 19 333 -6 277
- Current Transfers Current transfers from the RW 4 841
Current transfers to the RW + net taxes on production to the RW + net taxes on production to the RW
2 195 2 646
2. Capital Account Capital transfers from the RW 2 341 Capital transfers to the RW 241 2 101
3 = 1 + 2 (Balance =
Net borrowing) 74 752 89 813 - 15 061
4. Financial Account Financial transfers from the RW 38 471 Financial transfers to the RW 23 410 15 061
5 = 3 + 4 = Total 113 223 113 223 0
3.4. Examples of policy-type questions that can be addressed using a SAM
From what was seen above, by covering all the representative flows of the measured part of a society’s activity, the SAM can be used to support the policy decision process in several ways, given the flexibility of the described basic structure and the possibilities of specification of various aspects of the underlying systems.
For example, under the scope of the social policy measures, we may want to work with specific flows in which government and households intervene directly, namely the current transfers between them both. Let us consider the case of the direct taxes on income, paid by the households to the government, and the case of the social benefits, paid by the government to the households. The identification of the absolute and relative importance of these flows in the corresponding institutional balances may be a first step. Tables 11 and 12 show the application to Portugal. On the other hand, comparisons with macroeconomic aggregates and some SAM values can complement that knowledge. For instance, in our application, the current taxes on income and wealth, etc., paid by households to the government represent 6.3% of the aggregate income of the former (the row/column total of its current account); or, alternatively, the benefits other than social transfers in kind, paid by the government to the households represent 21.1% of the households’ disposable income.
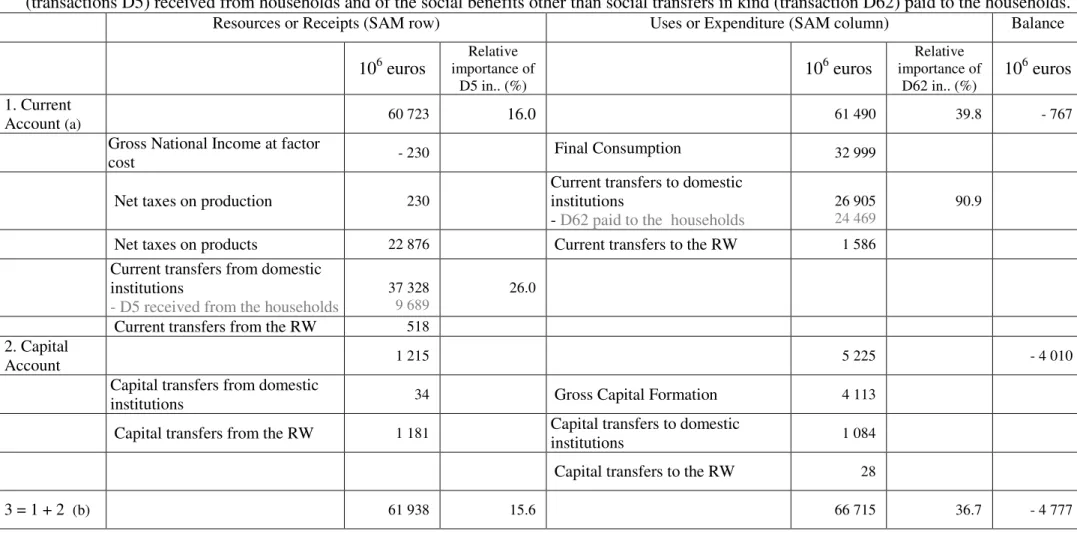
Table 11. Institutional Balance of Portuguese Government in 2007 and the relative importance of the current taxes on income, wealth, etc., (transactions D5) received from households and of the social benefits other than social transfers in kind (transaction D62) paid to the households.
Resources or Receipts (SAM row) Uses or Expenditure (SAM column) Balance
106 euros
Relative importance of
D5 in.. (%)
106 euros
Relative importance of
D62 in.. (%)
106 euros
1. Current
Account (a) 60 723 16.0 61 490 39.8 - 767
Gross National Income at factor
cost - 230 Final Consumption 32 999
Net taxes on production 230
Current transfers to domestic institutions
- D62 paid to the households
26 905
24 469
90.9
Net taxes on products 22 876 Current transfers to the RW 1 586
Current transfers from domestic institutions
- D5 received from the households
37 328
9 689
26.0
Current transfers from the RW 518
2. Capital
Account 1 215 5 225 - 4 010
Capital transfers from domestic
institutions 34 Gross Capital Formation 4 113
Capital transfers from the RW 1 181 Capital transfers to domestic
institutions 1 084
Capital transfers to the RW 28
3 = 1 + 2 (b) 61 938 15.6 66 715 36.7 - 4 777
Source: Table 5 (rows/columns 8 and 13) and “from whom to whom matrices”- Statistics Portugal (INE)
(a) Balance = Gross saving
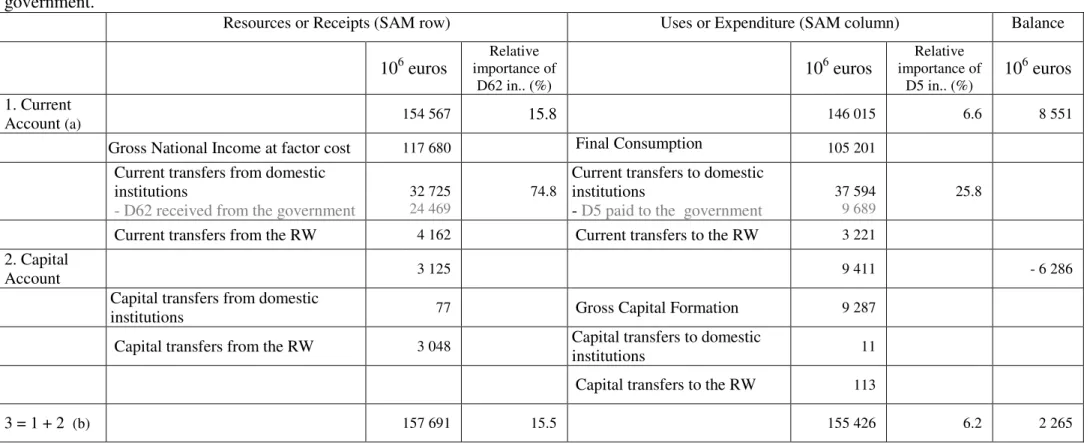
Table 12. Institutional Balance of Portuguese Households in 2007 and the relative importance of the current taxes on income, wealth, etc., (transactions D5) paid to the government and of the social benefits other than social transfers in kind (transaction D62) received from the government.
Resources or Receipts (SAM row) Uses or Expenditure (SAM column) Balance
106 euros
Relative importance of
D62 in.. (%)
106 euros
Relative importance of
D5 in.. (%)
106 euros
1. Current
Account (a) 154 567 15.8 146 015 6.6 8 551
Gross National Income at factor cost 117 680 Final Consumption 105 201
Current transfers from domestic institutions
- D62 received from the government
32 725
24 469
74.8
Current transfers to domestic institutions
- D5 paid to the government
37 594
9 689
25.8
Current transfers from the RW 4 162 Current transfers to the RW 3 221
2. Capital
Account 3 125 9 411 - 6 286
Capital transfers from domestic
institutions 77 Gross Capital Formation 9 287
Capital transfers from the RW 3 048 Capital transfers to domestic
institutions 11
Capital transfers to the RW 113
3 = 1 + 2 (b) 157 691 15.5 155 426 6.2 2 265
Source: Table 5 (rows/columns 5, and 10) and “from whom to whom matrices”- Statistics Portugal (INE)
(a) Balance = Gross saving
4. Going beyond the basic structure
In order to improve the snapshot given by the SAM, as described above, some rearrangements could be made to the described cell contents and/or some zero cells could be filled in. This can be done either within and/or outside the scope of the SNA
a) Within the scope of the SNA, the following topics are examples of rearrangements that could be made to the described cells’ contents (the described cells can be identified in Tables 1 or 3), in order to avoid the existence of negative cells in the SAM. This would help to improve its definition (incomings in rows and outgoings in columns) and facilitate the application of certain balancing methods, whenever necessary.
a.1) Instead of working with net indirect taxes, it is possible to work with taxes and subsidies separately. The taxes on products and on production could be recorded in the above-described NTP (tdic,p; trw,p) and NTA (tdic,a; trw,a) blocks, respectively. The
subsidies on products could be recorded in cells tp,dic and tp,rw. The subsidies on
production would then be recorded in cells ta,dic and ta,rw.
a.2) The net lending or borrowing (NLB), which, in the SAM’s capital account, is considered as a component of investment funds, not required or required to cover aggregate investment, could be recorded in cells tdik,dif, in the case of net borrowing,
and in cells tdif,dik, in the case of net lending. Thus, if there is net borrowing, we have
a financing requirement that is covered by financial transactions (from the rest of the world, since the national funds are not sufficient), i.e. a resource of the capital account (row) and a use of the financial account (column). If there is net lending, we have a financing capacity that will be absorbed by financial transactions (to the rest of the world, since the national funds are in excess), i.e. a resource of the financial account (row) and a use of the capital account (column).
b) Still working within the scope of the SNA, some new data could be considered, either in addition to other data or as possible replacements for these figures.
b.1) The consumption of fixed capital could be included in tp,dik.
b.2) The production of the institutional sectors could be included in tdic,p. In the basic
structure, production is recorded in cells ta,p.
b.3) The intermediate consumption of the institutional sectors could be included in tp,dic. In
the basic structure, intermediate consumption is recorded in cells tp,a.
c) Outside the scope of the SNA, working either within or outside the framework of the satellite accounts, the inclusion of the following aspects could be considered3.
presented by the SNA as an example of satellite accounts (ISWGNA, 2008: 542-543). In this case a possible income in kind could be analysed.
c.2) The consideration of informal aspects of the economy, to which SNA dedicates the Chapter 25 (ISWGNA, 2008: 471-482).
c.3) The (re)analysis of the imputations; the underlying methodologies and possible adjustment.
c.4) Demography and the activity of the population of working age, their time use, skills, etc.
c.5) The rethinking of the way in which the factors of production are worked upon and the possible consideration of natural resources and their relationship with the society’s activity. The extension to environmental accounting is presented by the SNA as an example of satellite accounts (ISWGNA, 2008: 534-538).
c.6) Stocks of capital and wealth.
The author knows that the implementation and study of some of these topics, especially those referred to in subsection c), could become valuable research projects, and that, in fact, some of them are already part of the SNA’s research agenda. However, the aim here is to show that, although the SAM (especially when based on the SNA) is a very complete and credible measurement tool, there is still much that can be done to improve it.
5. Concluding remarks
Together, the United Nations System of National Accounts (SNA) is flexible enough and the Social Accounting Matrix (SAM)-based approach versatile enough to measure the society’s activity with full validity. From that measurement, underlying systems can be identified and worked upon in order to support the policy decision process.
It is proposed that the work on the sectors of production should be undertaken in conjunction with the institutional sectors, using the national accounts as the base source of information. This proposal is based on the particular type of advantage of the SAM represented by “ the emphasis on consistency and the importance of complete articulation, both of which are the essence in trying to understand feedback systems, in general, and the interdependence of the distribution of income and the structure of production, in particular”, identified by Pyatt (1999: 385).
version describes that same activity theoretically. Each cell of the latter version contains algebraic expressions that, together with those of all the other cells, make up a SAM-based model, the calibration of which involves a replication of the numerical version. References for the latter were given and the construction of the former from the SNA was proposed. From that proposal the following possibilities were highlighted:
- Multi-period and dynamic analysis, since national accounts are published regularly.
- Identification of the network of nominal links existing within the (socio-)economic system, allowing for the particularisation of regions, products (goods and services), activities (industries), institutions or sets of institutions (households, enterprises, government), etc.
- Study of the processes of production and trade, as well as, the distribution, redistribution and accumulation of income.
- Evaluation of the impacts of alternative policy measures and the consequent policy decision, i.e. the processes of decision-making and decision-taking.
- Better use of the quantitative information available, since the SNA has developed national accounts that are increasingly consistent and in harmony with all other statistics.
However, both within and outside the scope of the SNA, there are several important aspects that still need to be completed. Some rearrangements can be made to the described cell contents and/or some zero cells can be filled in. Coverage of those aspects would improve the numerical version of the SAM proposed in this paper and the possible algebraic versions derived from it.
By using a SAM-based approach, with a consistent and credible numerical version, as proposed, and a corresponding well-defined algebraic version of a SAM, it will be possible to cover important aspects of a society’s activity and improve the knowledge of the underlying systems. A SAM that is suitably designed to address a specific problem or set of problems can result in a fully interlinked macro-model, which can play an invaluable role, for example, in providing quantitative support in the policy decision process.
References
Keuning S. and Ruijter W. (1988) Guidelines to the construction of a Social Accounting Matrix. Review of Income and Wealth, 34, 71-100.
Pyatt, G. (2001) Some Early Multiplier Models of the Relationship between Income Distribution and Production Structure. Economic Systems Research, 13, 139-163.
Pyatt, G. (1999) Some Relationships between T-Accounts, Input-Output Tables and Social Accounting Matrices. Economic Systems Research, 11, 365-387.
Pyatt, G. (1991) Fundamentals of Social Accounting. Economic Systems Research, 3, 315-341.
Pyatt, G. (1991a) SAMs, the SNA and National Accounting Capabilities. Review of Income and Wealth, 37, 177-198.
Pyatt, G. (1985) Commodity Balances and National Accounts: a SAM Perspective. Review of Income and Wealth, 31, 155-169.
Pyatt, G. (1988) A SAM Approach to Modeling. Journal of Policy Modeling, 10, 327-352.
Pyatt, G. and Roe, A. (1977) Social Accounting for Development Planning with Special Reference to Sri Lanka. (Cambridge-UK, Cambridge University Press).
Pyatt, G. and Round, J. (1985) Accounting and Fixed Price Multipliers in a Social Accounting Matrix Framework. In: G. Pyatt, and J. Round, (coord.), Social Accounting Matrices. A Basis for Planning. A World Bank Symposium, World Bank, 52-69; also in Economic Journal, 89 (356), 1979, 850-873.
Roe. A. (2003) Asymmetries between Rich and Poor Countries in Financial Crisis Responses: the Need for Flow-of-Funds Approach. Economic Systems Research, 15, 233-257.
Round, J. (2003) Constructing SAMs for Development Policy Analysis: Lessons Learned and Challenges Ahead. Economic Systems Research, 15, 161-183.
Round, J. (1994) The Structure of the European Economy: a SAM Perspective. In: J. Round, (ed.), The European Economy in Perspective. Essays in Honour of Edward Nevin. Cardiff, University of wales Press, 59-83.
Round, J. (1991) A SAM for Europe: Problems and Perspectives. Economic Systems Research, 3, 249-268.
RePEc Archive) Paper No. 23676; EERI (Economics and Econometrics Research Institute) RP (Research Papers) 2010/33.
Santos S. (2009), From the System of National Accounts (SNA) to a Social Accounting Matrix (SAM)-Based Model. An Application to Portugal (Coimbra-Portugal, Edições Almedina)
Santos S. (2007) Macro-SAMs for Modelling Purposes. An Application to Portugal in 2003. Working Paper No. 17/2007/ Department of Economics/Research Unit on Complexity and Economics, ISEG-UTL.
Santos S. (2007a) Modelling Economic Circuit Flows in a Social Accounting Matrix Framework. An Application to Portugal. Applied Economics, 39, 1753-1771.
1
In the transactions represented by the cells whose rows and/or columns represent production accounts, as well as in the aggregates and balances that can be calculated from these, as will be seen in Section 3.3, the following types of valuation are identified (regardless of whether one is working with current or constant (price) values): factor cost; basic, cif (cost-insurance-freight included) and fob (free on board) prices; purchasers’ or market prices.
Factor cost represents the compensation of the factors (or the primary incomes due to labour and capital) used in the production process of the domestic economy, excluding taxes on production and imports (taxes on products and other taxes on production) and subsidies (subsidies on products and other subsidies on production). This type of valuation is considered in the SNA (Paragraph 265) to be complementary (ISWGNA, 2008: 22).
When other taxes on production, net of other subsidies on production, are added to the production value of the domestic economy at factor cost, we obtain the basic prices for the production that will be transacted in the domestic market and the fob price level of the part that will be exported. Imports, valued at cif prices, will be added at this level to the unexported part of domestic production to be transacted in the domestic market. Purchasers’ or market prices relate to those products, either domestically produced or imported, that are transacted in the domestic market. Here, the basic/cif prices will be increased by adding to them the trade and transport margins and the taxes net of subsidies on products.
2
In order to be completely consonant with the values of the national accounts, the direct purchases made abroad by the households are not considered here.
3