ScienceDirect
Available online at www.sciencedirect.com
Procedia Computer Science 138 (2018) 33–40
1877-0509 © 2018 The Authors. Published by Elsevier Ltd.
This is an open access article under the CC BY-NC-ND license (https://creativecommons.org/licenses/by-nc-nd/4.0/)
Selection and peer-review under responsibility of the scientific committee of the CENTERIS - International Conference on ENTERprise Information Systems / ProjMAN - International Conference on Project MANagement / HCist - International Conference on Health and Social Care Information Systems and Technologies.
10.1016/j.procs.2018.10.006
10.1016/j.procs.2018.10.006
© 2018 The Authors. Published by Elsevier Ltd.
This is an open access article under the CC BY-NC-ND license (https://creativecommons.org/licenses/by-nc-nd/4.0/)
Selection and peer-review under responsibility of the scientific committee of the CENTERIS - International Conference on ENTERprise Information Systems / ProjMAN - International Conference on Project MANagement / HCist - International Conference on Health and Social Care Information Systems and Technologies.
1877-0509 Available online at www.sciencedirect.com
ScienceDirect
Procedia Computer Science 00 (2018) 000–000www.elsevier.com/locate/procedia
* Corresponding author. Tel.: (+351) 244 830 010.
E-mail address:[email protected]
1877-0509 © 2018 The Authors. Published by Elsevier Ltd.
This is an open access article under the CC BY-NC-ND license (https://creativecommons.org/licenses/by-nc-nd/4.0/)
Selection and peer-review under responsibility of the scientific committee of the CENTERIS - International Conference on ENTERprise Information Systems / ProjMAN - International Conference on Project MANagement / HCist - International Conference on Health and Social Care Information Systems and Technologies.
CENTERIS - International Conference on ENTERprise Information Systems /
ProjMAN - International Conference on Project MANagement / HCist - International
Conference on Health and Social Care Information Systems and Technologies,
CENTERIS/ProjMAN/HCist 2018
Collecting Information about Air Quality using Smartphones
André Pereira
a, Beatriz Patrício
a, Filipa Fonte
a, Sandro Marques
a,*, Catarina I. Reis
b,
Marisa Maximiano
ba School of Technology and Management, Polytechnic Institute of Leiria, Leiria, Portugal
b Centre for Research in Informatics and Communications (CIIC), Polytechnic Institute of Leiria, Leiria, Portugal
Abstract
Nowadays, one of the major public health concerns is the quality of the air that surrounds us and knowing how polluted it might be. To compute the Air Quality Index for a specific geographical site, five pollutants can be considered: particulate matter (PM2.5 and PM10), ground-level Ozone (O3), Nitrogen dioxide (NO2) and Sulphur dioxide (SO2). If we consider the data from both atmospheric conditions and the existence of catastrophic events, we will be able to cross it with existing data from sensor nodes (gathering air pollutants' data) in order to accomplish a more detailed understanding of the current air quality in a specific area. Our solution introduces a differentiating factor: the concept of turning every smartphone into a dynamic sensor node that can be used to actively contribute to the centralized platform that gathers all the data from the sensor nodes. This feature enables citizens to play a significant and empowering role regarding healthcare conditions. The proposed system integrates several modules including a Custom Delivery Solution (CDS), and, as an alternative, an out-of-the-box solution named ThingSpeak. Both solutions offer a service delivery system to the mobile app that presents the latest data to the users and allows them to submit their own data.
© 2018 The Authors. Published by Elsevier Ltd.
This is an open access article under the CC BY-NC-ND license (https://creativecommons.org/licenses/by-nc-nd/4.0/) Selection and peer-review under responsibility of the scientific committee of the CENTERIS - International Conference on ENTERprise Information Systems / ProjMAN - International Conference on Project MANagement / HCist - International Conference on Health and Social Care Information Systems and Technologies.
Keywords: android app, air quality index, custom delivery solution, ThingSpeak, citizen empowerment, sensor nodes, GPS, REST API
Available online at www.sciencedirect.com
ScienceDirect
Procedia Computer Science 00 (2018) 000–000www.elsevier.com/locate/procedia
* Corresponding author. Tel.: (+351) 244 830 010.
E-mail address:[email protected]
1877-0509 © 2018 The Authors. Published by Elsevier Ltd.
This is an open access article under the CC BY-NC-ND license (https://creativecommons.org/licenses/by-nc-nd/4.0/)
Selection and peer-review under responsibility of the scientific committee of the CENTERIS - International Conference on ENTERprise Information Systems / ProjMAN - International Conference on Project MANagement / HCist - International Conference on Health and Social Care Information Systems and Technologies.
CENTERIS - International Conference on ENTERprise Information Systems /
ProjMAN - International Conference on Project MANagement / HCist - International
Conference on Health and Social Care Information Systems and Technologies,
CENTERIS/ProjMAN/HCist 2018
Collecting Information about Air Quality using Smartphones
André Pereira
a, Beatriz Patrício
a, Filipa Fonte
a, Sandro Marques
a,*, Catarina I. Reis
b,
Marisa Maximiano
ba School of Technology and Management, Polytechnic Institute of Leiria, Leiria, Portugal
b Centre for Research in Informatics and Communications (CIIC), Polytechnic Institute of Leiria, Leiria, Portugal
Abstract
Nowadays, one of the major public health concerns is the quality of the air that surrounds us and knowing how polluted it might be. To compute the Air Quality Index for a specific geographical site, five pollutants can be considered: particulate matter (PM2.5 and PM10), ground-level Ozone (O3), Nitrogen dioxide (NO2) and Sulphur dioxide (SO2). If we consider the data from both atmospheric conditions and the existence of catastrophic events, we will be able to cross it with existing data from sensor nodes (gathering air pollutants' data) in order to accomplish a more detailed understanding of the current air quality in a specific area. Our solution introduces a differentiating factor: the concept of turning every smartphone into a dynamic sensor node that can be used to actively contribute to the centralized platform that gathers all the data from the sensor nodes. This feature enables citizens to play a significant and empowering role regarding healthcare conditions. The proposed system integrates several modules including a Custom Delivery Solution (CDS), and, as an alternative, an out-of-the-box solution named ThingSpeak. Both solutions offer a service delivery system to the mobile app that presents the latest data to the users and allows them to submit their own data.
© 2018 The Authors. Published by Elsevier Ltd.
This is an open access article under the CC BY-NC-ND license (https://creativecommons.org/licenses/by-nc-nd/4.0/) Selection and peer-review under responsibility of the scientific committee of the CENTERIS - International Conference on ENTERprise Information Systems / ProjMAN - International Conference on Project MANagement / HCist - International Conference on Health and Social Care Information Systems and Technologies.
1. Introduction
Nowadays, the quality of the air that surrounds us, and knowing how polluted it might be, is an actual public health concern [1]. Several health and governmental institutions gather and publish data regarding what is known as Air Quality Index (Air Matters [2]; BreezoMeter [3]; World Air Quality Index [4]; AirVisual [5]). For instance, the European Environment Agency (EEA) and the European Commission (EC) have launched, in 2017, an online platform that “provides information about current air quality situation based on measurements from more than 2000 air quality monitoring stations across Europe” [6]. To compute the index they present, they consider five pollutants: particulate matter (PM2.5 and PM10), ground-level Ozone (O3), Nitrogen dioxide (NO2) and Sulphur dioxide (SO2). The metrics differ from platform to platform and the directives and corresponding legislation show that the index for the quality of the air can be computed using distinct formulas and inclusively distinct pollutants [7].
Most of the current available platforms use the services of static monitoring stations spread across a geographical area [2], [4], [6]. These stations are responsible for collecting values for parameters related to air quality.
Atmospheric conditions like temperature, relative humidity, or air pressure, among others, can be related to air quality data and can be a factor or even be considered a direct cause of the quality of the air. For instance, high temperatures combined with low humidity percentages can be perceived by people as low air quality, despite the amount of pollutants present at the time.
On the other hand, the occurrence of catastrophic events, whether it be from natural or human causes, can be related to the quality of the air in a specific location. A wildfire that is not under control and spreads across a considerable geographical area can have a major impact on the amount of pollutants that are being captured by the stations in that same area.
Therefore, both the data from atmospheric conditions and the existence of catastrophic events can be cross referenced with existing data from conventional stations in order to accomplish a more detailed understanding of the current air quality in a specific area.
Our solution introduces a differentiating factor: the concept of turning every smartphone available in the world into a dynamic station, which can be used to actively contribute to the centralized platform that gathers all the data from the stations. This feature enables common citizens to play a significant and empowering role regarding public health conditions [8]. Smartphones currently have many integrated sensors, namely ambient temperature, relative humidity, among others, and are prone to be used anywhere and at any time by whoever desires to share its data [9]. Additionally, a simple app can be used to further enhance the information to be shared, allowing the introduction of additional details regarding any catastrophic event that might have occurred.
The solution will allow the interaction between mobile devices and a centralized support platform with information made available by numerous environmental sensors. It will be made available to the general public, allowing its users to check information regarding the quality of the air that was captured by all the stations, whether fixed or dynamic.
For the purpose of this solution only some pollutants will be considered, namely: Nitrogen dioxide (NO2), Carbon monoxide (CO) and Ozone (O3). In our scenario, a centralized support platform will mimic gathering the readings of sensor networks, where it is assumed that each sensor node feeds a specific channel (NO2, CO or O3) for a specific location (city).
The proposed solution has two distinct versions: (1) an out-of-the-box central platform that is available in the cloud and gathers available IoT sensor data (ThingSpeak) [10]; and (2) a custom developed central platform that uses several applications that are all interconnected, each one with a specific behavior, that gathers the same information and makes it available online.
The proposed system also includes a mobile application that interacts with a centralized platform and provides a way for users to easily access air quality data from various cities around Portugal, while enabling them to also contribute with additional information.
This paper is organized as follows: in the next section we present the generic architecture of the proposed system solution. Next, we present the implementation details that we considered upon the design and development of the system. Lastly, we provide some conclusions of the work that was done and insights on future directions.
2. System Architecture
The overall architecture of the proposed system is presented in Figure 1. It integrates several modules interconnected by a communication channel infrastructure (CCI) with the aim of providing a Custom Delivery Solution (CDS), and, as an alternative, an out-of-the-box solution named ThingSpeak, as well. Both solutions offer a RESTful Application Programming Interface (API) [11] that acts as a service delivery system to the mobile app, and for other applications that may be integrated in this ecosystem, in the near future (“Other Devices”).
Figure 1. System Architecture
The CDS, through its Data Collector, can handle multiple sensors seamlessly through the use of the publisher/subscriber model [12]. Sensors publish data to the broker, and the other modules retrieve the data and store it in a local database. The Alarm Manager module automatically triggers an alarm in case one of the sensors reaches a specified threshold. The stored data is available publicly through the API.
ThingSpeak is available in the cloud and currently supports a wide diversity of sensors that interact with the central platform using distinct protocols (HTTP, MQTT,…). Both accessing existing data and submitting new data is available through the use of the existing API.
Both delivery solutions can be easily used by the mobile app, as it would only need to rewrite a small section of code to support the different implementations of both APIs. Only one of them is used for each app, but the features they provide can be used in a transparent way by the app.
2.1. Custom Delivery Solution Architecture
The CDS that was developed has an integrated platform that uses a sensors’ network which allows the quality monitoring of the air (Figure 1). The data is read from sensors that are able to remotely transmit this information. A second module allows the customization of trigger conditions for specific air parameters. If some of the air parameter values are not in what is considered as the safety range, an alarm will be triggered to notify the overall systems that the air is not fulfilling the recommended quality parameters defined in the monitoring platform. These trigger conditions are persisted in a configuration file and can be easily shared among instances of other alarm manager applications. The triggered alarms are sent back to the CCI. Therefore, by using the CCI, data can be shared with the remaining modules. All data transmitted over the CCI is stored in a centralized database by the data logger module which segments the data generated from the air sensors and the one generated by the trigger events’ data.
In order to enrich data quality, this air monitoring solution is also prepared to store uncommon events (‘qualitative data’) as well as additional quantitative data, coming from other applications like the mobile app, for instance. As examples, let us consider the temperature has the measured temperature surrounding the user using its
mobile phone, while uncommon events could be, e.g. industrial gas leak, fire, tornado, etc. This ad-hoc information could be useful to explain (or not) temporary high values for specific pollutants (example: wild fire and Carbon monoxide raising).
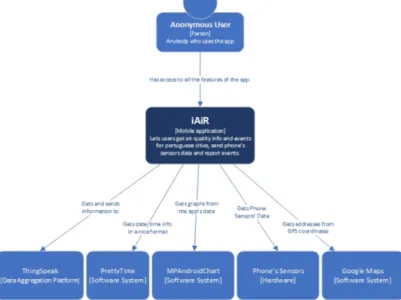
2.2. iAiR Architecture
One of the major goals of the project was the development of a specific client that will consume the data available in the server, using the available API, and, engage in the data collection process, serving as a specific kind of “sensor node”. Thus, and in order to achieve this result, a proof-of-concept was designed and implemented, using the Android platform. The development was directed so that the mobile application that was produced, interacted with the “out-of-the-box” platform (ThingSpeak).
Figure 2 provides the context of the system developed. The central point is the iAiR application that can be used by any user, anonymously, and interacts with several systems. Some of the identified systems are external libraries used to enhance the features provided by the app: PrettyTime [13] is used to format dates in a human-friendly way. And MPAndroidChart [14] to enhance the graphics produced. Other systems relate to internal and specific features that allow the system to benefit from the localization aspects (GPS) of the smartphone and the sensors’ data. Lastly, the interaction with ThingSpeak, the specific delivery solution used for this implementation, is also shown.
Figure 2. Mobile Application Architecture (System Context)
iAiR is divided in five modules, each one with distinct obligations:
● City Manager — synchronizes the retrieval and storage process of available sensor data available for all the cities;
● Sensor Manager — handles the communication to the device sensors: gathering data, presenting that information and submitting it to the platform (quantitative data);
● GPS Manager — handles the communication to the device’s GPS: allowing the user to see and submit information related to her current location;
● Events Manager — handles the free-format text messages that can be submitted about any occurring incident and is integrated into the City Manager: allowing users to also send qualitative data to the platform;
mobile phone, while uncommon events could be, e.g. industrial gas leak, fire, tornado, etc. This ad-hoc information could be useful to explain (or not) temporary high values for specific pollutants (example: wild fire and Carbon monoxide raising).
2.2. iAiR Architecture
One of the major goals of the project was the development of a specific client that will consume the data available in the server, using the available API, and, engage in the data collection process, serving as a specific kind of “sensor node”. Thus, and in order to achieve this result, a proof-of-concept was designed and implemented, using the Android platform. The development was directed so that the mobile application that was produced, interacted with the “out-of-the-box” platform (ThingSpeak).
Figure 2 provides the context of the system developed. The central point is the iAiR application that can be used by any user, anonymously, and interacts with several systems. Some of the identified systems are external libraries used to enhance the features provided by the app: PrettyTime [13] is used to format dates in a human-friendly way. And MPAndroidChart [14] to enhance the graphics produced. Other systems relate to internal and specific features that allow the system to benefit from the localization aspects (GPS) of the smartphone and the sensors’ data. Lastly, the interaction with ThingSpeak, the specific delivery solution used for this implementation, is also shown.
Figure 2. Mobile Application Architecture (System Context)
iAiR is divided in five modules, each one with distinct obligations:
● City Manager — synchronizes the retrieval and storage process of available sensor data available for all the cities;
● Sensor Manager — handles the communication to the device sensors: gathering data, presenting that information and submitting it to the platform (quantitative data);
● GPS Manager — handles the communication to the device’s GPS: allowing the user to see and submit information related to her current location;
● Events Manager — handles the free-format text messages that can be submitted about any occurring incident and is integrated into the City Manager: allowing users to also send qualitative data to the platform;
● Username Manager — ensures and validates that the data sent is linked to a specific username.
3. Implementation details
The solution here presented was designed and implemented during a semester and involved the work of a team of 4 undergraduate students. This interdisciplinary project was shared amongst 2 courses and it was developed with an iterative approach, with two distinct focus: design and implementation of the custom delivery solution and the design and implementation of the mobile app.
Throughout the semester the team followed an agile methodology to elicit the requirements, design a solution, implement it and test it. The methodology was influenced by several well-known methodologies and is commonly used in course’s contexts. While strongly based in Scrum [15], achieving weekly sprints with corresponding initial sprint backlogs and final demo/reviews to stakeholders, it can also be said to use Kanban [16], since a board was used to plan, manage and monitor their work. As far as technical considerations, Extreme Programming [17] was extensively used, since user stories were used to elicit requirements, acceptance tests were defined to complement them and pair programming was mandatory. Further technicalities include establishing a connection between user stories and acceptance tests (issues), and the version control system under use.
A special word of attention to the software tests implemented that allowed for a considerable code coverage and allowed the team to use specific software testing techniques such as Boundary Value Analysis (e.g., to assert that the values of the Air Quality Index were shown correctly) [18].
Next, we present the main features implemented as well as the major concerns and decisions taken upon the implementation phase.
3.1. Custom Delivery Solution (CDS) and the Monitoring Visualization Application
In our scenario, the centralized support platform is integrated with a sensors’ network – a DLL that mimics sensors reading to gather the pollutants’ data. Some sensor nodes, with a unique ID, are periodically reading the three parameters (pollutants) and sending these readings to a sensor network gateway/Hub known as CCI. The information gathered from the sensor is transmitted to the CCI over a component called Broker, or message Broker, using a publish/subscribe messaging pattern. The broker used in this implementation was the Mosquitto [19], in which several channels were configured: one for the data air parameters and the other for the alarms.
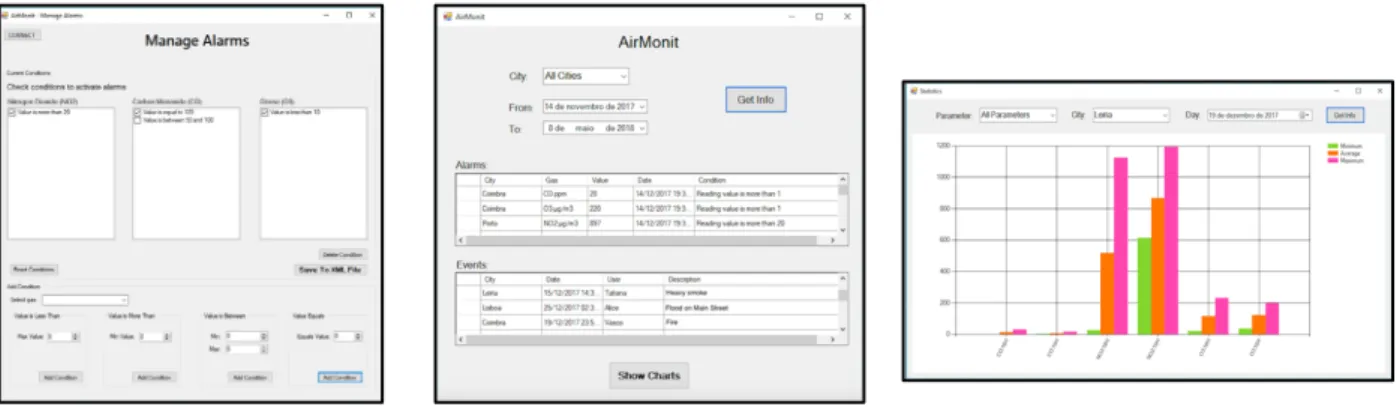
Figure 3. Alarms Module Figure 4. Administration Module Figure 5. Statistical data from the sensor readings
The alarms manager application allows the user to personalize alarm conditions related to air pollutants (Figure 3 and 4). These conditions are persisted in a XML file [20], allowing the sharing of these configuration in an easy and human readable way. This application is a trigger editor in which the user can define and correlate several conditions for the air parameters. The application was developed in such a way as to allow more air parameters to be easily added in the future. Besides having a trigger rule editor, the aim of this application is to trigger an alarm if the condition is not satisfied. When an alarm is triggered it is published to a channel in the CCI (broker).
The Data Logger gathers the data published in the CCI and stores it in the database. They only have to subscribe the data from the broker. In the future, due to this backbone infrastructure, other modules/applications can consume these same data. The REST API allows the communication with the mobile app and other devices (applications) as
well. It controls the communication with the data log repository and the graphic client application, which allows the users to monitor daily and weekly statistics for every air quality parameter being monitored. Although other features were considered, some of the main mandatory services are the following:
● Summarized information (min, max and average values) on an hourly or daily basis, for a parameter on a specific day (or days’ interval), in a city specified by the user or all cities;
● Daily alarms information by city;
● Adding uncommon events and temperature (e.g.: in Leiria city there was a fire today at 12PM, in Lisbon, a gas leak was detected at 3PM, 23º in Coimbra at 2:23PM, etc.).
A monitoring and visualization module (see Figure 5) was implemented so that the platform users could visualize statistical information about the air quality parameters being monitored. This application shows in a friendly user manner:
● If the data will be shown to a specific city or all cities;
● Alarms information that have been triggered between two dates; ● Uncommon events’ data provided by the users;
● Visual statistics of each parameter per day (selected by the user).
3.2. iAiR app
iAiR provides several features that include the option to see the air quality information for a specific city and also the option to submit the device’s sensors data or free-form text qualitative information regarding any occurring incidents.
The initial dashboard of the app provides the last data available for the Nitrogen Dioxide (NO2), Carbon Monoxide (CO) and Ozone (O3) levels of a specific city. It also provides the global index for air quality as qualitative information, computed and indexed according to 3 distinct levels: “Good”, visually displayed as green; “Poor”, visually displayed as red; and “Average”, visually displayed as yellow. As can be seen in Figure 6, the city of Beja is currently with a “Good” air quality global index and the corresponding particle levels. Only the Ozone data is considered to be on an average level.
Figure 6. iAiR Dashboard - Air Quality values for a city Figure 7. City Details including history
iAiR is available offline, caching the basic information (persisting it in a file in the system) and notifying the user that the data available might not be the most recent one. The app resumes and updates the data, upon the detection of an internet connection.
Regarding implementation details, and following the good practices regarding software development and architecture design, we used a Singleton [12] to ensure the centralization of the information in the app and simplify the communication between modules and took into consideration the adequate usage of specific design patterns
already implemented in the Android platform, namely several Adapters (for the graphical user interface components) and the Publisher/Subscriber mechanism inherent to the event/handler that is required to ensure the adequate update of the information that was requested to the platform.
The feature that allows the user to keep a favorite city uses the Android’s Shared Preferences, where the information was stored in a key-value pair fashion.
Another feature that the iAiR app provides is the option to see the chronological data of a specific selected city. Thus, it is possible to see the evolution of the particles’ levels for a specified amount of time (last month, last week, last day, and custom dates entries). Figure 7 presents a line chart with the existing values for the last month in Leiria, but it is possible to see other type charts or specify another timeframe. In this screen, the user can also see the last entries submitted by other smartphones sensors, namely regarding the temperature, besides the available reports of incidents that occurred in the city (e.g., “A fire near the center of the city”). In Figure 7 it is visible the usage of the Pretty Time and MPAndroidChart libraries.
4. Conclusions and Future Work
Nowadays, one of the major public health concerns is the quality of the air that surround us. Using the three pollutants considered to compute the Air Quality Index: ground-level Ozone (O3), Nitrogen dioxide (NO2) and Sulphur dioxide (SO2), and crossing this data with both atmospheric conditions and the existence of catastrophic events, we are able to accomplish a more detailed understanding of the current air quality in a specific geographical area. Our solution introduces a differentiating factor: we turn each smartphone into a dynamic sensor node, that can be used to actively contribute to the centralized platform that gathers all the data from the sensor nodes. This enables citizens to play a significant and empowering role regarding healthcare conditions. The proposed system integrates several modules including a CDS, and, as an alternative, an out-of-the-box solution named ThingSpeak. Both solutions offer a service delivery system to the mobile app that presents the latest data to the users and allows them to submit their own data.
In the future we intend to develop a switch module for the mobile app that allows the app to use the two central platforms’ options, without having to select only one of them exclusively. Another interesting feature will be to enhance the data collection mechanism by allowing the usage of other official services that provide access to the information regarding other countries, besides Portugal.
Acknowledgements
This work is financed by national funds through the FCT - Foundation for Science and Technology, I.P., under project UID/CEC/04524/2016.
References
[1] W. H. Organization, “WHO - Air Pollution.” [Online]. Available: http://who.int/airpollution. [Accessed: 13-May-2018].
[2] S. Bin, Zhang; Jun, Wang; Tao, Zhang and Mengfei, “Air Matters.” [Online]. Available: https://air-matters.com/. [Accessed: 13-May-2018]. [3] BreezoMeter, “BreezoMeter.” [Online]. Available: http://breezometer.com. [Accessed: 13-May-2018].
[4] W. A. Q. I. Team, “World Air Quality Index.” [Online]. Available: http://aqicn.org/city/beijing. [5] IQAir, “AirVisual.” [Online]. Available: https://airvisual.com. [Accessed: 13-May-2018].
[6] European Environment Agency, “European Air Quality Index.” [Online]. Available: http://airindex.eea.europa.eu/. [Accessed: 13-May-2018].
[7] AirNow, “International Air Quality.” [Online]. Available: https://www.airnow.gov/index.cfm?action=airnow.international. [Accessed: 13-May-2018].
[8] I. Black and G. White, “Citizen Science, Air Quality, and the Internet of Things,” in Internet of Things and Advanced Application in Healthcare, IGI Global, 2017, p. 32.
[9] “Environment sensors | Android Developers.” [Online]. Available: https://developer.android.com/guide/topics/sensors/sensors_environment. [Accessed: 06-Jul-2018].
[10] ThingSpeak, “IoT Analytics - ThingSpeak Internet of Things.” [Online]. Available: https://thingspeak.com/. [Accessed: 13-May-2018]. [11] L. Richardson, RESTful Web APIs: Services for a Changing World. O’Reilly Media, 2013.
[12] E. Gamma, R. Helm, R. Johnson, and J. Vlissides, Design patterns: elements of. Addison-Wesley, 1994.
[13] ocpsoft, “PrettyTime - Elapsed Timestamp Formatting and Conversion for Java (Social, JSF2) | OCPsoft.” [Online]. Available: http://www.ocpsoft.org/prettytime/. [Accessed: 14-May-2018].
[14] PhilJay, “MPAndroidChart.” [Online]. Available: https://github.com/PhilJay/MPAndroidChart. [Accessed: 14-May-2018]. [15] J. Sutherland and K. Schwaber, “The Scrum guide. the definitive guide to Scrum: The rules of the game,” ScrumGuides.com, 2017. [16] D. J. Anderson, Kanban: successful evolutionary change for your technology business. Blue Hole Press, 2010.
[17] K. Beck and E. Gamma, Extreme programming explained: embrace change. addison-wesley professional, 2000. [18] F. ISTQB, “Foundation Level Syllabus Version 2011,” Int. Softw. Test. Qualif. Board, 2011.
[19] Mosquitto Team, “Eclipse Mosquitto | projects.eclipse.org.” [Online]. Available: https://projects.eclipse.org/projects/technology.mosquitto/who. [Accessed: 14-May-2018]. [20] E. T. Ray, Learning XML. O’Reilly Media, 2001.