www.atmos-chem-phys.net/11/2863/2011/ doi:10.5194/acp-11-2863-2011
© Author(s) 2011. CC Attribution 3.0 License.
Chemistry
and Physics
Long-term analysis of carbon dioxide and methane
column-averaged mole fractions retrieved from SCIAMACHY
O. Schneising, M. Buchwitz, M. Reuter, J. Heymann, H. Bovensmann, and J. P. Burrows
Institute of Environmental Physics (IUP), University of Bremen FB1, Bremen, Germany Received: 22 September 2010 – Published in Atmos. Chem. Phys. Discuss.: 11 November 2010 Revised: 23 March 2011 – Accepted: 24 March 2011 – Published: 28 March 2011
Abstract. Carbon dioxide (CO2) and methane (CH4) are the two most important anthropogenic greenhouse gases contributing to global climate change. SCIAMACHY on-board ENVISAT (launch 2002) was the first and is now with TANSO onboard GOSAT (launch 2009) one of only two satellite instruments currently in space whose measure-ments are sensitive to CO2and CH4concentration changes in the lowest atmospheric layers where the variability due to sources and sinks is largest.
We present long-term SCIAMACHY retrievals (2003– 2009) of column-averaged dry air mole fractions of both gases (denoted XCO2 and XCH4) derived from absorption bands in the near-infrared/shortwave-infrared (NIR/SWIR) spectral region focusing on large-scale features. The sults are obtained using an upgraded version (v2) of the re-trieval algorithm WFM-DOAS including several improve-ments, while simultaneously maintaining its high processing speed. The retrieved mole fractions are compared to global model simulations (CarbonTracker XCO2and TM5 XCH4) being optimised by assimilating highly accurate surface mea-surements from the NOAA/ESRL network and taking the SCIAMACHY averaging kernels into account. The compar-isons address seasonal variations and long-term characteris-tics.
The steady increase of atmospheric carbon dioxide pri-marily caused by the burning of fossil fuels can be clearly observed with SCIAMACHY globally. The retrieved global annual mean XCO2 increase agrees with CarbonTracker within the error bars (1.80±0.13 ppm yr−1 compared to 1.81±0.09 ppm yr−1). The amplitude of the XCO2seasonal cycle as retrieved by SCIAMACHY, which is 4.3±0.2 ppm for the Northern Hemisphere and 1.4±0.2 ppm for the
South-Correspondence to:O. Schneising ([email protected])
ern Hemisphere, is on average about 1 ppm larger than for CarbonTracker.
An investigation of the boreal forest carbon uptake during the growing season via the analysis of longitudinal gradients shows good agreement between SCIAMACHY and Carbon-Tracker concerning the overall magnitude of the gradients and their annual variations. The analysis includes a discus-sion of the relative uptake strengths of the Russian and North American boreal forest regions.
The retrieved XCH4results show that after years of stabil-ity, atmospheric methane has started to rise again in recent years which is consistent with surface measurements. The largest increase is observed for the tropics and northern mid-and high-latitudes amounting to about 7.5±1.5 ppb yr−1 since 2007. Due care has been exercised to minimise the in-fluence of detector degradation on the quantitative estimate of this anomaly.
1 Introduction
is limited by the sparse ground-based measurements with a lack of high-frequency surface observations in continental regions particularly outside North America and Europe re-sulting in large uncertainties (see, e.g., Stephens et al., 2007). However, satellite data, if accurate and precise enough, have the potential to significantly reduce surface flux uncertain-ties (Rayner and O’Brien, 2001; Houweling et al., 2004) by deducing strength and spatiotemporal distribution of the sources and sinks via inverse modelling which is based on fitting the model emissions to the satellite observations. High reduction of regional flux uncertainties additionally re-quires high sensitivity to near-surface greenhouse gas con-centration changes because the variability due to regional sources and sinks is largest in the lowest atmospheric lay-ers. Sensitivity to all altitude levels, including the bound-ary layer, can be achieved using reflected solar radiation in the near-infrared/shortwave-infrared (NIR/SWIR) spec-tral region, whereas measurements of emissions in the ther-mal infrared (TIR) available from, e.g., HIRS/TOVS (Ch´edin et al., 2002, 2003), AIRS (Engelen et al., 2004; Engelen and McNally, 2005; Aumann et al., 2005; Strow et al., 2006; Maddy et al., 2008), IASI (Crevoisier et al., 2009a,b), and TES (Kulawik et al., 2010) are primarily sensitive to middle to upper tropospheric greenhouse gas concentrations. SCIA-MACHY onboard ENVISAT (launch 2002) was the first and is now with TANSO onboard GOSAT (launch 2009) (Yokota et al., 2009) one of only two satellite instruments currently in space which can benefit in this way from NIR/SWIR nadir measurements. Both instruments cover important absorption bands of both gases in this spectral range. Therefore, SCIA-MACHY plays a pioneering role in the relatively new area of greenhouse gas observations from space (Buchwitz et al., 2005a,b, 2006, 2007; Schneising et al., 2008, 2009; Houwel-ing et al., 2005; B¨osch et al., 2006; Barkley et al., 2006a,c,b, 2007; Frankenberg et al., 2005, 2006, 2008a,b). In the case of methane, SCIAMACHY data have already been incor-porated in the modelling of emissions (Bergamaschi et al., 2007, 2009; Bloom et al., 2010).
In this manuscript, long-term global carbon dioxide and methane dry air column-averaged mole fraction data sets from SCIAMACHY derived using Weighting Function Mod-ified DOAS (WFM-DOAS) developed at the University of Bremen are presented and discussed focusing on a com-parison of their long-term behaviour and seasonal variation with model simulations. The analysis constitutes seven years (2003–2009) of greenhouse gas information derived from European Earth observation data improving and extending pre-existing WFM-DOAS retrievals (Schneising et al., 2008, 2009). Recently, another SCIAMACHY multi-year methane data set has been generated independently (Frankenberg et al., 2011).
This manuscript is organised as follows: in Sect. 2 the SCIAMACHY instrument and its measurement principle are introduced and explained. This is followed by a short de-scription of the improved WFM-DOAS retrieval algorithm
in Sect. 3 focusing on the changes compared to the previous version. The new SCIAMACHY long-term carbon dioxide and methane data sets are discussed in Sect. 4 and conclu-sions are given in Sect. 5.
2 The SCIAMACHY instrument
SCIAMACHY, which is a multi-national (Germany, The Netherlands, Belgium) contribution to the European envi-ronmental satellite ENVISAT, is a grating spectrometer that measures reflected, backscattered and transmitted solar radi-ation at moderate spectral resolution (0.2–1.4 nm) (Burrows et al., 1990, 1995; Burrows and Chance, 1991; Bovensmann et al., 1999). The spectral region from 214 nm to 1750 nm is measured in six adjacent channels, and there are two ad-ditional channels covering the regions 1940–2040 and 2265– 2380 nm. Each spectral channel comprises a grating focus-ing optics and a 1024 element monolithic diode array. In addition, SCIAMACHY has 7 broad band channels, the Po-larisation Measurement Devices (PMD), which monitor the upwelling radiation polarised with respect to the instrument plane at high spatial resolution providing sub-pixel informa-tion.
ENVISAT was launched into a sun-synchronous orbit in descending node having an equator crossing time of 10:00 a.m. local time. During every orbit calibration mea-surements are made during the eclipse, followed by a so-lar occultation and limb atmospheric measurement. On the Earth’s day side SCIAMACHY performs alternate nadir and limb observations. These measurements can be in-verted to obtain a large number of atmospheric data products (Bovensmann et al., 1999) including the column amounts of CH4, CO2 and O2 which are relevant for this study. As a result of SCIAMACHY’s observation of greenhouse gas overtone absorptions in the near-infrared/shortwave infrared (NIR/SWIR) solar backscattered spectrum, SCIAMACHY yields the vertical columns of CO2and CH4with high sen-sitivity down to the Earth’s surface (Buchwitz et al., 2005a). As the integration time for the detectors is optimised around an orbit, the horizontal resolution of the nadir measurements depends on orbital position and spectral interval, but is typi-cally 60 km across track by 30 km along track for the spectral fitting windows used in this study.
2005; Buchwitz et al., 2005b). The WFM-DOAS results pre-sented in this manuscript have been derived using CO2 and CH4 absorption features in channel 6 (1000–1750 nm) and the O2A-band absorption in channel 4 (605–805 nm) which are not affected by an ice-layer as their detectors operate at higher temperatures. However, channel 6+ which is used for the methane retrievals suffers from an increasing number of dead and bad detector pixels including so-called random tele-graph detector pixels which unpredictably jump between at least two quasi-stable dark signal levels (Lichtenberg et al., 2006; Frankenberg et al., 2011).
3 WFM-DOAS retrieval algorithm
The retrieval of a long-lived and therefore relatively well-mixed gas such as carbon dioxide or methane is challeng-ing as only the small variations on top of a large background yield information on its surface sources and sinks. Thefore, the retrieval algorithm has to meet the conflicting re-quirements of accuracy and speed in order to process the large amounts of data produced by SCIAMACHY. This is achieved by the WFM-DOAS retrieval technique (Buchwitz et al., 2000, 2005a,b; Buchwitz and Burrows, 2004) devel-oped at the University of Bremen for the retrieval of trace gases and optimised for CO2, CH4 and O2 retrievals using a fast look-up table (LUT) scheme to avoid computation-ally expensive online radiative transfer calculations. The al-gorithm has been described in detail elsewhere (Buchwitz et al., 2000, 2005a,b; Buchwitz and Burrows, 2004; Schneis-ing et al., 2008, 2009). We therefore focus on a discussion of the main differences between the current versions 2.0 and 2.1, which have been used to generate the data sets discussed in this manuscript, and the previous version 1.0 (Schneising et al., 2008, 2009). The version 2.1 differs from 2.0 in the ad-ditional usage of the SCIAMACHY M-factors in the Level 0-1b processing to compensate for the radiometric degradation of the instrument (Bramstedt, 2008). An M-factor is defined as the ratio between a measured solar spectrum at timet to a reference spectrum obtained for the same optical path at timet0. The M-factors are multiplicative factors to the abso-lute radiometric calibration of SCIAMACHY.
3.1 Retrieval of carbon dioxide mole fractions
In order to convert the retrieved CO2columns into column-averaged mole fractions the CO2columns are divided by the dry-air columns obtained from the simultaneously measured O2 columns obtained from the O2 A-band. The specific changes compared to WFMDv1.0 (Schneising et al., 2008) are:
– Use of spectra with improved calibration: Level 1 ver-sion 6 instead of verver-sion 5 including application of M-factors in the Level 0-1b processing.
– Use of improved spectroscopy: HITRAN 2008 (Roth-man et al., 2009) instead of HITRAN 2004 (Roth(Roth-man et al., 2005).
– Modified static detector pixel mask.
– Use of an improved look-up table scheme, i.e., use of an extended set of surface elevations (0 km, 1 km, 2 km, 3 km, 4 km, 5 km) and albedos (0.01, 0.03, 0.1, 0.3, 0.6, 1.0) covering all naturally occurring surface types by means of interpolation.
– Use of a more realistic standard aerosol scenario in the forward model (OPAC background scenario described in Schneising et al., 2008, 2009).
– Processing of a longer time series: 2003–2009 instead of 2003–2005.
– Use of SCIAMACHY Absorbing Aerosol Index v4.1 (Tilstra et al., 2007) instead of EarthProbe/TOMS AAI (Herman et al., 1997) to filter strongly aerosol contami-nated scenes, in particular desert dust storms.
– Change of full width at half maximum (FWHM) used for the O2 reference spectra calculation from 0.45 nm to 0.44 nm because of the associated improvement of fit quality. The effect of changing the O2FWHM is a re-duction in the retrieved column amount by about 0.5%. Due to small throughput losses of the detectors which are slowly increasing with time exhibiting different character-istics in the two spectral channels used for the CO2 (chan-nel 6) and O2(channel 4) column retrievals, the application of the SCIAMACHY M-factors to compensate for detector degradation ensures better XCO2 results concerning long-term behaviour, e.g., for the retrieved mean annual carbon dioxide growth rate. Without the consideration of the M-factors the XCO2growth rate would be biased low by a few tenths of 1 ppm. According to this conclusion, all carbon dioxide results presented in this manuscript are retrieved with WFMDv2.1. The seasonal cycle amplitude of the northern hemisphere is not affected by the M-factors, whereas the am-plitude in the southern hemisphere is about 0.3 ppm smaller when compensating for the radiometric degradation of the instrument.
The single ground pixel retrieval precision derived from averaging daily standard deviations of the retrieved XCO2 (Schneising et al., 2008) for 8 locations distributed around the globe provides a consistent estimate of the single mea-surement precision of about 6 ppm, respectively, which cor-responds approximately to 1.5%.
3.2 Retrieval of methane mole fractions
Fig. 1.Pixel masks used for the WFMDv2.0 methane retrieval. The red line shows the CH4absorption and the shaded regions indicate bad pixels. Due to proceeding detector degradation in the spectral range used for the methane column retrieval three different time pe-riods are used. Since November 2005 only one remaining detector pixel (#896) in the Q-branch (the spectral region where the strongest absorption occurs) of the 2ν3methane band is useable.
CO2 columns correcting for CO2variability using Carbon-Tracker. CO2is used as a proxy for the air column instead of O2because of better cancellation of path length related re-trieval errors. The specific changes compared to WFMDv1.0 (Schneising et al., 2009) are:
– Use of spectra with improved calibration: Level 1 ver-sion 6 instead of verver-sion 5.
– Use of improved spectroscopy: HITRAN 2008 (Roth-man et al., 2009) plus Jenouvrier et al., 2007 H2O up-date in the methane fitting window instead of HITRAN 2004 (Rothman et al., 2005).
– Modified static detector pixel masks for three different time periods to get best possible results for the early years and stability until end of 2009 at the same time (see Fig. 1).
– Use of an improved look-up table scheme, i.e., use of an extended set of surface elevations (0 km, 1 km, 2 km, 3 km, 4 km, 5 km) and albedos (0.01, 0.03, 0.1, 0.3, 0.6, 1.0) covering all naturally occurring surface types by means of interpolation.
– Use of a more realistic standard aerosol scenario in the forward model (OPAC background scenario described in Schneising et al., 2008, 2009).
– Processing of a longer time series: 2003–2009 instead of 2003–2005.
– Optimisation of filter criteria.
– Use of CarbonTracker version 2010 instead of 2007 (Pe-ters et al., 2007, 2010) to correct the retrieved methane mole fractions for CO2variability.
Due to proceeding detector degradation in the spectral range used for the methane column retrieval, static detec-tor pixel masks for three different time periods (see Fig. 1) are used to get best possible results for the early years and stability until end of 2009 at the same time. Since Novem-ber 2005 only one remaining detector pixel in the Q-branch of the 2ν3methane band, which is the spectral region in the fitting window where the strongest absorption occurs, is use-able. Therefore, the retrieval results since November 2005 are expected to be of reduced quality with regard to noise compared to the prior time period where more Q-branch de-tector pixels are available. Because of the increase of dead or bad pixels, the filter criteria have to be changed for data after October 2005 (third period) because the availability of con-siderably fewer detector pixels automatically increases the fit error. Therefore the filter criterion on the CH4column fit er-ror is relaxed for the third period to get a comparable amount of retrievals classified as good. The quality filtering for this period is additionally extended to restrict to land only scenes and to filter out cloud contaminated scenes with a threshold algorithm like in the case of XCO2 based on sub-pixel in-formation provided by the SCIAMACHY Polarisation Mea-surement Device (PMD) channel A covering the spectral re-gion 310–365 nm in the UV.
As the CH4and CO2columns used for the computation of the column-averaged mole fractions XCH4are both retrieved from neighbouring fitting windows in the same channel, long-term throughput loss issues adversely affecting XCH4 (as in the case of XCO2) are only expected to a minor extent because potential effects on the column growth rates cancel out to first order when computing the CH4/CO2-ratio due to similar radiometric degradation in both windows. Therefore, and because of possible complications due to the relatively large number of dead or bad detector pixels in the methane fitting window, which could introduce additional uncertain-ties in the M-factor calculation, e.g., due to random telegraph pixels (see Sect. 2 and discussion below), the M-factor ap-proach is omitted for XCH4.
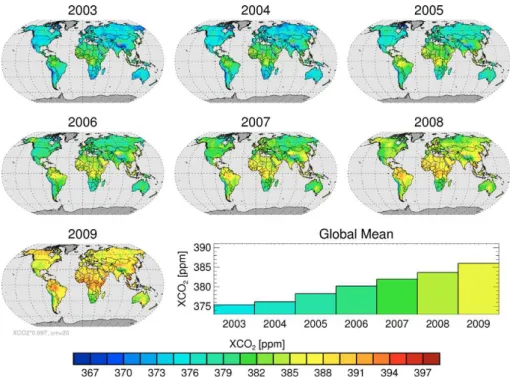
Fig. 2.Annual composite averages of quality filtered WFMDv2.1 XCO2for the years 2003–2009. Also shown are the corresponding global means demonstrating the steady increase of the retrieved carbon dioxide with time. The standard error on the global means is about 0.01 ppm. This estimate is confirmed by a bootstrapping technique.
mole fractions that are too high or too low, although the fits are still good. Therefore, a filtering solely based on fit residuals cannot exclude affected measurements. To exclude corresponding orbits in the post-processing a threshold fil-ter based on the absolute retrieved mole fractions has been implemented. If the mean of all retrieval results of one or more states in an orbit is less than 1600 ppb or greater than 1900 ppb, all measurements of this orbit are flagged bad. As desired, this approach only filters orbits exhibiting systemat-ically too high or too low values because the threshold test is performed on the entire state and not on the single measure-ment. This filter is complemented by excluding remaining outlier orbits by visual inspection. However, over 90% of all eventually filtered outlier orbits are already detected by the automated state-based threshold algorithm. The correspond-ing data product after filtercorrespond-ing is denoted by WFMDv2.0.2 with which all methane results presented here are derived.
The single ground pixel retrieval precision derived from averaging daily standard deviations of the retrieved XCH4 (Schneising et al., 2009) for 8 locations distributed around the globe provides a consistent estimate of the single mea-surement precision of about 30 ppb before November 2005 (70 ppb afterwards), respectively, which corresponds approx-imately to 1.7% (4%).
4 Discussion of results
All SCIAMACHY spectra (Level 1b version 6 converted to Level 1c by the ESA SciaL1C tool using the standard cal-ibration) for the years 2003–2009 which have been made available by ESA/DLR, have been processed using the im-proved retrieval algorithm WFM-DOAS version 2.0/2.1. The respective carbon dioxide and methane results are discussed separately in the following subsections.
4.1 Carbon dioxide
Fig. 3. Comparison of the SCIAMACHY (black) and Carbon-Tracker (red) XCO2 for the Northern Hemisphere (top) and the Southern Hemisphere (bottom) based on monthly means (coloured circles). The standard error on the SCIAMACHY monthly means is less than 0.1 ppm. The saturated solid lines have been smoothed using a four-month Hann window (which has a similar frequency response to a two-month boxcar filter but better attenuation of high frequencies). The pale solid lines represent the correspond-ing deseasonalised trends derived uscorrespond-ing a 12-month runncorrespond-ing mean. Shown below are the derivatives of these deseasonalised curves corresponding to the current increase at the considered point in time. Also noted are yearly mean values of the derivatives (in pale colours) as well as the mean value of the whole time period on the right hand side.
4.1.1 Growth rate and seasonal cycle
To examine the increase with time and the seasonal cycle more quantitatively the SCIAMACHY results are compared to the CarbonTracker release 2010 assimilation system (Pe-ters et al., 2007, 2010) based on monthly data. The Car-bonTracker XCO2 fields as used for this study have been sampled in space and time as the SCIAMACHY satellite in-strument measures. The SCIAMACHY altitude sensitivity has been taken into account by applying the SCIAMACHY CO2 column averaging kernels (Buchwitz et al., 2005a) to the CarbonTracker CO2 vertical profiles. For comparisons
Table 1.Mean amplitude of seasonal cycle and annual increase for SCIAMACHY and CarbonTracker XCO2for the two hemispheres and other latitude bands (see main text for details).
Mean amplitude Annual increase Latitude band seasonal cycle [ppm yr−1]
[ppm]
SCIA CT SCIA CT
Global 2.8±0.2 1.7±0.1 1.80±0.13 1.81±0.09 NH 4.3±0.2 3.0±0.1 1.82±0.16 1.79±0.12 SH 1.4±0.2 0.9±0.1 1.74±0.19 1.83±0.07 30◦N–90◦N 4.9±0.1 3.5±0.1 1.90±0.20 1.74±0.13 30◦S–30◦N 1.3±0.2 0.7±0.1 1.74±0.14 1.84±0.08 30◦S–90◦S 1.5±0.3 0.7±0.1 1.88±0.27 1.84±0.06
with CarbonTracker the SCIAMACHY CO2data have been scaled by a constant factor of 0.997 to compensate for a small systematic bias between the two data sets. As can be seen in Fig. 3, the continuous increase with time on both hemispheres is consistent with CarbonTracker. The an-nual mean increase agrees with the model simulations within the error bars, namely about 1.8±0.2 ppm yr−1 compared to 1.8±0.1 ppm yr−1, respectively (see also Table 1 and the corresponding discussion below). Results of the first half of 2003 are not shown in this figure due to changes of the instrument settings, e.g., detector temperatures and field of view (shift of nadir centre position and change of total scan width), during the first third of 2003. These changes poten-tially introduce small offsets in the data adversely affecting this particular quantitative analysis with impact until midyear because of the smoothing window used.
the presence of thin cirrus clouds (Reuter et al., 2010). This is achieved by including selected cloud parameters in the state vector. These findings indicate that cirrus can in principle also be considered explicitly in the future in a look-up ta-ble approach, even though it is not trivial to achieve suffi-cient processing speed for a global long-term analysis like the one presented in this manuscript. Although cloud pa-rameters are not included in the state vector of the current WFM-DOAS version, the influence of subvisual cirrus on the retrievals is minimised resulting in much better agree-ment with CarbonTracker compared to the previous WFM-DOAS version especially in the Southern Hemisphere. The achieved reduction of the amplitude of the seasonal cycle is presumably a consequence of the interaction of the more re-alistic default aerosol scenario, the application of M-factors in the calibration, improved spectroscopy, and the change-over to the SCIAMACHY Absorbing Aerosol Index. We find that for both hemispheres the mean amplitude of the re-trieved seasonal cycle is on average about 1 ppm larger than for CarbonTracker deriving 4.3±0.2 ppm for the Northern Hemisphere and 1.4±0.2 ppm for the Southern Hemisphere from the SCIAMACHY data (see Table 1). In contrast to the growth rates, the seasonal cycle amplitude differences between SCIAMACHY and CarbonTracker are significant. The less pronounced seasonal cycle of CarbonTracker com-pared to the satellite data might be explainable to some ex-tent by a too low net ecosystem exchange (NEE) between the atmosphere and the terrestrial biosphere; for example Yang et al., 2007 estimate that NEE in the Northern Hemisphere is about 25% larger than predicted by the CASA (Carnegie-Ames Stanford Approach) biogeochemical model which is also used in CarbonTracker. This underestimation is of the same order of magnitude as the scaling needed to fit the am-plitude of the northern hemispheric seasonal cycle of Car-bonTracker to SCIAMACHY (≈38%, see Fig. 4). On the other hand, it cannot be completely excluded that undetected seasonally varying thin cirrus clouds might also contribute to some extent to the observed differences in the seasonal cycle amplitudes because the seasonal cycle of the differences is somewhat similar in the Northern and Southern Hemisphere (see Fig. 5).
The exact values of mean annual increase and amplitudes of the seasonal cycle for both data sets and for both hemi-spheres as well as for several other latitude bands are sum-marised in Table 1. The stated increase is derived from the derivative of the deseasonalised trend as shown in Fig. 3 aver-aged over the whole time period and the associated uncertain-ties are estimated by a bootstrapping technique calculating twice the standard deviation of a set of growth rates obtained by random sampling of the original growth rate time series with replacement. Both data sets agree within their error bars regarding annual atmospheric carbon dioxide increase. According to NOAA/ESRL (http://www.esrl.noaa.gov/gmd/ ccgg/trends/) the average annual mean global carbon dioxide growth rate of marine surface sites which are assimilated in
Fig. 4.Least-squares fit of CarbonTracker to SCIAMACHY XCO2 for the Northern Hemisphere after subtraction of the deseasonalised trend with a scaling factor as fit parameter showing that an up-scaling of 38% is needed to fit the amplitude of the seasonal cycle of CarbonTracker to SCIAMACHY.
Fig. 5. Difference of the smoothed SCIAMACHY and Carbon-Tracker XCO2of Fig. 3 for both hemispheres.
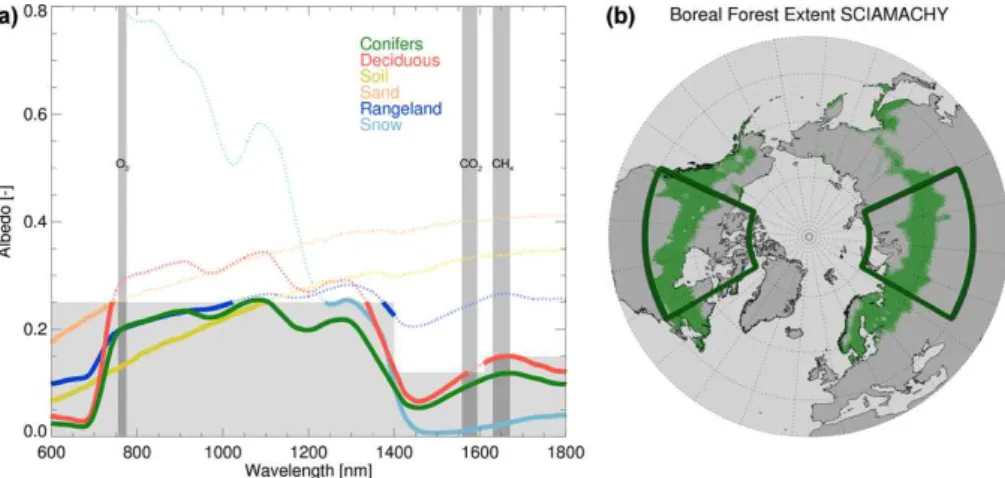
Fig. 6.Selection of the regions for the boreal forest carbon dioxide uptake analysis. The global conifer distribution can be extracted using specific thresholds on the retrieved albedos in the three WFM-DOAS fitting windows (O2, CO2, and CH4). The fitting windows, used thresholds, and spectral albedos of typical natural land surface types (reproduced from the ASTER Spectral Library through the courtesy of the Jet Propulsion Laboratory, California Institute of Technology, Pasadena, California (©1999, California Institute of Technology) and the Digital Spectral Library 06 of the US Geological Survey) are shown in(a)demonstrating that only conifers pass the three window spectral albedo threshold filter. The deduced boreal forest extent is illustrated in(b). The highlighted region is used for the following analysis because it covers the bulk of the boreal forest area of the planet and the individual parts are equally sized and span the same latitude range ensuring similar solar zenith angles for the corresponding SCIAMACHY measurements.
The mean amplitude of the seasonal cycle is obtained by subtracting the deseasonalised trend from the smoothed curve and averaging the resulting amplitudes for all available years denoting the standard deviation as error. The amplitude of the seasonal cycle of the SCIAMACHY data is increasing in the Northern Hemisphere with higher latitudes in good qualitative agreement with CarbonTracker. Quantitatively, the differences of the amplitude values of the mid- and high-latitudes (30◦–90◦) and the whole hemisphere are consistent for the SCIAMACHY and CarbonTracker data amounting to about 0.5 ppm for the Northern Hemisphere. The absolute differences in the amplitudes of the retrieved and modelled seasonal cycle are on the order of 0.5–1.5 ppm for all speci-fied zonal averages.
4.1.2 Boreal carbon uptake
Another related aspect we analysed is the boreal forest car-bon uptake during the growing season and its local partition-ing between North America and Eurasia. To this end, we studied longitudinal gradients of atmospheric carbon diox-ide during May–August (the period between the maximum and minimum of the seasonal cycle), which are the basic sig-nals to infer regional fluxes, using the region motivated in Fig. 6 consisting of equally sized regions in North America and Russia covering the bulk of the boreal forest area of the planet. When an air parcel flows over the boreal forest, more and more carbon is steadily taken up by the growing vege-tation leading to a gradient parallel to wind direction with smaller values at the endpoint compared to the starting point. Due to the fact that the prevailing wind direction in mid- to
high-latitudes is from west to east, one would expect a nega-tive west-to-east longitudinal gradient for the considered re-gion because the air masses are mainly moving according to this wind direction over the uptake region. The absolute val-ues of the derived gradients depend on the actual fine struc-ture of the wind fields (temporary deviations from the pre-vailing wind direction).
Fig. 7.Linear fits of the west-to-east longitudinal gradients of sea-sonally averaged (May–August) SCIAMACHY (black) and Car-bonTracker (red) XCO2 during 2003–2008 for (a)North Amer-ica and(b)Russia weighted according to the standard deviations (shaded areas) of the meridional averages (0.5◦bins). The associ-ated errors are derived from the square root of the covariance of the linear fit parameter.
The longitudinal gradients and their errors for the individ-ual years are illustrated in Fig. 8. As expected, most of the gradients are negative. Taking the error bars into account the only significant positive longitudinal gradient occurs 2003 in Russia. Interestingly, this is true for SCIAMACHY and CarbonTracker indicating that there actually might have been something special in this region in this year. This could be potentially linked to the special meteorological situation dur-ing 2003 with one of the hottest summers on record in Eu-rope. The gradients derived from SCIAMACHY and Car-bonTracker show very similar inter-annual variations. The absolute values of the gradients are in good agreement for the combined North American and Russian boreal forest re-gion (Fig. 8a). For North America (Fig. 8b) the gradients observed by SCIAMACHY are systematically larger (more negative) compared to CarbonTracker. However, both data sets agree within their error bars. For Russia (Fig. 8c) the single-year gradients also agree within their error bars but the observed gradients are systematically smaller (less
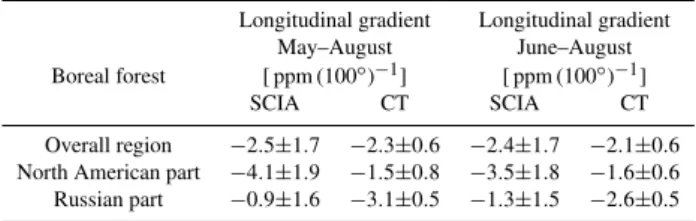
neg-Table 2. West-to-east longitudinal gradients of 2003–2008 XCO2 during the growing season (May–August) for the regions of Fig. 6. Also shown are the corresponding gradients for the shorter time pe-riod June–August minimising uncertainties due to potential regional timing errors in the onset of the forest uptake in the CASA model.
Longitudinal gradient Longitudinal gradient May–August June–August Boreal forest [ ppm (100◦)−1] [ ppm (100◦)−1]
SCIA CT SCIA CT
Overall region −2.5±1.7 −2.3±0.6 −2.4±1.7 −2.1±0.6 North American part −4.1±1.9 −1.5±0.8 −3.5±1.8 −1.6±0.6 Russian part −0.9±1.6 −3.1±0.5 −1.3±1.5 −2.6±0.5
ative) compared to CarbonTracker. Thus, the satellite data suggest a stronger North American boreal forest CO2uptake than CarbonTracker and a weaker Russian boreal forest CO2 uptake. There is no obvious reason for assuming that this indication concerning the regional partitioning of the longi-tudinal gradients is affected by potential biases of the satel-lite data: errors caused by light path variations or residual spectroscopic errors (Schneising et al., 2008) are expected to have only a minor effect on the inferred gradients over these regions because the observations are taken at similar solar zenith angles and surface albedos and because the gradients do not depend on the absolute values of the retrieved XCO2 but only on regional differences.
The suggested difference between CarbonTracker and SCIAMACHY concerning the relative strengths of the Rus-sian and North American boreal forest uptake might be linked to the recent finding of Keppel-Aleks et al., 2010 that modified CASA flux strengths and timings of the sea-sonal cycle introduce differences in corresponding gradients. Therefore, a potential regional timing error in the onset of the forest uptake in the CASA model might contribute to the difference between CarbonTracker and SCIAMACHY ob-served here. This potential contribution to the differences can be minimised by averaging over shorter time periods starting later. Actually, the restriction to June–August reduces the differences between CarbonTracker and SCIAMACHY con-cerning the relative regional uptake strengths to some extent and the gradients agree within error bars in all regions (see Table 2) indicating that regional timing uncertainties in the onset of the boreal forest uptake in the CASA model can con-tribute to the observed differences of the longitudinal gradi-ents. This result is consistent with Keppel-Aleks et al., 2010. However, the qualitative findings concerning regional parti-tioning remain the same.
Fig. 8. Annual west-to-east longitudinal XCO2 gradients from SCIAMACHY (black) and CarbonTracker (red) for boreal forests during the growing season to infer the corresponding carbon diox-ide uptake of the terrestrial biosphere. The examined boreal forest region is composed of the two equally sized regions in North Amer-ica and Russia shown in green which was motivated in Fig. 6. The gradients and associated errors are illustrated for(a)the overall re-gion (mean of the partial rere-gions) and(b)the North American and (c)Russian part individually.
CarbonTracker data. However, Fig. 10 shows using the ex-ample of North America that there is also a complex curved north-south gradient during the growing season due to trans-port in the atmosphere which makes a direct translation of the differences in the observed partitioning of the longitudi-nal gradients to total flux strength difficult. In this context it has to be noted that linear fits might be insufficient to capture
Fig. 9. Seasonally averaged (May–August) SCIAMACHY (top) and CarbonTracker (bottom) XCO2 during 2003–2008 over the North American boreal forest slice motivated in Fig. 6 showing the spatial pattern during the growing season which leads to the longi-tudinal gradients of Fig. 7a. The middle panel shows the gradients based on the smoothed pattern shown here derived by fitting linear combinations of a Gaussian and a quadratic polynomial.
the more complex structure of the gradients in the latitudi-nal case. Therefore, Fig. 10 shows fits of linear combina-tions of a Gaussian and a quadratic polynomial to the two data sets analogue to Fig. 9. The longitudinal/latitudinal fits of Figs. 9 and 10 for SCIAMACHY and CarbonTracker are highly correlated (r=0.90 in the longitudinal andr=0.99 in the latitudinal case), although SCIAMACHY seems to be more sensitive to changes in the meridional/zonal averages.
4.2 Methane
Fig. 10.Seasonally averaged (May–August) SCIAMACHY (left) and CarbonTracker (right) XCO2during 2003–2008 over North America demonstrating that there is also a complex curved north-south gradient in the atmosphere during the growing season. The corresponding latitudinal gradients derived by fitting linear combinations of a Gaussian and a quadratic polynomial are shown in the middle panel as solid black and red lines together with the standard deviations (shaded regions) of the zonal XCO2averages (0.5◦bins). The dash-dotted pale straight lines are linear fits of the gradients.
Fig. 12. Monthly means of northern hemispheric SCIA-MACHY WFMDv2.0.2 XCH4and corresponding standard devia-tions demonstrating that the scatter since the pixel mask alteration at the end of October 2005 is on average about twice as large. Never-theless, the seasonal cycle of the monthly means can still be clearly observed.
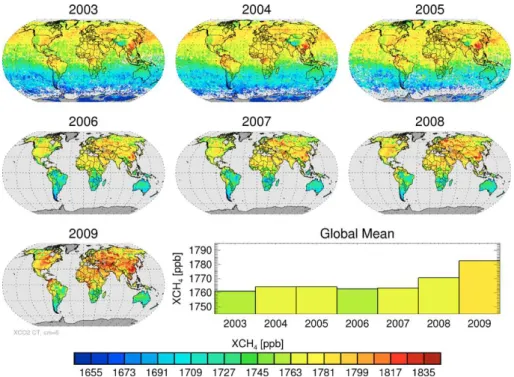
the spectral range used for the methane column retrieval and the corresponding availability of considerably fewer detector pixels the results since November 2005 are of reduced qual-ity manifesting itself in particular by larger scatter. Figure 12 demonstrates using the example of the Northern Hemisphere that the standard deviation of the monthly means since the pixel mask change at the end of October 2005 is on average about twice as large. Nevertheless, the seasonal cycle of the monthly means can still be clearly observed. The pixel mask alteration at the end of October 2005 might potentially also introduce systematic regional biases; e.g., it seems that the tropical enhancement relative to the surrounding areas is less pronounced 2006–2009 compared to 2003–2005 indicating that the magnitude of the retrieved tropical methane enhance-ment not only depends on the used spectroscopic parameters in the forward model (Frankenberg et al., 2008b; Schneis-ing et al., 2009; Bergamaschi et al., 2009) but also on the detector pixel mask used. This is supported by the fact that a reanalysis of a subset of pre-2005 data (November 2004) with the pixel mask from November 2005 provides latitudi-nal averages similar to later years with less methane in the tropics (see Fig. 13). The analysis of the global mean val-ues shows that after years of near-zero growth, atmospheric methane started to increase again in recent years which is qualitatively consistent with the findings of Rigby et al., 2008 and Dlugokencky et al., 2009 for surface methane concentra-tions. In this context it has to be pointed out that a static pixel mask is used for 2006–2009 containing only detector pixels that are not turning dead or bad during this period (accord-ing to the flagg(accord-ing provided by SRON which is available for Orbits until March 2009) to ensure that the observed growth is not artificially introduced by proceeding detector degrada-tion. This is also supported by the fact that the fit quality is stable for the whole considered time period 2003–2009 indi-cating that there are actually no dead or bad detector pixels which are not excluded in the used pixel mask approach.
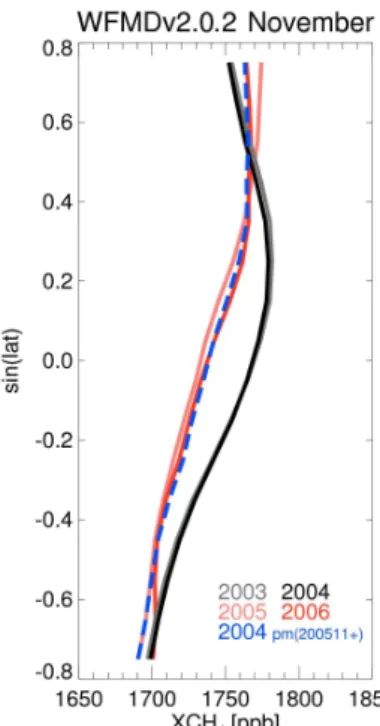
Fig. 13. Reanalysis of a subset of pre-2005 data (November 2004) with the pixel mask since November 2005 (shown in dashed blue) providing monthly latitudinal averages similar to later years with less methane retrieved in the tropics. This suggests that the pixel mask alteration potentially introduces systematic regional biases.
To examine this renewed methane increase in recent years more quantitatively Fig. 14 shows the temporal evolution of retrieved SCIAMACHY methane based on monthly means as well as the corresponding deseasonalised trend and its derivative for both hemispheres analogue to Fig. 3 for carbon dioxide. The already mentioned larger scatter since Novem-ber 2005 due to the decreased numNovem-ber of usable detector pix-els is also observed in the monthly data. This is in particu-lar true for the Southern Hemisphere where the stricter filter criteria accompanying the pixel mask change lead to con-siderably fewer measurements available for the computation of the monthly means because of the additional exclusion of scenes over oceans and the relatively small land mass frac-tion. Nevertheless, the renewed methane growth is visible in Fig. 14 for both hemispheres.
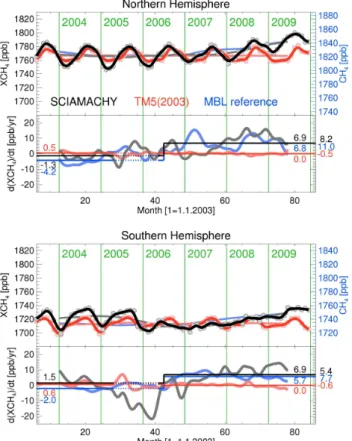
Fig. 14.As Fig. 3 but for WFMDv2.0.2 XCH4. The anomaly (num-bers on the right border) is defined as the difference of the mean values of the derivative of the deseasonalised trend after and before middle of 2006. Values one year around the detector pixel mask al-teration end of October 2005 (indicated by the dotted lines) are not considered because systematic offsets due to the change are poten-tially distorting the deseasonalised trend (obtained by smoothing) and its derivative. As the TM5 model is only available for 2003, the corresponding values are repeated every year to study the am-plitudes of the seasonal cycles and the impact of sampling on the observed anomaly because it is expected to be zero for the repeated model if there is no sampling influence. Hence, the anomaly of the model is a lower bound of the error of the observed SCIAMACHY anomaly. To assess the expected absolute values and temporal evo-lution of the increase at least approximately, the SCIAMACHY data are also compared to the deseasonalised trend of the Marine Boundary Layer reference matrix derived using NOAA/ESRL sur-face measurements averaged over the respective hemisphere (blue). The MBL reference data through 2009 are preliminary.
measurements) of the TM5 model (Krol et al., 2005). Un-fortunately, the TM5 model data set is currently only avail-able for 2003. The corresponding values are repeated ev-ery year to study at least the seasonal behaviour. For this analysis the SCIAMACHY data are scaled with 0.995 to be on the same level as the model data in 2003. The TM5 fields as used for this study have been sampled in space and time as the SCIAMACHY satellite instrument measures. The SCIAMACHY altitude sensitivity has been taken into
account by applying the SCIAMACHY CH4 column aver-aging kernels to the model vertical profiles. Of course, the expected anomaly since 2007 for this yearly repeated model is zero. Nevertheless, a deviation from zero is a measure of the impact of sampling in particular due to the different fil-ter crifil-teria affil-ter October 2005; e.g., the restriction to land leads to a smaller seasonal cycle for the Southern Hemi-sphere being visible in both the satellite and model data. Hence, the anomaly of the model is a lower bound of the error of the observed SCIAMACHY anomaly. Neglecting other possible error sources the anomaly of SCIAMACHY XCH4amounts to 8.2±0.5 ppb yr−1for the Northern Hemi-sphere and 5.4±0.6 ppb yr−1 for the Southern Hemisphere. The contribution of the restriction to land after October 2005 to the sampling error of the anomalies is smaller than 0.2 ppb yr−1as estimated by additionally restricting to land for the whole time series and comparing the respec-tive anomalies to the previously derived values. Hence, the potential error of the anomalies induced by using land and ocean scenes before and land only scenes after the end of October 2005 is small. This is a reasonable result because the amount of available data over the ocean is comparatively thin, anyway.
Table 3. Mean amplitude of seasonal cycle and observed annual anomaly since 2007 for SCIAMACHY and TM5 XCH4for the two hemispheres and other latitude bands. The anomaly of the model (2003 repeated) is an estimate of the impact of sampling because it is expected to be zero and is therefore a lower bound of the error of the SCIAMACHY anomaly.
Mean amplitude Anomaly Latitude band seasonal cycle since 2007
[ppb] [ppb yr−1] SCIA TM5(2003) SCIA TM5(2003)
Global 13.4±4.0 9.8±2.9 7.4 −0.4 NH 13.7±2.6 9.3±0.3 8.2 −0.5 SH 8.5±5.3 8.5±1.7 5.4 −0.6 30◦N–90◦N 12.4±8.0 11.2±0.8 6.6 −0.6 30◦S–30◦N 7.3±3.7 5.1±0.9 8.2 −0.2 30◦S–90◦S 10.6±1.2 8.5±3.1 4.4 0.0 0◦N–30◦N 17.2±1.9 10.8±1.0 9.1 −0.4 0◦S–30◦S 6.1±2.7 5.2±0.3 5.8 −0.5
According to Table 3, where also the results for other zonal averages are listed, the largest increase of the SCIAMACHY data is observed for the tropics and northern mid- and high-latitudes (≈7.5±1.5 ppb yr−1since 2007). This is consistent with Dlugokencky et al., 2009. The analysis of the seasonal variations shows that the mean amplitudes of the seasonal cy-cles of the SCIAMACHY data and the TM5 model typically differ by less than 4 ppb for the analysed latitude bands.
5 Conclusions
This manuscript presented and discussed a long-term (2003– 2009) global data set of atmospheric carbon dioxide and methane column-averaged dry air mole fractions retrieved from the spectral near-infrared/shortwave-infrared nadir ob-servations of the SCIAMACHY instrument onboard the Eu-ropean environmental satellite ENVISAT using the improved version 2.0/2.1 of the scientific retrieval algorithm WFM-DOAS.
To assess the quality of the data, we have performed com-parisons with NOAA’s global assimilation system Carbon-Tracker for carbon dioxide as well as with the TM5 model and surface measurements for methane focusing on seasonal variations and long-term increase. The amplitudes of the seasonal cycles of the satellite retrievals for the considered zonal averages are typically higher than for the model data: about 0.5–1.5 ppm for CO2and typically less than 4 ppb for CH4. The corresponding phases are generally in reason-able to good agreement with the exception of southern hemi-spheric XCO2. This systematic difference is ascribed to sea-sonally varying subvisual thin cirrus cloud cover.
The continuous CO2 increase with time is obvious in both the SCIAMACHY data and the CarbonTracker
reanal-ysis product. The retrieved global annual mean increase agrees with CarbonTracker within the error bars amounting to 1.80±0.13 ppm yr−1 compared to 1.81
±0.09 ppm yr−1. To further examine the differences in the values of seasonal amplitude and to quantify the relative accuracy of the data, comparisons with independent column-averaged mole frac-tion data from ground-based Fourier Transform Spectrom-eters (FTS) are intended for the future. However, such a quantitative comparison will not be trivial due to the different averaging kernels of WFM-DOAS and FTS influencing the respective absolute amounts of retrieved seasonal variability and annual increase. Therefore, the differing sensitivities of the instruments have to be taken into account appropriately.
The investigation of the longitudinal gradients for boreal forests during the growing season being valuable to infer re-gional fluxes shows good agreement between SCIAMACHY and CarbonTracker concerning inter-annual variability and absolute values of the gradients for the overall region cov-ering the bulk of the boreal forest area of the planet. The satellite results point to a stronger North American boreal forest uptake and a weaker Russian boreal forest uptake com-pared to CarbonTracker, although the yearly gradients deter-mined from the two data sets agree within their error bars. In consistency with Keppel-Aleks et al., 2010 our analysis in-dicates that regional timing uncertainties in the onset of the boreal forest uptake in the CASA model which is used in Car-bonTracker can contribute to the observed differences of the longitudinal gradients. However, due to the additional co-existence of complex curved varying north-south gradients in the atmosphere no strong conclusions about the regional partitioning of total flux strength can be drawn in the end.
The SCIAMACHY methane data are consistent with sur-face measurements reporting a renewed increase of atmo-spheric CH4after years of near-zero growth. The largest re-trieved increase from the SCIAMACHY data is observed for the tropics and northern mid- and high-latitudes amounting to about 7.5±1.5 ppb yr−1since 2007. However, a compar-ison of the anomaly with long-term column-averaged model data would be more suited to quantify the expected increase of the satellite data than the comparison based on surface data presented here. Therefore, it is planned for the future to com-pare the increase more quantitatively with the TM5 model being optimised versus the highly accurate surface measure-ments from the NOAA/ESRL network once the model runs are available for the whole time period 2003–2009 to assess the quality of the absolute values of the retrieved anomaly in more detail.
wavelengths with strong methane absorption in the Q-branch of the 2ν3band which are not useable when using the stan-dard calibration.
Acknowledgements. We thank ESA and DLR for providing us with the SCIAMACHY Level 1 data and the SCIAMACHY calibra-tion team (DLR, SRON, University of Bremen, ESA, and others) for continuously improving the quality of the spectra. Carbon-Tracker 2010 results were provided by NOAA ESRL, Boulder, Colorado, USA from the website at http://carbontracker.noaa.gov. We also thank NOAA ESRL for the the methane Marine Bound-ary Layer reference matrix and Peter Bergamaschi from EC-JRC for providing the TM5 methane model runs. SCIAMACHY Ab-sorbing Aerosol Index data were obtained from the TEMIS website (http://www.temis.nl/airpollution/absaai/). We acknowledge SRON for providing the dynamic bad and dead pixel mask products. This paper has been significantly improved due to comments on earlier versions of the manuscript from Pieter Tans, NOAA.
The research leading to these results has received funding from the ESA project CARBONGASES which is part of The Changing Earth Science Network, the ESA projects GHG-CCI, ADVANSE, and ALANIS Methane, the European Union’s Seventh Framework Programme (FP7/2007-2013) under Grant Agreement no. 218793 and 212095 (MACC and CityZen), the DLR grant SADOS, and from the University and the State of Bremen.
Edited by: R. Cohen
References
Aumann, H. H., Gregorich, D., and Gaiser, S.: AIRS hyper-spectral measurements for climate research: carbon dioxide and nitrous oxide effects, Geophys. Res. Lett., 32, L05806, doi:10.1029/2004GL021784, 2005.
Barkley, M. P., Frieß, U., and Monks, P. S.: Measuring atmospheric CO2 from space using Full Spectral Initiation (FSI) WFM-DOAS, Atmos. Chem. Phys., 6, 3517–3534, doi:10.5194/acp-6-3517-2006, 2006a.
Barkley, M. P., Monks, P. S., and Engelen, R. J.: Comparison of SCIAMACHY and AIRS CO2measurements over North Amer-ica during the summer and autumn of 2003, Geophys. Res. Lett., 33, L20805, doi:10.1029/2006GL026807, 2006b.
Barkley, M. P., Monks, P. S., Frieß, U., Mittermeier, R. L., Fast, H., K¨orner, S., and Heimann, M.: Comparisons between SCIA-MACHY atmospheric CO2retrieved using (FSI) WFM-DOAS to ground based FTIR data and the TM3 chemistry transport model, Atmos. Chem. Phys., 6, 4483–4498, doi:10.5194/acp-6-4483-2006, 2006c.
Barkley, M. P., Monks, P. S., Hewitt, A. J., Machida, T., Desai, A., Vinnichenko, N., Nakazawa, T., Yu Arshinov, M., Fedoseev, N., and Watai, T.: Assessing the near surface sensitivity of SCIA-MACHY atmospheric CO2retrieved using (FSI) WFM-DOAS, Atmos. Chem. Phys., 7, 3597–3619, doi:10.5194/acp-7-3597-2007, 2007.
Bergamaschi, P., Frankenberg, C., Meirink, J. F., Krol, M., Den-tener, F., Wagner, T., Platt, U., Kaplan, J. O., K¨orner, S., Heimann, M., Dlugokencky, E. J., and Goede, A.: Satellite char-tography of atmospheric methane from SCIAMACHY onboard
ENVISAT: 2. Evaluation based on inverse model simulations, J. Geophys. Res., 112, D02304, doi:10.1029/2006JD007268, 2007.
Bergamaschi, P., Frankenberg, C., Meirink, J. F., Krol, M., Vil-lani, M. G., Houweling, S., Dentener, F., Dlugokencky, E. J., Miller, J. B., Gatti, L. V., Engel, A., and Levin, I.: Inverse modeling of global and regional CH4 emissions using SCIA-MACHY satellite retrievals, J. Geophys. Res., 114, D22301, doi:10.1029/2009JD012287, 2009.
Bloom, A. A., Palmer, P. I., Fraser, A., Reay, D. S., and Franken-berg, C.: Large-scale controls of methanogenesis inferred from methane and gravity spaceborne data, Science, 327, 322–325, doi:10.1126/science.1175176, 2010.
B¨osch, H., Toon, G. C., Sen, B., Washenfelder, R. A., Wennberg, P. O., Buchwitz, M., de Beek, R., Burrows, J. P., Crisp, D., Christi, M., Connor, B. J., Natraj, V., and Yung, Y. L.: Space-based near-infrared CO2measurements: testing the Orbit-ing Carbon Observatory retrieval algorithm and validation con-cept using SCIAMACHY observations over Park Falls, Wiscon-sin, J. Geophys. Res., 111, D23302, doi:10.1029/2006JD007080, 2006.
Bousquet, P., Ciais, P., Miller, J. B., Dlugokencky, E. J., Hauglus-taine, D. A., Prigent, C., Van der Werf, G. R., Peylin, P., Brunke, E.-G., Carouge, C., Langenfelds, R. L., Lathiere, J., Papa, F., Ramonet, M., Schmidt, M., Steele, L. P., Tyler, S. C., and White, J.: Contribution of anthropogenic and natural sources to atmospheric methane variability, Nature, 443, 439–443, doi:10.1038/nature05132, 2006.
Bovensmann, H., Burrows, J. P., Buchwitz, M., Frerick, J., No¨el, S., Rozanov, V. V., Chance, K. V., and Goede, A.: SCIAMACHY – mission objectives and measurement modes, J. Atmos. Sci., 56, 127–150, 1999.
Bramstedt, K.: Calculation of SCIAMACHY M-Factors, Technical Note, IFE-SCIA-TN-2007-01-CalcMFactor, Issue: 1, available online at: http://www.iup.uni-bremen.de/sciamachy/mfactors/ mfactor-TN-1-0.pdf, 2008.
Buchwitz, M. and Burrows, J. P.: Retrieval of CH4, CO, and CO2 total column amounts from SCIAMACHY near-infrared nadir spectra: retrieval algorithm and first results, in: Remote Sensing of Clouds and the Atmosphere VIII, edited by: Sch¨afer, K. P., Com`eron, A., Carleer, M. R., and Picard, R. H., P. SPIE, 5235, 375–388, 2004.
Buchwitz, M., Rozanov, V. V., and Burrows, J. P.: A correlated-k distribution scheme for overlapping gases suitable for retrieval of atmospheric constituents from moderate resolution radiance measurements in the visible/near-infrared spectral region, J. Geo-phys. Res., 105, 15247–15261, 2000.
Buchwitz, M., de Beek, R., Burrows, J. P., Bovensmann, H., Warneke, T., Notholt, J., Meirink, J. F., Goede, A. P. H., Bergam-aschi, P., K¨orner, S., Heimann, M., and Schulz, A.: Atmospheric methane and carbon dioxide from SCIAMACHY satellite data: initial comparison with chemistry and transport models, Atmos. Chem. Phys., 5, 941–962, doi:10.5194/acp-5-941-2005, 2005a. Buchwitz, M., de Beek, R., No¨el, S., Burrows, J. P.,
Buchwitz, M., de Beek, R., No¨el, S., Burrows, J. P., Bovens-mann, H., Schneising, O., Khlystova, I., Bruns, M., Bremer, H., Bergamaschi, P., K¨orner, S., and Heimann, M.: Atmospheric carbon gases retrieved from SCIAMACHY by WFM-DOAS: version 0.5 CO and CH4 and impact of calibration improve-ments on CO2 retrieval, Atmos. Chem. Phys., 6, 2727–2751, doi:10.5194/acp-6-2727-2006, 2006.
Buchwitz, M., Schneising, O., Burrows, J. P., Bovensmann, H., Reuter, M., and Notholt, J.: First direct observation of the at-mospheric CO2year-to-year increase from space, Atmos. Chem. Phys., 7, 4249–4256, doi:10.5194/acp-7-4249-2007, 2007. Burrows, J. P. and Chance, K. V.: Scanning imaging absorption
spectrometer for atmospheric chartography, in: Future European and Japanese Remote Sensing Sensors and Programs, edited by: Slater, P. N., P. SPIE, 1490, 146–155, 1991.
Burrows, J. P., Schneider, W., Geary, J. C., Chance, K. V., Goede, A. P. H., Aarts, H. J. M., de Vries, J., Smorenburg, C., and Visser, H.: Atmospheric remote sensing with SCIAMACHY, Digest of Topical Meeting on Optical Remote Sensing of the At-mosphere, Optical Society of America, Washington DC, USA, 4, 71–74, 1990.
Burrows, J. P., H¨olzle, E., Goede, A. P. H., Visser, H., and Fricke, W.: SCIAMACHY – scanning imaging absorption spec-trometer for atmospheric chartography, Acta Astronaut., 35, 445–451, 1995.
Ch´edin, A., Hollingsworth, A., Scott, N. A., Serrar, S., Crevoisier, C., and Armante, R.: Annual and seasonal varia-tions of atmospheric CO2, N2O and CO concentrations retrieved from NOAA/TOVS satellite observations, Geophys. Res. Lett., 29, 1269, doi:10.1029/2001GL014082, 2002.
Ch´edin, A., Serrar, S., Scott, N. A., Crevoisier, C., and Armante, R.: First global measurement of midtropospheric CO2from NOAA polar satellites: tropical zone, J. Geophys. Res., 108, 4581, doi:10.1029/2003JD003439, 2003.
Crevoisier, C., Ch´edin, A., Matsueda, H., Machida, T., Armante, R., and Scott, N. A.: First year of upper tropospheric integrated con-tent of CO2from IASI hyperspectral infrared observations, At-mos. Chem. Phys., 9, 4797–4810, doi:10.5194/acp-9-4797-2009, 2009a.
Crevoisier, C., Nobileau, D., Fiore, A. M., Armante, R., Ch´edin, A., and Scott, N. A.: Tropospheric methane in the tropics – first year from IASI hyperspectral infrared observations, Atmos. Chem. Phys., 9, 6337–6350, doi:10.5194/acp-9-6337-2009, 2009b. Dlugokencky, E. J., Bruhwiler, L., White, J. W. C., Emmons, L. K.,
Novelli, P. C., Montzka, S. A., Masarie, K. A., Lang, P. M., Crotwell, A. M., Miller, J. B., and Gatti, L. V.: Observational constraints on recent increases in the atmospheric CH4burden, Geophys. Res. Lett., 36, L18803, doi:10.1029/2009GL039780, 2009.
Dlugokencky, E. J., Lang, P. M., and Masarie, K. A.: Atmospheric methane dry air mole fractions from the NOAA ESRL carbon cycle cooperative global air sampling network, 1983–2009, ver-sion: 2010-08-12, available online at: ftp://ftp.cmdl.noaa.gov/ ccg/ch4/flask/event/, last access: 8 September 2010, 2010. Engelen, R. J. and McNally, A. P.: Estimating atmospheric CO2
from advanced infrared satellite radiances within an operational 4D-Var data assimilation system: results and validation, J. Geo-phys. Res., 109, D18305, doi:10.1029/2005JD005982, 2005. Engelen, R. J., Andersson, E., Chevallier, F., Hollingsworth, A.,
Matricardi, M., McNally, A. P., Th´epaut, J.-N., and Watts, P. D.: Estimating atmospheric CO2from advanced infrared satellite ra-diances within an operational 4D-Var data assimilation system: methodology and first results, J. Geophys. Res., 109, D19309, doi:10.1029/2004JD004777, 2004.
Frankenberg, C., Meirink, J. F., van Weele, M., Platt, U.,
and Wagner, T.: Assessing methane emissions from
global spaceborne observations, Science, 308, 1010–1014, doi:10.1126/science.1106644, 2005.
Frankenberg, C., Meirink, J. F., Bergamaschi, P., Goede, A. P. H., Heimann, M., K¨orner, S., Platt, U., van Weele, M., and Wagner, T.: Satellite chartography of atmospheric methane from SCIAMACHY onboard ENVISAT: analysis of the years 2003 and 2004, J. Geophys. Res., 111, D07303, doi:10.1029/2005JD006235, 2006.
Frankenberg, C., Warneke, T., Butz, A., Aben, I., Hase, F., Spi-etz, P., and Brown, L. R.: Pressure broadening in the 2ν3band of methane and its implication on atmospheric retrievals, At-mos. Chem. Phys., 8, 5061–5075, doi:10.5194/acp-8-5061-2008, 2008a.
Frankenberg, C., Bergamaschi, P., Butz, A., Houweling, S., Meirink, J. F., Notholt, J., Petersen, A. K., Schrijver, H., Warneke, T., and Aben, I.: Tropical methane emissions: a re-vised view from SCIAMACHY onboard ENVISAT, Geophys. Res. Lett., 35, L15811, doi:10.1029/2008GL034300, 2008b. Frankenberg, C., Aben, I., Bergamaschi, P., Dlugokencky, E. J., van
Hees, R., Houweling, S., van der Meer, P., Snel, R., and Tol, P.: Global column-averaged methane mixing ratios from 2003 to 2009 as derived from SCIAMACHY: Trends and variability, J. Geophys. Res., 116, D04302, doi:10.1029/2010JD014849, 2011.
Gloudemans, A. M. S., Schrijver, H., Kleipool, Q., van den Broek, M. M. P., Straume, A. G., Lichtenberg, G., van Hees, R. M., Aben, I., and Meirink, J. F.: The impact of SCIAMACHY near-infrared instrument calibration on CH4 and CO total columns, Atmos. Chem. Phys., 5, 2369–2383, doi:10.5194/acp-5-2369-2005, 2005.
Herman, J. R., Bhartia, P. K., Torres, O., Hsu, C., Seftor, C., and Celarier, E.: Global distribution of UV absorbing aerosols from Nimbus7/TOMS data, J. Geophys. Res., 102, 16911–16922, 1997.
Houweling, S., Breon, F.-M., Aben, I., R¨odenbeck, C., Gloor, M., Heimann, M., and Ciais, P.: Inverse modeling of CO2sources and sinks using satellite data: a synthetic inter-comparison of measurement techniques and their performance as a func-tion of space and time, Atmos. Chem. Phys., 4, 523–538, doi:10.5194/acp-4-523-2004, 2004.
Houweling, S., Hartmann, W., Aben, I., Schrijver, H., Skidmore, J., Roelofs, G.-J., and Breon, F.-M.: Evidence of systematic errors in SCIAMACHY-observed CO2due to aerosols, Atmos. Chem. Phys., 5, 3003–3013, doi:10.5194/acp-5-3003-2005, 2005. Jenouvrier, A., Daumont, L., R´egalia-Jarlot, L., Tyuterev, V. G.,
Carleer, M., Vandaele, A. C., Mikhailenko, S., and Fally, S.: Fourier transform measurements of water vapor line parameters in the 4200–6600 cm−1 region, J. Quant. Spectrosc. Ra., 105, 326–355, doi:10.1016/j.jqsrt.2006.11.007, 2007.
2010.
Krol, M., Houweling, S., Bregman, B., van den Broek, M., Segers, A., van Velthoven, P., Peters, W., Dentener, F., and Berga-maschi, P.: The two-way nested global chemistry-transport zoom model TM5: algorithm and applications, Atmos. Chem. Phys., 5, 417–432, doi:10.5194/acp-5-417-2005, 2005.
Kulawik, S. S., Jones, D. B. A., Nassar, R., Irion, F. W., Wor-den, J. R., Bowman, K. W., Machida, T., Matsueda, H., Sawa, Y., Biraud, S. C., Fischer, M. L., and Jacobson, A. R.: Charac-terization of Tropospheric Emission Spectrometer (TES) CO2 for carbon cycle science, Atmos. Chem. Phys., 10, 5601–5623, doi:10.5194/acp-10-5601-2010, 2010.
Lichtenberg, G., Kleipool, Q., Krijger, J. M., van Soest, G., van Hees, R., Tilstra, L. G., Acarreta, J. R., Aben, I., Ahlers, B., Bovensmann, H., Chance, K., Gloudemans, A. M. S., Hoogeveen, R. W. M., Jongma, R. T. N., No¨el, S., Piters, A., Schrijver, H., Schrijvers, C., Sioris, C. E., Skupin, J., Sli-jkhuis, S., Stammes, P. and Wuttke, M.: SCIAMACHY Level 1 data: calibration concept and in-flight calibration, Atmos. Chem. Phys., 6, 5347–5367, doi:10.5194/acp-6-5347-2006, 2006. Maddy, E. S., Barnet, C. D., Goldberg, M., Sweeney, C., and
Liu, X.: CO2retrievals from the Atmospheric Infrared Sounder: methodology and validation, J. Geophys. Res., 113, D11301, doi:10.1029/2007JD009402, 2008.
Masarie, K. A. and Tans, P. P.: Extension and integration of at-mospheric carbon dioxide data into a globally consistent mea-surement record, J. Geophys. Res., 100, D6, 11593–11610, doi:10.1029/95JD00859, 1995.
Peters, W., Jacobson, A. R., Sweeney, C., Andrews, A. E., Con-way, T. J., Masarie, K., Miller, J. B., Bruhwiler, L. M. P., P´etron, G., Hirsch, A. I., Worthy, D. E. J., van der Werf, G. R., Randerson, J. T., Wennberg, P. O., Krol, M. C., and Tans, P. P.: An atmospheric perspective on North American carbon dioxide exchange: CarbonTracker, P. Natl. Acad. Sci. USA, 104, 18925– 18930, 2007.
Peters, W., Krol, M. C., van der Werf, G. R., Houweling, S., Jones, C. D., Hughes, J., Schaefer, K., Masarie, K. A., Ja-cobson, A. R., Miller, J. B., Cho, C. H., Ramonet, M., Schmidt, M., Ciattaglia, L., Apadula, F., Heltai, D., Mein-hardt, F., di Sarra, A. G., Piacentino, S., Sferlazzo, D., Aalto, T., Hatakka, J., Str¨om, J., Haszpra, L., Meijer, H. A. J., van der Laan, S., Neubert, R. E. M., Jordan, A., Rod´o, X., Morgu´ı, J.-A., Vermeulen, A. T., Popa, E., Rozanski, K., Zimnoch, M., Manning, A. C., Leuenberger, M., Uglietti, C., Dolman, A. J., Ciais, P., Heimann, M., and Tans, P. P.: Seven years of recent European net terrestrial carbon dioxide exchange constrained by atmospheric observations, Glob. Change Biol., 16, 1317–1337, doi:10.1111/j.1365-2486.2009.02078.x, 2010.
Rayner, P. J. and O’Brien, D. M.: The utility of remotely sensed CO2 concentration data in surface inversions, Geophys. Res. Lett., 28, 175–178, 2001.
Reuter, M., Buchwitz, M., Schneising, O., Heymann, J., Bovens-mann, H., and Burrows, J. P.: A method for improved SCIA-MACHY CO2retrieval in the presence of optically thin clouds, Atmos. Meas. Tech., 3, 209–232, doi:10.5194/amt-3-209-2010, 2010.
Rigby, M., Prinn, R. G., Fraser, P. J., Simmonds, P. G., Lan-genfelds, R. L., Huang, J., Cunnold, D. M., Steele, L. P., Krummel, P. B., Weiss, R. F., O’Doherty, S., Salameh, P. K.,
Wang, H. J., Harth, C. M., M¨uhle, J., and Porter, L. W.: Re-newed growth of atmospheric methane, Geophys. Res. Lett., 35, L22805, doi:10.1029/2008GL036037, 2008.
Rothman, L. S., Jaquemart, D., Barbe, A., Benner, D. C., Birk, M., Brown, L. R., Carleer, M. R., Chackerian, C., Chance, K., Coud-ert, L. H., Dana, V., Devi, V. M., Flaud, J.-M., Gamache, R. R., Goldman, A., Hartmann, J.-M., Jucks, K. W., Maki, A. G., Mandin, J.-Y., Massie, S. T., Orphal, J., Perrin, A., Rins-land, C. P., Smith, M. A. H., Tennyson, J., Tolchenov, R. N., Toth, R. A., Vander Auwera, J., Varanasi, P., and Wagner, G.: The HITRAN 2004 molecular spectroscopic database, J. Quant. Spectrosc. Ra., 96, 139–204, doi:10.1016/j.jqsrt.2004.10.008, 2005.
Rothman, L. S., Gordon, I. E., Barbe, A., Benner, D. C., Bernath, P. F., Birk, M., Boudon, V., Brown, L. R., Campar-gue, A., Champion, J.-P., Chance, K., Coudert, L. H., Dana, V., Devi, V. M., Fally, S., Flaud, J.-M., Gamache, R. R., Gold-man, A., Jaquemart, D., Kleiner, I., Lacome, N., Lafferty, W. J., Mandin, J.-Y., Massie, S. T., Mikhailenko, S. N., Miller, C. E., Moazzen-Ahmadi, N., Naumenko, O. V., Nikitin, A. V., Or-phal, J., Perevalov, V. I., Perrin, A., Predoi-Cross, A., Rins-land, C. P., Rotger, M., Simeckova, M., Smith, M. A. H., Sung, K., Tashkun, S. A., Tennyson, J., Toth, R. A., Van-daele, A. C., and Auwera, J. V.: The HITRAN 2008 molecular spectroscopic database, J. Quant. Spectrosc. Ra., 110, 533–572, doi:10.1016/j.jqsrt.2009.02.013, 2009.
Schneising, O., Buchwitz, M., Burrows, J. P., Bovensmann, H., Reuter, M., Notholt, J., Macatangay, R., and Warneke, T.: Three years of greenhouse gas column-averaged dry air mole fractions retrieved from satellite – Part 1: Carbon dioxide, Atmos. Chem. Phys., 8, 3827–3853, doi:10.5194/acp-8-3827-2008, 2008. Schneising, O., Buchwitz, M., Burrows, J. P., Bovensmann, H.,
Bergamaschi, P., and Peters, W.: Three years of greenhouse gas column-averaged dry air mole fractions retrieved from satel-lite – Part 2: Methane, Atmos. Chem. Phys., 9, 443–465, doi:10.5194/acp-9-443-2009, 2009.
Solomon, S., Qin, D., Manning, M., Chen, Z., Marquis, M., Av-eryt, K. B., Tignor, M., and Miller, H. L. (Eds.): Climate Change 2007: The Physical Science Basis, Contribution of Working Group I to the Fourth Assessment Report of the Intergovern-mental Panel on Climate Change (IPCC), Cambridge University Press, Cambridge, United Kingdom and New York, NY, USA, 2007.
Stephens, B. B., Gurney, K. R., Tans, P. P., Sweeney, C., Pe-ters, W., Bruhwiler, L., Ciais, P., Ramonet, M., Bousquet, P., Nakazawa, T., Aoki, S., Machida, T., Inoue, G., Vinnichenko, N., Lloyd, J., Jordan, A., Heimann, M., Shibistova, O., Langen-felds, R. L., Steele, L. P., Francey, R. J., and Denning, A. S.: Weak northern and strong tropical land carbon uptake from verti-cal profiles of atmospheric CO2, Science, 316, 1732–1735, 2007. Strow, L. L., Hannon, S. E., De-Souza Machado, S., Motteler, H. E., and Tobin, D. C.: Validation of the Atmospheric Infrared Sounder radiative transfer algorithm, J. Geophys. Res., 111, D09S06, doi:10.1029/2005JD006146, 2006.
Tilstra, L. G., de Graaf, M., Aben, I., and Stammes, P.: Analysis of 5 years of SCIAMACHY absorbing aerosol index data, Pro-ceedings ENVISAT Symposium, Montreux, Switzerland, 23– 27 April 2007, ESA Special Publication SP-636, 2007.
Randerson, J. T., Tans, P. P., Sweeney, C., and Wennberg, P. O.:
New constraints on Northern Hemisphere growing
season net flux, Geophys. Res. Lett., 34, L12807,
doi:10.1029/2007GL029742, 2007.