www.scielo.br/rbg
OCEANOGRAPHIC CHARACTERISTICS OF BA´IA DE TODOS OS SANTOS, BRAZIL
Mauro Cirano
1and Guilherme Camargo Lessa
2Recebido em 18 novembro, 2006 / Aceito em 9 outubro, 2007 Received on November 18, 2006 / Accepted on October 9, 2007
ABSTRACT.Based on a vast set ofin situ data, a first comprehensive overview of the oceanographic characteristics of Ba´ıa de Todos os Santos (BTS) is provided. BTS is the second largest coastal bay in Brazil (maximum area of 1223 km2and average depth of 9.8 m), and is located in the northeast Brazil, in the vicinity of Salvador city. The circulation inside the bay is mostly tidally driven and does not vary significantly throughout the year. On the other hand, the wet (winter) and dry (summer) seasons does alter significantly the distribution of water properties inside the BTS. During summer, the waters inside the bay have oceanic characteristics, with Tropical Water (TW) penetrating along the whole region, except for the mouth of Rio Paraguac¸u. The water temperature inside the bay is higher than in the coastal zone, and variations can be up to 3◦C, reaching a maximum of nearly 30◦C. During winter, with the increase of freshwater inflow, salinity variations of about 4 are observed between the innermost stations inside BTS and the adjacent coastal region. Salinity values inside the bay can be as low as 32.3, inhibiting the penetration of TW into the BTS, which is totally occupied by a locally formed Coastal Water (CW). An evaluation of the flushing time is also provided and shows that during summer, a 60-fold increase can be observed compared to winter (38 days). While the circulation does not vary seasonally inside the bay, the associated inner shelf is characterized by two different scenarios. During summer, the upwelling favorable easterlies drive a southwestward flow, while during winter the more frequent occurrence of cold fronts (southerly winds) tend to reverse the circulation.
Keywords: Ba´ıa de Todos os Santos, circulation, tides, water masses.
RESUMO.Com base em um amplo conjunto de dadosin situ, este artigo apresenta uma primeira caracterizac¸˜ao oceanogr´afica da Ba´ıa de Todos os Santos. A BTS ´e a segunda maior ba´ıa costeira do Brasil (´area m´axima de 1223 km2e profundidade m´edia de 9,8 m), e est´a localizada na regi˜ao nordeste do Brasil, nas proximidades da cidade de Salvador. A circulac¸˜ao no interior da ba´ıa ´e predominantemente forc¸ada pelas mar´es e n˜ao varia significantemente ao longo do ano. Por outro lado, as estac¸˜oes chuvosa (inverno) e seca (ver˜ao) geram uma alterac¸˜ao significativa nas propriedades das ´aguas no interior da BTS. Durante o ver˜ao, as ´aguas dentro da ba´ıa tˆem caracter´ısticas oceˆanicas, com a ´Agua Tropical (AT) penetrando ao longo de toda a regi˜ao, com excec¸˜ao da desembocadura do Rio Paraguac¸u. A temperatura da ´agua dentro da ba´ıa ´e maior do que a da regi˜ao costeira adjacente, e estas variac¸˜oes podem ser de at´e 3◦C, atingindo um m´aximo de 30◦C. Durante o inverno, com o aumento do aporte de ´agua doce, variac¸˜oes de salinidade de cerca de 4 podem ser observadas entre a parte mais interna da BTS e a regi˜ao costeira adjacente. Valores de salinidade dentro da ba´ıa podem chegar at´e 32,3, inibindo a penetrac¸˜ao da AT dentro da BTS, que fica totalmente ocupada por uma ´agua costeira formada localmente. Uma avaliac¸˜ao do tempo de descarga tamb´em ´e feita e mostra que durante o ver˜ao, o tempo de descarga pode sofrer um aumento de 60% daquele observado durante o inverno (38 dias). Apesar da circulac¸˜ao n˜ao variar sazonalmente no interior da ba´ıa, observa-se que a plataforma interna associada ´e caracterizada por dois cen´arios. Durante o ver˜ao, os ventos de leste, que proporcionam ressurgˆencia, atuam para gerar correntes para sudoeste, enquanto que durante o inverno, a maior ocorrˆencia de frentes frias (ventos de sul), tende a reverter o padr˜ao de circulac¸˜ao.
Palavras-chave: Ba´ıa de Todos os Santos, circulac¸˜ao, mar´es, massas de ´agua.
1Centro de Pesquisas em Geof´ısica e Geologia (CPGG), Universidade Federal da Bahia (UFBA), Instituto de F´ısica, Departamento de F´ısica da Terra e do Meio Ambiente, Campus Ondina, 40170-280 Salvador, BA, Brazil. Phone: (71) 3283-8612; Fax: (71) 3283-8501 – E-mail: mcirano@ufba.br
2Centro de Pesquisas em Geof´ısica e Geologia (CPGG), Universidade Federal da Bahia (UFBA), Instituto de Geociˆencias, Departamento de Sedimentologia, Campus Ondina, 40170-280 Salvador, BA, Brazil. Phone: (71) 3283-8611; Fax: (71) 3283-8501 – E-mail: glessa@cpgg.ufba.br
INTRODUCTION
Like most of the southern hemisphere coastlines, the Brazilian coastline has undergone a 3 m emergence in the last 6000 ye-ars (Angulo et al., 2006), and as a result the large majority of its coastal-plain estuaries that have been filled up became river del-tas. Large estuaries that still survive are generally tectonic coastal bays that have apparently undergone varying degrees of subsi-dence and today fringe some of the most important cities and har-bor the most important ports in the country. The largest bays in Brazil are: Ba´ıa de S˜ao Marcos (BSM – 2025 km2) in the state
of Maranh˜ao, Ba´ıa de Todos os Santos (BTS – 1233 km2) in the
State of Bahia and Ba´ıa de Paranagu´a (BP – 612 km2) in the state
of Paran´a. The well known Ba´ıa de Guanabara (BG) in the state of Rio de Janeiro is relatively small, with an area of 384 km2.
BTS is located in the vicinity of the third major metropolitan area in Brazil, the city of Salvador (population of 2.7 million ac-cording to IBGE, 2006), and the largest petrochemical complex of the southern hemisphere (Camac¸ari Petrochemical Center). Due to its economic importance, the bay houses two commo-dities ports (Aratu and Salvador), with a total annual flow of 31.4× 10⁶tons (ANTAQ, 2005), which represent nearly 5% of
the total annual flow in Brazilian ports. In addition, there are also three outfalls in the continental shelf located northeast of the bay (two for chemical substances and one for sewage). The sewage outfall is the closest to the bay entrance and was built to have a maximum discharge of 8.3 m3s-1(CRA, 2001). Several offshore
oil and gas fields are also prospected within 100 km from the bay entrance and are presented in ANP (2007).
Except for BG (Kjerfve et al., 1997), a comprehensive over-view of the oceanographic characteristics of large Brazilian bays and their surrounding coastal zone is not yet found in the scientific literature. For instance, the relevant publications for BTS are res-tricted to studies regarding data analysis (Wolgemuth et al., 1981; Lessa et al., 2001) and modeling of water circulation (Montenegro et al., 1999). The bay and the neighboring open coastal areas in front of Salvador have been the focus of continuous environmen-tal monitoring programs. However, the results are unfortunately kept as technical reports with restricted circulation.
The most important and complete monitoring program for the BTS was the Projeto Bahia Azul. It was a massive project fun-ded by the State Government from 1998 to 2001 to assess the water quality of the BTS. The project made use of 33 moored ins-truments to sample the water velocity, temperature, salinity and the
pressure field for more than 15 continuous days and over two sea-sons1(summer and winter). Synoptic hydrographic cruises were also performed inside BTS to evaluate the distribution of proper-ties in the water column and during spring and neap tidal cycles. The main goal of this article is to produce an oceanographic characterization of the area over its seasonal variation, providing an important source of background information on the water dy-namics for the various marine scientists who work in the BTS. It also intends to pose some scientific questions related to dynami-cal aspects of the circulation, which will be better answered by the results of numerical modeling experiments to be presented by the authors in a future work.
STUDY AREA
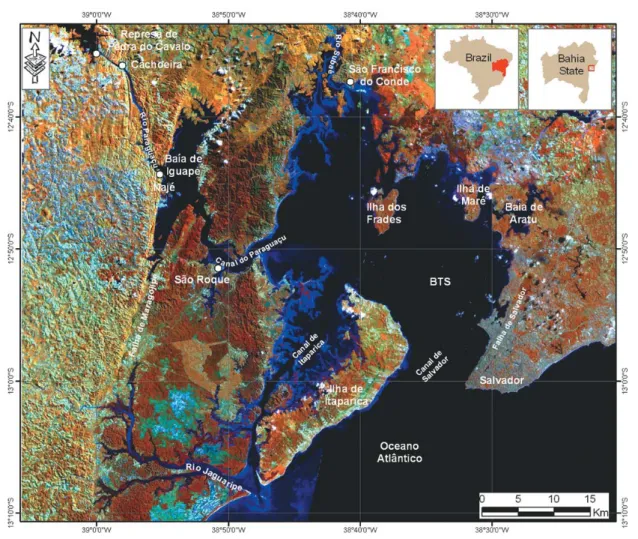
The BTS is centered on latitude 12◦50’S and longitude 38◦38’W, with an approximate maximum width (west-east axis) and length (north-south axis) of 32 km and 50 km, respectively. The geolo-gic framework of the BTS has been determined, to a high extend, by tectonism (Cupertino & Bueno, 2005). The bay is bounded in the east and the west by Cretaceous fault lines (Falha de Marago-gipe and Falha de Salvador) associated with an aborted rift valley that gave rise to the Recˆoncavo Basin (Fig. 1). Although the ma-jor fault systems were established in the Cretaceous, reactivation events occurred in the Tertiary and Quaternary, as indicated by King (1956), Tricart & da Silva (1968), Martin et al. (1986) and Bittencourt et al. (1999). The geomorphology of the bay is pri-marily dictated by tectonic alignments, but deep drainage chan-nels ramify inside the bay following an old drainage network going towards Rio Paraguac¸u, Rio Suba´e and Ba´ıa de Aratu (Fig. 2). The deepest areas inside the bay, reaching depths of 70 m, are associ-ated with the paleo-valley of Rio Paraguac¸u, which is segmented (see the 20 m isobath in Figure 2) due to sediment accumulation in front of Canal do Paraguac¸u and Canal de Itaparica. Significant accumulation of sediment is also observed in the ebb-tidal deltas fronting both entrances of the bay (Canal de Salvador and Canal de Itaparica).
Eleven textural facies were mapped by Dias (2004) (Fig. 3). Siliciclastic sand occurs at the bay entrance channels, along the western bay margin and close to the river mouths. The bay-mouth sand is of marine origin, while that inside Itaparica channel and along the western bay margin is originated from the erosion of sandstone deposits. Carbonate sand encircles the two central islands of Mar´e and Frades. Mud occurs predominantly in the
1The tropical humid climate, as it will be discussed later in more details, is divided in a dry and a wet season. For BTS, the summer months are part of the dry season,
Figure 1 – Satellite image of Ba´ıa de Todos os Santos (BTS) along with the location of important landmarks and drainage channels. Fault lines that
control the bay’s geomorphology are oriented SW-NE.
northern half of the bay affected by the drainage of fine grained sedimentary rocks. Gravel is often observed in the fluvial delta of Rio Paraguac¸u and along Canal do Paraguac¸u, where it is likely associated with the exposure of lowstand fluvial deposits. Lessa et al. (2000) interpreted the sand deposits at the bay entrance as a transgressive, siliciclastic marine sand facies, and those around the island as a transgressive carbonate marine sand facies. The muddy sediments in the northern half of the bay would be rela-ted to a transgressive bay sand-mud facies and to a regressive bay-mud facies.
The maximum bay area (at an equinoctial spring tide) and its wet perimeter (based on a planimetry estimative using Landsat images with a spatial resolution of 15 m) correspond to 1223 km2
and 1175 km, respectively. These numbers can be increased by 86 km2and 291 km, respectively, if the 91 islands internal to the
BTS are taken into account. Overall the bay is shallow with an area-weighted depth of 9.8 m. Approximately 94% of the bay area lay above depths of 25 m. The intertidal area is 327 km2
(or 27% of the maximum bay area), where 152 km2 are
occu-pied by mangroves, 160 km2by non-vegetated flats (with varied
sediment textures) and 15 km2by non-vegetated supratidal flats.
The bay volume during maximum spring tides is approximately 12× 109m3, whereas the volume below the hydrographic datum
(0 m DHN2or MLLW) is 8.9× 10⁹m3. This gives a maximum
spring-tidal prism of about 3.1× 10⁹m3. Climate and the hydrological cycle
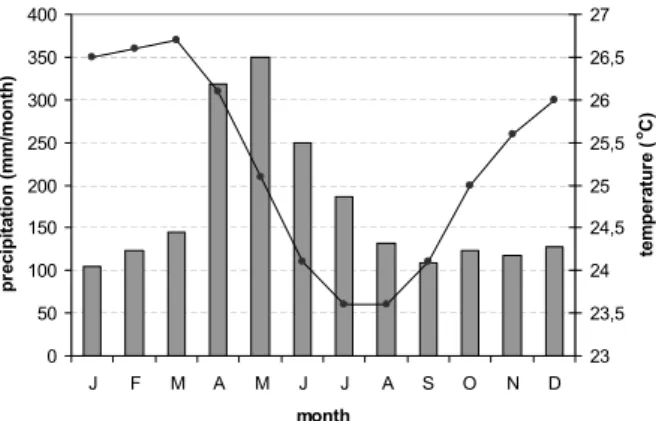
The climate at the entrance of the bay is tropical humid, with an annual mean temperature, precipitation and evaporation of 25.3◦C, 2086 mm and 1002 mm, respectively (Fig. 4) (INMET,
Figure 2 – Bottom topography of BTS and the location of the current meter moorings (stations 1 to 7 and 10 to 17), the ADCPs (stations 8 and 9), the
meteorological stations and the tidal gauges (stations 18, 19 and 20 (at the same location of station 1)) for the winter season. The measurements during summertime were performed at the same locations, except for the station 21, which was not included. The brown areas represent the intertidal regions. The depth intervals are differentiated with colors according to the legend.
1992). A precipitation gradient of about 15 mm km-1 occurs
westward across the bay, between Salvador and the upper rea-ches of Rio Paraguac¸u, where the mean annual precipitation is 1200 mm. One hundred kilometers inland from the bay mouth, the climate is semi-arid, with average annual evaporation and pre-cipitation rates of 1243 mm and 909 mm, respectively (CEPLAB, 1979).
Considering an area-weighted precipitation rate, the year-averaged volume of rain falling directly into the bay is 2.42× 10⁹m3. If the evaporation gradient across the bay is taken into
account, an average volume of 0.92× 10⁹m3is lost annually
to the atmosphere (considering the area within the 0 m DHN contour). This volume must be added to the potential evapo-transpiration rate from the mangroves, estimated according to the
Thornthwaite method (Thornthwaite, 1948) as 1412 mm year-1.
Assuming that the real evapotranspiration in a mangrove forest equals the potential, a volume of 0.21× 10⁹m3is also lost to
the atmosphere. Hence, the atmospheric-water that enters the bay is about 1.29× 10⁹m3, which represents a year-average
dis-charge of approximately 41 m3s-1.
The monthly distribution of rainfall over the bay is out of phase with that in the interior. In the former, precipitation is mainly con-centrated during the fall and in the beginning of the winter (March-July), when 60% of the total precipitation occurs (Fig. 4). On the other hand, the wet season in the mainland takes place between November and February. This pattern of distribution causes dif-ferent inputs of freshwater inflow into the bay due to the loca-tion of the three large catchment areas, as well as the 91 small
Figure 3 – Distribution of surface sediment facies inside the BTS (after Dias, 2004).
peripheral catchments (Lima & Lessa, 2002). The catchment of Rio Paraguac¸u, with an area of 56,300 km2, drains mainland
rivers and provides the main point-source discharge with maxima in December and January. Between 1949 and 1986, when Pedra do Cavalo Dam (located 15 km upstream from Ba´ıa de Iguape – Figure 1) was not yet built, the mean river discharge was 90.5 m3
s-1(Genz, 2006), or 73% of the total fluvial input. After 1986,
flow regulation implemented by the dam significantly altered the discharge pattern into the bay (Lima & Lessa, 2002; Genz, 2006). Based on the reservoir operational guidelines, an average daily discharge of 10 m3s-1 (in reality 60 m3 s-1 in 4 hours) is
re-leased during the dry season (March-October). In the wet sea-son (November-February), depending on the water level inside the reservoir (SRH, 1996), the discharge can reach a maximum of 1700 m3s-1. Between 1987 and 2003, the average year river
discharge dropped to 64.3 m3s-1(Genz, 2006). Maximum mean
daily discharges have varied significantly along the years during
this period, between 57 m3s-1(in September) and 1740 m3s-1
(in January). However, a single extraordinary flood event in December 1998 caused the maximum averaged daily discharge to reach 5726 m3s-1. 0 50 100 150 200 250 300 350 400 J F M A M J J A S O N D month pr e c ipit a ti on ( m m /m o nt h) 23 23,5 24 24,5 25 25,5 26 26,5 27 te mp er at u re ( oC)
Figure 4 – Monthly mean precipitation and air temperature based on 30 years
The other two main catchments, Rio Jaguaripe (2200 km2)
and Rio Suba´e (600 km2) (Fig. 1) are coastal, and have their
dis-charge maxima around June, with mean monthly disdis-charges of 28 m3s-1and 9 m3s-1, respectively. These values are about
th-ree times larger than their discharge minima values of 13 m3s-1
and 3 m3s-1in the summer. The other 91 peripheral catchments
(total area of 1713 km2) have their average flow rate assessed as
34 m3s-1(CRA, 2000). The annual variation of the monthly
ave-raged discharge of the peripheral catchments was assessed via the variation of the average monthly precipitation relative to the annual mean. A discharge maximum of 67 m3s-1should occur
in May, and a minimum of 19 m3s-1should occur in January.
0 50 100 150 200 250 300 350 J F M A M J J A S O N D month d isch ar g e ( m 3 s -1) PE Inflow Total Inflow (pos-dam) Total Inflow (pre-dam)
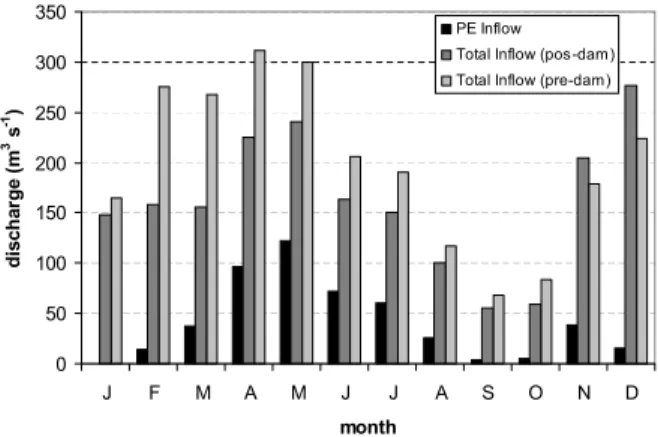
Figure 5 – Monthly mean distribution of the freshwater inflow into BTS. The
freshwater inflow is the sum of precipitation-evaporation (PE) and fluvial dischar-ges and is presented for two distinct periods, prior (light gray) and after (dark gray) the construction of Pedra do Cavalo dam. The PE alone, for comparison purposes, is presented in black.
The overall freshwater balance for the BTS, including both atmospheric-water and fluvial discharges, is presented in Fi-gure 5. It is observed that the higher freshwater inflow rates (more than 250 m3s-1) occurred between February and May prior
to the damming of Rio Paraguac¸u. For the pre-dam period, the minimum inflow rates occurred in September, with 68 m3 s-1,
while the year average discharge was 199 m3s-1. With the
com-pletion of Rio Paraguac¸u dam, summer discharges were reduced and the higher monthly averages (more than 200 m3 s-1) now
occur in April and May as well as in November and December. The minimum month-average inflow in September has been re-duced to 55 m3s-1while the year average discharge shrank 19%,
reaching a value of 162 m3s-1. The actual maximum monthly
average freshwater discharge into the bay (277 m3s-1) accounts
for less than 0.4% of the equinoctial spring tidal prism.
METHODOLOGY
The data set used in this paper is mainly derived from the
Projeto Bahia Azul. The data was collected in two different
periods, during the summer (dry) season, between January 12 and 28, 1999 and during the winter (wet) season, between May 22 and June 6, 1999. For both periods, data was obtained by: (i) moored oceanographic stations distributed over the BTS and associated coastal region sampling water temperature, sa-linity, pressure and velocity fields continuously in 17 stations; (ii) meteorological stations measuring wind speed and direction in 4 locations in and outside the bay; (iii) hydrographic surveys sam-pling water properties over one complete tidal cycle (13 hours), during spring and neap tides, in 12 stations distributed in and outside the bay. Figure 2 shows the location of all the instruments (station 21 was included in the winter campaign). The moored oceanographic stations had either one or two instruments in the moored line. In the former, the instrument was located at mid-water depth while in the latter the instruments were positioned near the surface and close to the bottom (generally 15% and 85% of the water total depth, respectively). The configuration descri-bed here does not apply for stations 8 and 9, where ADCP’s were moored.
The velocity field was measured with three different types of current meters: (i) 16 Aanderaa RCM-7 and one RCM-8; (ii) 10InterOcean S4 and (iii) 2 300 kHzRDI WorkHorse ADCP’s. The ADCP’s were deployed at the bottom and set up to resolve depth-cells of 2 m, scanning at 2 Hz and recording a 3 minutes average current every 15 minutes. The same set up was used with theInterOcean S4’s, but the RCM’s recorded the average current every 5 minutes.
The pressure field, converted to elevation, was sampled with 3 high-resolutionSeaBird SBE26 and 5 high-resolution (0.4 cm) pressure sensors installed in some of theInterOcean S4 (see Fig. 2). S4 data was obtained at 2 Hz and averaged values were recorded at 15 minutes intervals. A similar configuration was ap-plied to the SBE’s, except that the data was read at a frequency of 4 Hz. It is anticipated that such set up reduced tidal ranges by cutting both high and low water levels.
In order to extend the tidal elevation coverage inside the bay, three other sets of tide gauge data (Cachoeira, Naj´e and Aratu in Fig. 2) were obtained from the Oceanographic Data Base coordi-nated by DHN. Data from Naj´e and Cachoeira were recorded si-multaneously for 15 days in July 1976, whereas a 30 days long data set from Ba´ıa de Aratu was collected in May 1988. Mechani-cal tide gauges were used in all three stations, allowing for 1 hour
reading intervals. In addition, a one-year long time series of dal elevation (also derived from one-hour reading intervals of ti-dal charts), obtained from Salvador Harbor in 1960 was included in the data set in order to provide a better characterization of the magnitude of sub-tidal sea level oscillations inside the bay.
Harmonic analyses were performed for both sea level and ve-locity records in order to quantity the influence of tidal circulation. The methodology adopted was based on Franco (1988).
The hydrographic surveys were performed with 4 SBE19 Sea Cat CTD’s, lowered into the water 3 minutes prior to the beginning of measurements. The recording frequency was 2 Hz.
In order to characterize possible seasonal variations in the atmospheric circulation pattern, wind data was sampled at every 15 minutes in 3 different locations (4 for the winter) du-ring the 2 seasonal sampling periods. The positions of these weather stations, named Itaparica, Ilha dos Frades, Mar Grande and Amaralina (wintertime only) are shown in Figure 2. The wind speed (U) was converted to wind stress (τ) using the formulationτ = ραCD|U|U (Trenberth et al., 1989), where ρα = 1.2 kg m-3is the air density andCD is the drag
coeffici-ent, which is a function ofU.
OCEANOGRAPHIC CHARACTERISTICS The wind field
Table 1 presents the mean and the standard deviation wind stress for summer and winter. During summer, the prevailing easterlies generated mean stress values between -0.022 Pa and -0.039 Pa, with standard deviation values comparable to the mean. During the winter, southerly winds were more frequent due to the arri-val of cold fronts. The mean arri-values for the prevailing north-south component during winter varied from 0.014 Pa to 0.029 Pa with standard deviations higher than the mean. The Servain climato-logy (Servain et al., 1996) for the Tropical Atlantic was also used to verify whether the observed values were representative of a nor-mal seasonal pattern or not. It is observed that although there is a good agreement in terms of direction, the estimates for the prevai-ling component turned out to be 10% to 20% smaller. However, the observed values were comparable to the climatological fields presented by Castro & Miranda (1998), based on the Samuels and Cox GFDL Global Oceanographic Data Set Atlas.
Tides
Tides in the BTS are characteristically semi-diurnal (Tables 2 and 3), with Form number varying between 0.06 in the most internal part of the bay to 0.11 in the adjacent oceanic region. The
astro-nomical tides explained at least 97.5% (station 15) of the variance in the elevation signal, and more conspicuously in the winter.
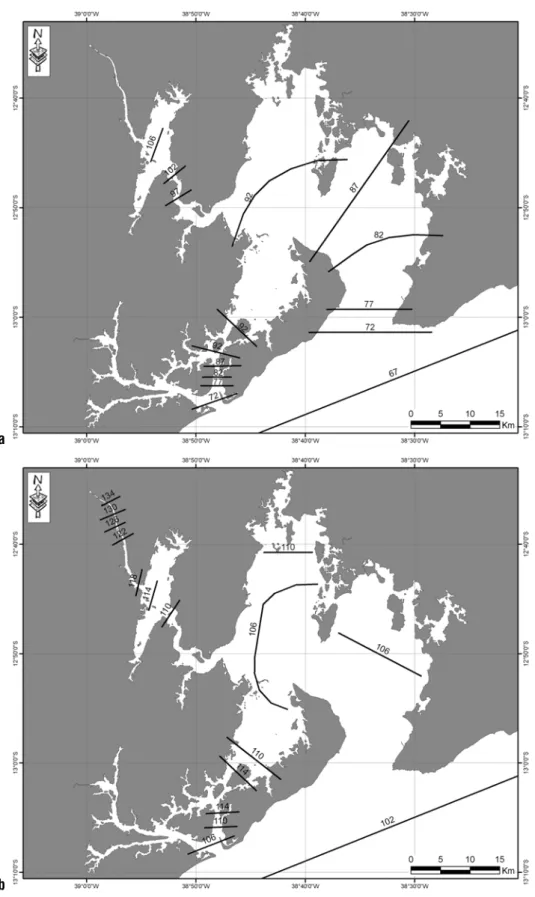
Tidal ranges increase up bay by a factor of 1.5. M2amplitude
grows from 0.67 m in the ocean (stations 13 and 14) to 0.89 m in the center of the bay (station 5), 0.93 m in the bay’s northern cove and Canal de Itaparica (stations 20 and 17) and 1.06 m at Ba´ıa de Iguape (station 18) as indicated in Figure 6a. Inside Rio Paraguac¸u, M2amplitude is reduced to 1.00 m in Naj´e and to
0.99 m in Cachoeira, the most inland gauging station. Maximum spring tide ranges in January 1999 underwent an amplification of 1.1 m inside the bay (Fig. 7), from 1.86 m in the ocean (station 13) to 2.94 m in Ba´ıa de Iguape (station 18), the location of the largest tide range.
M2phase angles among the stations were inconsistent due to
different lengths of the time series, different time of data sampling and differences in time and elevation resolution between mecha-nical tide gauges and electronic pressure sensors. For instance, M2phase angle derived from a year-long time series in
Salva-dor differs in 9◦from that calculated at station 19 (during sum-mer and winter periods), located in the opposite side of Canal de Salvador. Considering the stations presented in Tables 2 and 3 as reference, the integration of M2phase angle within the bay
(Figure 6b) shows that the phase grows from 102◦in the ocean to 106◦in the center of the bay (station 5) to 110◦at the mouth of Rio Suba´e. Towards Rio Paraguac¸u, phase angle reaches 114◦ at Ba´ıa de Iguape and a maximum of 134◦ at Cachoeira. Along Canal de Itaparica, the phase grows up to 114◦at station 17 showing that a tidal convergence point exists in the proximities of station 17.
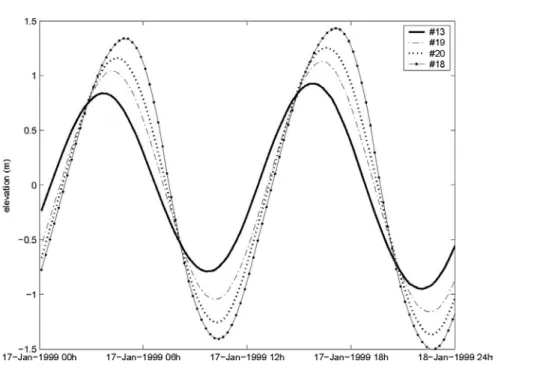
Along with amplification, the tidal wave undergoes gradual distortion with rising tides increasingly longer (Fig. 7). This pattern of tidal asymmetry occurs everywhere inside the BTS but along Rio Paraguac¸u. The average asymmetry (given as the ratio between the rising time and the falling time) grows from 1.03 at station 19 (Canal de Salvador) to 1.23 at station 18 (Ba´ıa de Iguape), where the falling tide can be as short as 5 hours. As a result, the high-tide time lag (in relation to the ocean) grows from 30 minutes at station 5 to 45 minutes at station 20 and up to 1.25 hours at station 18. Time lags at low tide are therefore smaller, being 30 minutes at stations 5 and 20 and 45 minutes at station 18.
Tidal asymmetry up Rio Paraguac¸u changes its pattern from a longer rising to a longer ebbing tide. Lessa et al. (2000) ascri-bed this phenomena to friction effect caused by the shallow fluvial delta that progrades into Ba´ıa de Iguape. Very low tide levels du-ring spdu-ring tides significantly reduce the overall channel depth
Table 1 – Values of wind stress (mean± standard deviation) estimated from wind speed data obtained from the weather
stations located within the BTS during the seasonal sampling periods (see Figure 1 for the location of the weather stations). The monthly mean values from the Servain Climatology (related to the closest location available at 13◦S and 39◦W and over the years of 1964 to 1988) are also presented for comparison purposes. Unit is Pa.
Site
Summer
Date E-WWind stress (Pa)N-S Prevailing direction
Ilha dos Frades 06/01/99 – 26/01/99 –0.039± 0.035 0.016± 0.031 ESE
Itaparica 06/01/99 – 16/01/99 –0.038± 0.029 0.011± 0.016 ESE
Mar Grande 06/01/99 – 10/01/99 –0.022± 0.018 0.003± 0.015 E
Servain Climatology January –0.046 –0.013 ENE
Winter
Amaralina 24/05/99 – 10/06/99 0.003± 0.017 0.029± 0.030 S
Ilha dos Frades 22/05/99 – 02/06/99 0.004± 0.009 0.014± 0.024 SSW
Itaparica 23/05/99 – 01/06/99 0.009± 0.016 0.014± 0.018 SSW
Mar Grande 24/05/99 – 10/06/99 –0.002± 0.009 0.025± 0.026 S
Servain Climatology June –0.054 0.035 ESE
Table 2 – Summary of tidal harmonics (for the 7 most important constituents) during the summer sampling period.
Am-plitude is H (cm), phase lag of equilibrium tide at Greenwich is G(◦) and tidal Form number (F) is given by the ratio F = (K1+ O1)/(M2+ S2).
Site Q1 O1 K1 N2 M2 S2 M4 Form Number
H/G H/G H/G H/G H/G H/G H/G S5 2.9/099 6.4/137 3.7/236 9.9/089 89.3/101 31.3/121 2.0/358 0.08 S11 1.6/148 6.1/112 3.9/208 10.0/107 68.6/087 24.1/097 – 0.11 S13 2.1/090 6.7/116 3.5/205 10.5/089 67.0/090 24.9/103 1.2/136 0.11 S14 2.2/101 6.3/119 3.2/198 11.1/089 67.0/090 24.2/104 0.0/136 0.10 S15 3.4/090 7.5/138 3.8/210 10.1/098 92.7/100 31.7/118 7.1/343 0.09 S18 3.0/112 6.7/137 4.0/224 11.4/100 106.0/109 37.9/129 9.6/285 0.07 S19 2.4/100 6.9/126 3.5/210 10.1/097 81.2/101 29.1/118 2.0/234 0.09 S20 2.7/102 7.3/131 4.1/219 10.6/098 93.3/104 33.5/123 3.7/279 0.09
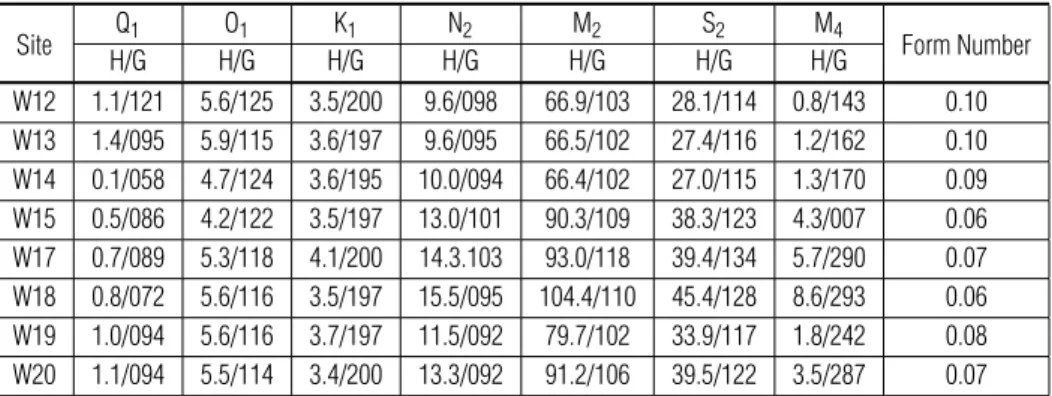
Table 3 – Same as Table 2, but for the winter sampling period.
Site Q1 O1 K1 N2 M2 S2 M4 Form Number
H/G H/G H/G H/G H/G H/G H/G W12 1.1/121 5.6/125 3.5/200 9.6/098 66.9/103 28.1/114 0.8/143 0.10 W13 1.4/095 5.9/115 3.6/197 9.6/095 66.5/102 27.4/116 1.2/162 0.10 W14 0.1/058 4.7/124 3.6/195 10.0/094 66.4/102 27.0/115 1.3/170 0.09 W15 0.5/086 4.2/122 3.5/197 13.0/101 90.3/109 38.3/123 4.3/007 0.06 W17 0.7/089 5.3/118 4.1/200 14.3.103 93.0/118 39.4/134 5.7/290 0.07 W18 0.8/072 5.6/116 3.5/197 15.5/095 104.4/110 45.4/128 8.6/293 0.06 W19 1.0/094 5.6/116 3.7/197 11.5/092 79.7/102 33.9/117 1.8/242 0.08 W20 1.1/094 5.5/114 3.4/200 13.3/092 91.2/106 39.5/122 3.5/287 0.07
a
b
Figure 6 – Cotidal lines of a) amplitude (top panel) and b) phase (bottom panel) showing a progressive amplification and delay of M2
Figure 7 – Simultaneous tidal records in 5 stations located between the ocean and Ba´ıa de Iguape (station 18), showing the
tidal wave amplification and distortion inside the BTS. See Figure 2 for the station locations.
across the delta enhancing friction and retarding the ebb flow. As a result, rising spring tides can be as short as 5 hours and time lags between Cachoeira and Ba´ıa de Iguape are 1 hour at high tide and 3 hours at low tide. Tables 2 and 3 show the growth of M4as
a result of increasing the tidal asymmetry.
The analysis of the year-long time series from Salvador shows maximum tidal ranges of 2.7 m during an equinoctial-spring tide. The use of a low-pass filter with a cut-off of 72 h revealed about 27 long-period waves up to 20 cm in height with an average period of 12 days. This period is coincident to a 13 days-cycle highligh-ted by the spectrum analysis of the tide series. These waves were superimposed to a longer period oscillation of 9-10 months with amplitude of 7 cm. The highest and lowest mean sea levels were found to occur during May and October, respectively.
Sub-inertial oscillations during the summer and winter sam-pling periods had heights of 10 and 17 cm respectively (Fig. 8a,b). The degree of coupling between the shelf and bay oscillations was higher during the winter (with more frequent southerly winds) when at least two waves up to 18 cm in height and a period of 5-6 days could be observed both along the shelf and inside the bay. In the summer (easterlies prevailing winds) the mean sea level trend in the shelf (two oscillations) is matched by the trend observed in the eastern half of the bay (station 19). It becomes, however, quite different from the pattern observed in the most inland stations (18 and 20) where an almost continuously rising trend existed.
At Ba´ıa de Iguape (station 18) the oscillation (4 cm in height) between January 23 and 26 was apparently caused by a river flood that began on the 23rd and reached a discharge peak of 1512 m3s-1on January 25, 1999.
Tidal currents
The currents inside the BTS (stations 1-8 and 15-21) are clearly tide driven. The correlation coefficient and the variance explana-tion between the predicted and observed currents, for the com-ponent closer to the orientation of the main axis, are above 0.90 and 86%, respectively (Table 4). These numbers decrease as a function of the increasing distance from the bay mouth, reaching values as low as of 0.23 and 4.9% at station 14 during winter. Figure 9 and Figure 10 show the current time series at stations 17 (inside Canal de Itaparica), 13 and 14 (both outside BTS) for summer and winter, respectively. The tidal signal at station 17 is obscured at station 13 (in line with Canal de Salvador) and beco-mes indiscernible at station 14, mainly in the winter.
Harmonic analysis of the current field inside the BTS (Tables 5 and 6) shows vector Form numbers smaller than 0.19, which characterize the tidal currents as semi-diurnal (Pond & Pickard, 1983). For some stations outside the BTS, such as station 13, the tidal currents are mixed with semi-diurnal predominance, resul-ting in inequalities between the currents during the highs and lows
Figure 8 – Time series of the sub-inertial elevation variation for some stations in and outside the bay during a) summer and b) winter.
for each day. At station 14, the tidal currents are still mixed, but here they have diurnal predominance, with vector Form numbers close to 2.4 (the magnitude of the O1and K1tidal ellipses are very
small and of order of few cm s-1only). M
2and S2tidal ellipses
in both seasons are shown in Figure 11. In general, the ellipses are oriented along the main channels of the bay and eccentricity tends to be small. For the locations where the water column was sampled in two depths, the orientation of the ellipses did not vary more than a few degrees. Apart from station 15 (located at Canal
de Madre de Deus in Figure 2), vertical shear was not significant. Maximum current velocities occur at the two entrances of the bay, Canal de Salvador (station 8) and Canal de Itaparica (station 17), where the M2component close to the surface had
magnitu-des of 65 cm s-1and 51 cm s-1, respectively. The S
2component
had values of 28 cm s-1and 24 cm s-1for these same locations.
Other regions of relatively intense flow were the center of the bay (station 5), with magnitudes of 35 cm s-1for M
2and 17 cm s-1
magni-Figure 9 – Time series of the current vectors at stations 13 (top), 14 (middle) and 17 (bottom) during the summer and according to the location map presented
in Figure 2. The vectors are related to the true north.
Figure 11 (continued) – Figures (c) and (d) are the same as in (a) and (b), but for the winter. Solid lines indicate
either a single current meter or the near surface current meter, while dashed lines represent the near bottom instruments. All the ellipses are drawn to the same scale.
Table 4 – Correlation coefficient and percentage of variance explanation between the predicted time series (based on the harmonic
analysis) and the observed currents. The analysis are made in terms of U (east-west oriented) and V (north-south) components of ve-locity. The orientation angle for the major axis (M axis) is related to true north and rotates clockwise. Single instrument moorings had the current meter located at mid-depth, while the others had surface (S) and bottom (B) instruments located at 15% and 85% of the water depth.
Site
Summer Winter
U comp. V comp.
M axis U comp. V comp. M axis
Var % c. coef. Var % c. coef. Var % c. coef. Var % c. coef.
01 65.6 0.78 96.9 0.98 177 44.1 0.64 98.2 0.98 176 02 S 90.7 0.94 99.1 0.99 162 79.1 0.87 95.6 0.97 161 B 87.6 0.93 96.9 0.99 164 73.2 0.85 96.1 0.97 172 03 S 99.0 0.98 84.4 0.91 108 95.9 0.98 89.9 0.95 118 B 95.6 0.97 81.4 0.89 110 91.8 0.97 79.8 0.90 110 05 SB 98.998.8 0.990.98 99.796.9 0.980.99 122135 95.396.0 0.980.98 92.491.9 0.960.96 126123 06 S 42.9 0.65 94.2 0.96 170 38.3 0.59 86.4 0.90 170 B 60.7 0.76 93.6 0.97 165 23.9 0.48 90.6 0.93 175 07 S 59.2 0.76 97.9 0.98 6 44.8 0.65 96.0 0.97 5 B 44.8 0.66 98.8 0.98 174 55.8 0.75 92.4 0.97 168 08 S 30.5 0.46 99.9 0.99 0 58.6 0.77 97.3 0.99 5 B 55.1 0.70 99.2 0.99 4 27.6 0.52 97.9 0.99 2 09 S 85.4 0.92 73.0 0.85 103 82.4 0.91 66.6 0.81 106 B 88.7 0.94 50.2 0.68 100 38.1 0.62 19.8 0.45 115 10 SB 98.397.2 0.990.98 97.787.8 0.980.92 100108 96.0– 0.98– 92.4– 0.96– 108– 11 S 66.4 0.81 30.5 0.52 69 54.0 0.72 19.4 0.39 80 B 79.0 0.89 24.3 0.46 85 – – – – – 12 S 44.6 0.66 43.9 0.66 73 36.1 0.58 52.1 0.71 86 B 84.2 0.92 73.2 0.85 124 – – – – – 13 24.7 0.50 52.1 0.69 44 9.9 0.29 25.1 0.48 50 14 12.1 0.34 8.7 0.29 42 3.7 0.17 4.9 0.23 37 15 SB 98.495.6 0.990.98 80.284.7 0.920.88 107101 95.197.0 0.970.99 89.586.5 0.920.92 106108 16 80.8 0.91 92.2 0.96 23 77.5 0.87 90.8 0.94 21 17 46.8 0.59 97.8 0.99 178 29.9 0.51 96.4 0.98 177 21 – – – – – 81.6 0.88 96.4 0.97 18
tudes near surface were 46 cm s-1and 21 cm s-1, respectively.
Since data was collected in two different periods, the current va-lues presented in the text refer to an average between the summer (Table 5) and winter values (Table 6). Considerable vertical shear occurs at station 15 (local depth of 25 m), with near-surface flow about 40% higher than the flow near the bottom (32 cm s-1for
M2and 16 cm s-1for S2). Apart from these locations, the strength
of the flow throughout the bay (stations 1 to 3, 6, 7 and 16) was generally moderate with the M2and S2components ranging from
12 cm s-1to 28 cm s-1and 5 cm s-1to 17 cm s-1, respectively.
Outside the BTS, moderate tidal currents were restricted to stati-ons 9 to 12, where M2component was higher than 13 cm s-1. At
station 10, flow canalization between the coast and the ebb tidal delta gave rise to M2component of 62 cm s-1at the surface.
Du-ring the summer, where data was collected in two different depths, a significant vertical shear was observed, with near bottom current velocities 50% smaller than those observed at the surface. Away from the bay, the tidal influence was only of significance at sta-tion 13 (velocity up to 8.5 cm s-1for M
2), apparently due to its
Table 5 – Summary of the harmonic analysis (O1, K1, M2, S2components) for the velocity field during the summer sampling period. M and m are the amplitude (cm s-1) of the major and minor axes, respectively, G is the Greenwich phase andθ is the direction of the major axis (relative to true north and clockwise). The last column is the associated vector Form number given by the ratioF = (K1+ O1)/(M2+ S2).
Site O1 K1 M2 S2 Form Number
M/m ◦G/◦θ M/m ◦G/◦θ M/m ◦G/◦θ M/m ◦G/◦θ S1 2.0/0.3 074/358 1.8/0.3 284/133 21.5/4.9 031/355 6.9/3.4 254/198 0.13 S2 S 1.8/0.8 236/126 2.1/1.0 275/133 24.4/0.0 029/342 10.4/1.3 031/342 0.11 B 2.4/1.3 217/132 2.4/0.6 292/127 20.2/3.2 018/345 6.7/1.6 026/348 0.18 S3 S 1.1/0.5 066/097 0.6/0.1 197/103 22.6/0.7 208/292 10.1/0.8 224/278 0.05 B 1.6/1.2 246/306 0.7/0.1 055/290 20.9/0.8 181/291 12.0/0.2 232/291 0.07 S5 S 3.4/0.4 070/351 2.2/0.8 113/354 37.2/0.0 045/313 14.7/1.8 064/316 0.11 B 2.3/0.5 197/109 3.2/0.1 312/115 35.5/2.1 023/301 17.3/0.3 046/305 0.10 S6 S 1.8/0.8 225/213 0.4/0.2 036/265 12.7/0.9 021/345 5.0/0.6 217/182 0.12 B 1.7/0.5 310/064 2.1/1.1 006/057 14.2/1.0 011/352 5.6/2.1 205/127 0.19 S7 S 1.8/0.0 090/200 0.9/0.3 321/008 26.5/0.1 039/187 14.8/0.1 236/005 0.06 B 1.5/0.1 035/156 1.2/0.1 219/199 24.9/0.7 038/173 11.6/0.2 062/177 0.07 S8 S 4.0/0.7 225/204 2.2/0.5 326/181 67.0/2.1 033/000 28.3/1.3 047/359 0.06 B 3.0/0.4 061/321 1.4/0.2 168/315 46.4/1.8 208/184 20.0/0.8 049/006 0.07 S9 S 3.3/0.3 340/246 1.8/0.2 001/260 24.1/4.3 215/107 11.7/1.5 206/100 0.14 B 1.4/0.9 210/093 1.0/0.5 038/081 19.5/0.8 197/100 7.5/0.8 201/106 0.09 S10 S 1.7/0.1 323/280 0.6/0.0 255/145 58.8/2.8 186/108 21.6/0.6 008/289 0.03 B 2.5/0.4 342/282 0.8/0.1 279/106 32.5/1.8 357/279 16.0/1.0 010/285 0.07 S11 S 2.8/0.8 140/033 2.5/0.7 302/257 15.9/1.7 219/084 10.2/1.2 226/068 0.20 B 2.3/1.1 171/123 0.8/0.4 198/281 13.4/2.9 209/084 6.1/0.4 209/095 0.16 S12 S 1.7/0.7 049/229 1.8/0.3 038/295 14.9/4.2 194/125 5.8/2.0 213/115 0.17 B 2.0/0.5 025/337 1.8/0.3 188/306 14.8/1.0 206/123 6.9/0.4 207/127 0.17 S13 3.6/0.2 322/094 2.1/0.3 007/096 8.5/2.6 006/030 3.2/0.1 211/200 0.49 S14 3.6/0.4 217/046 2.7/0.0 257/043 1.5/0.1 031/258 1.1/0.7 251/221 2.44 S15 S 0.6/0.2 360/160 0.9/0.2 250/152 43.6/0.1 027/280 17.7/0.9 206/104 0.03 B 0.5/0.1 025/012 0.4/0.2 143/278 31.5/0.5 205/108 13.7/1.2 203/105 0.02 S16 0.8/0.2 352/035 0.6/0.1 253/182 16.1/0.8 206/203 6.7/0.1 207/201 0.06 S17 0.8/0.2 258/032 1.0/0.1 190/177 55.5/0.6 303/358 22.9/0.9 297/357 0.02
The tidal wave behaved as a standing wave throughout the bay. A departure from a standing wave propagation was observed at station 7, at the entrance of Canal de Itaparica, where two velo-city peaks occurred during the rising tides (except at neaps). The second, and strongest, velocity peak was ascribed to the inun-dation of relatively high intertidal areas along Canal de Itaparica. As observed by Lessa (2000) in macrotidal estuaries, the inunda-tion of large intertidal areas late in the rising tide causes a sharp increase of the tidal prism and flow acceleration.
In accordance with the pattern of tidal elevation asymmetry, predicted tidal currents were clearly ebb orientated in most of the stations, exceptions being stations 2, 16, 15 and 21, where stron-ger currents were flood orientated. The ratio between maximum ebb to maximum flood currents at stations 17, 7, 5, and 8 varied between 1.09 (station 5 in the winter, vebb= 50 cm s-1) and 1.43
(station 17 in the summer, vebb= 110 cm s-1). At the bay mouth
(station 8), maximum ebb-currents (114 cm s-1) were up to 1.33
Table 6 – Same as Table 5, but for the winter sampling period.
Site O1 K1 M2 S2 Form Number
M/m ◦G/◦θ M/m ◦G/◦θ M/m ◦G/◦θ M/m ◦G/◦θ W1 1.0/0.2 124/050 1.2/0.5 113/061 21.6/4.4 032/356 10.6/1.5 045/354 0.07 W2 S 1.5/0.1 059/018 1.1/0.7 015/174 22.6/0.9 035/340 10.8/0.0 045/343 0.08 B 1.3/0.2 238/210 1.0/0.4 120/076 22.5/5.9 028/350 11.1/2.9 031/352 0.07 W3 S 1.4/0.2 356/114 0.5/0.0 276/312 27.7/2.5 218/296 14.3/0.7 212/302 0.05 B 0.6/0.1 032/093 1.2/0.4 229/278 23.0/0.1 009/110 12.2/0.1 036/110 0.05 W5 S 1.8/0.7 204/162 1.5/0.3 173/279 32.5/3.3 225/124 17.2/0.1 240/128 0.07 B 1.2/0.2 250/307 0.4/0.3 035/064 36.5/4.1 017/304 18.6/0.6 038/300 0.03 W6 S 1.6/0.3 218/146 0.7/0.0 303/167 11.7/2.4 037/348 6.7/0.5 033/346 0.13 B 1.4/0.1 009/245 1.6/0.0 328/240 15.3/2.4 176/172 5.9/1.3 012/339 0.14 W7 S 1.6/0.1 202/010 1.5/0.2 279/360 27.2/1.1 226/003 17.0/0.5 238/007 0.07 B 1.1/0.3 179/350 1.3/0.0 270/006 23.5/0.1 037/171 15.7/0.6 239/347 0.06 W8 S 2.0/0.6 256/193 2.0/0.0 302/225 62.6/2.2 032/005 27.7/1.3 046/005 0.04 B 4.1/0.6 020/008 1.8/0.5 038/046 68.4/4.9 038/001 32.9/1.0 051/003 0.06 W9 S 2.5/0.4 333/284 1.8/0.4 185/251 26.8/3.0 205/109 11.1/1.2 213/108 0.11 B 4.6/1.9 009/246 8.2/1.6 308/091 28.3/4.3 205/122 11.1/0.2 034/307 0.32 W10 S 5.5/0.3 327/286 2.2/0.3 137/287 66.0/1.1 187/107 25.7/0.2 193/110 0.08 W11 S 3.5/0.9 169/088 2.4/0.1 002/087 15.3/3.8 215/094 7.3/0.0 214/088 0.26 W12 S 2.8/1.1 360/286 0.8/0.4 145/234 15.9/1.6 022/321 6.6/0.6 206/129 0.16 W13 1.5/0.7 080/017 1.7/0.4 121/108 6.2/0.7 208/154 5.1/2.9 356/033 0.28 W14 3.0/0.1 230/189 1.2/0.2 047/208 1.2/0.1 276/182 0.6/0.2 036/332 2.37 W15 S 1.4/0.3 150/128 1.2/0.1 091/286 48.6/0.8 211/105 23.9/0.1 031/286 0.04 B 1.1/0.4 287/260 0.5/0.2 128/300 32.3/2.3 209/109 17.9/1.4 220/106 0.03 W16 0.4/0.1 159/107 0.9/0.3 173/026 18.2/0.7 209/200 9.5/0.3 219/201 0.05 W17 0.9/0.2 212/350 1.2/0.1 343/360 46.7/0.2 132/178 25.6/0.5 128/176 0.03 W21 1.0/0.8 357/330 1.2/0.3 107/052 23.2/1.1 206/200 10.4/0.4 224/197 0.07 Residual circulation
The residual circulation inside the bay over a 15 day period is pre-sented in Figure 12 and shows a similar pattern for both summer and winter periods. As a result of the dominance of the tidal for-cing, the velocities did not exceed 5 cm s-1(a parcel moving with
this speed would advect substances as far as 65 km over this pe-riod). At the northern part of BTS, significant flow occurred only at Canal de Madre de Deus (station 15), where both current meters registered northwest currents of order of 5 cm s-1and at Ba´ıa de
Aratu (station 3), where the residual flow was towards the bay at both depths. Residual velocities found at stations 16 and 2, inside the channels leading to Ba´ıa de Aratu and Ilha de Madre de Deus, also registered northward bound residual flows.
The residual circulation at station 5 is characterized by near-surface currents opposing the direction of the near-bottom cur-rents, both in the summer and winter. The flow was directed
down-bay close to the surface and up-down-bay near the bottom, with velo-cities of order of 5 cm s-1. This suggests a permanent pattern in
this area that is likely related to gravitational circulation. A sligh-tly similar pattern was observed at station 8 in the summer, with near-surface and near-bed currents offset by about 120◦.
South bound residual currents were recorded by all current meters at stations 7 and 17, inside the Canal de Itaparica, with velocities up to 6 cm s-1 at station 17. These residual vectors
suggest that a possible anti-clockwise residual flow could exist around Ilha de Itaparica.
In the inner shelf, the residual circulation is clearly seasonal and the winds may be ascribed to as an important mechanism for driving the currents. Exceptions are the channel areas between the mainland and the ebb-tide delta at station 10 where strong resi-dual currents flowed towards the bay in both seasons (15 cm s-1
Figure 12 – Residual velocities during (a) summer and (b) winter. Tick line vectors represent either a single current
meter or the near surface current meter, whereas the narrow line vectors represent the near bottom instrument. Vector scales of 5 cm s-1and 10 cm s-1are drawn at the upper right part of the panels.
flow was persistently directed to the northeast. In this later case, however, the velocity varied significantly between seasons, being more intense during winter.
For the other locations, a change in the predominant wind direction, from easterlies during summer to southerlies during winter (Table 1), forced a change in the residual current direc-tion. These changes are ascribed to the more frequent arrival of cold fronts in winter (e.g., Chaves, 1999; Amorim, 2005). Near-bottom currents in the summer period were weaker than those near the surface at stations 10 to 12, indicating a significant velocity shear in the water column (those near-surface currents were above 15 cm s-1and more than three times larger than the near-bottom
currents). The onshore flow close to the bottom at these locati-ons and the strong near surface flow towards southwest may be an indication of an upwelling favorable system during this sea-son. At station 14, the mid-depth current also agreed with this summertime southwestward circulation showing a magnitude of 7 cm s-1. The lack of near-bottom current estimates at stations 11
and 12 during winter prevented any comparison with the summer-time observations.
Water properties
In the summer (Tables 7 and 8), the largest difference in the mean surface temperature (3◦C) occurred during the spring tide, between the warmest surface waters of the most inland point (sta-tion 1, T = 29.9◦C) and the relatively colder surface waters at the ocean stations (stations 9 to 12, 26.9◦< T < 27.3◦C). Along the water column, mean temperature differences were less than 1◦C for most stations inside the bay, but reached 1.7◦C outside the bay at station 12 (Table 7). Temperature standard deviations for all stations were also of order of few decimals of a degree.
Mean salinity in the shelf was always above 37, with negligi-ble vertical gradients. The bay was dominated by oceanic water with mean salinities higher than 36.4 and very little vertical va-riation. The only exception was station 4 (in front of the Canal do Rio Paraguac¸u), which presented a surface mean salinity of 35.6. Very high salinities were found at station 3, inside Ba´ıa de Aratu (see Figure 2), where relatively high evaporation rate may occur, as suggested by the mean temperatures being higher than the surrounding stations.
In the winter period (Tables 9 and 10), the temperature was quite homogeneous in the water column and differentiated little among the stations in and outside the bay. The maximum diffe-rence in the mean surface temperature was 0.7◦C (Table 9) and the largest vertical difference was 0.3◦C at station 12. On the
other hand, the horizontal variation of the surface mean salinity varied up to 4.2 (Table 10) between the inland most station and the ocean. This is clearly related to the higher winter precipitation rates along the coast. Vertical salinity gradients were also more pronounced, with differences of more than 1 between surface and bottom in various stations inside the bay.
Figure 13 shows the vertical and horizontal salinity and tem-perature variations (mean± one standard deviation) along a line through the center of the bay connecting stations 4, 5 and 8. It shows gradual changes along this line and different spatial trends between these fields. Whereas the temperature increased up-bay both in the summer and the winter, salinity decreased. Moreo-ver, larger horizontal and vertical variations occurred during sum-mer for temperature and during winter for salinity. If one standard deviation is considered, maximum temperature and salinity va-riations between any point in water column at stations 8 and 4 can be 2◦C (summer) and 3◦C (winter), respectively. Seasonally, maximum salinity variation in the water column was about 2.2 at station 8, 3.2 at station 5 and 3.9 at station 4. For these respec-tive stations, maximum seasonal temperature variation was close to 2.4◦C, 3.2◦C and 3.6◦C.
SUMMARY AND DISCUSSION
Based on the available data analyzed, the hydrodynamics of the study region was clearly separated in two different systems, the BTS itself and the connected inner shelf. Different seasonal scena-rios regarding water properties and circulation patterns were also observed. Inside the BTS, the circulation was mostly tide driven throughout the year, but water properties did change noticeably between summer and winter.
During the summer (dry season), the water inside the bay was considerably warmer than the oceanic waters in the adjacent con-tinental shelf, and horizontal temperature variations between the two regions could be as large as 3◦C. The surface temperature could be as high as 30◦C at the northernmost part of the BTS. Horizontal salinity variations in the dry season were not pronoun-ced and surface waters below 36 were only found at the mouth of Rio Paraguac¸u (mean of 35.6). A still largely sediment-infilled bay, along with small precipitation rates within a semi-arid cat-chment area corresponding to 95% of the total, allows for high water salinities to be observed in the eastern half of the bay. The waters on the inner shelf had surface salinity above 37. According to Emilson (1961), the water mass in the BTS (and along the as-sociated shelf) during the summer could be classified as Tropical Water – TW (temperatures above 20◦C and salinities above 36).
Table 7 – Mean temperature and salinity and± 1 standard deviation for the stations where water properties
were collected during a complete tidal cycle (neap situation) for the summer sampling period. The water depths are surface and bottom (local depth is between parenthesis).
Site Temperature (
◦C) Salinity
Surface Bottom Surface Bottom
S1 29.9± 0.22 29.6± 0.09 (6 m) 36.6± 0.04 36.6± 0.03 (6 m) S2 29.7± 0.29 29.1± 0.16 (13 m) 36.8± 0.04 36.9± 0.06 (13 m) S3 30.0± 0.36 29.6± 0.04 (26 m) 37.1± 0.03 37.2± 0.05 (26 m) S4 29.8± 0.28 29.4± 0.03 (16 m) 35.6± 0.22 36.2± 0.04 (16 m) S5 29.4± 0.27 28.6± 0.10 (26 m) 36.6± 0.08 36.8± 0.01 (26 m) S6 29.2± 0.23 28.5± 0.03 (22 m) 36.9± 0.01 36.8± 0.02 (22 m) S7 29.2± 0.26 28.8± 0.09 (31 m) 36.7± 0.01 36.7± 0.01 (31 m) S8 28.4± 0.32 28.1± 0.07 (38 m) 37.0± 0.07 37.0± 0.03 (38 m) S9 27.7± 0.14 27.2± 0.25 (28 m) 37.0± 0.04 37.2± 0.01 (28 m) S10 27.8± 0.20 27.3± 0.21 (18 m) 37.1± 0.03 37.2± 0.02 (18 m) S11 28.0± 0.35 27.0± 0.19 (28 m) 37.2± 0.06 37.2± 0.03 (28 m) S12 27.9± 0.27 26.2± 0.14 (34 m) 37.2± 0.01 37.2± 0.01 (34 m)
Table 8 – As in Table 7, but during a spring tidal cycle.
Site Temperature (
◦C) Salinity
Surface Bottom Surface Bottom
S1 29.9± 0.44 29.6± 0.21 (6 m) 36.4± 0.03 36.4± 0.03 (6 m) S2 29.4± 0.24 28.8± 0.07 (14 m) 36.8± 0.09 36.8± 0.08 (14 m) S3 29.3± 0.23 29.1± 0.09 (30 m) 37.0± 0.01 37.0± 0.03 (30 m) S4 29.7± 0.26 29.2± 0.24 (18 m) 35.6± 0.21 36.2± 0.16 (18 m) S5 29.1± 0.31 28.5± 0.14 (29 m) 36.4± 0.13 36.7± 0.06 (29 m) S6 28.9± 0.22 28.3± 0.07 (23 m) 36.8± 0.04 36.8± 0.01 (23 m) S7 28.9± 0.26 28.7± 0.04 (30 m) 36.6± 0.03 36.6± 0.03 (30 m) S8 28.0± 0.42 27.7± 0.09 (38 m) 36.9± 0.09 37.0± 0.06 (38 m) S9 26.9± 0.26 26.2± 0.33 (25 m) 37.1± 0.07 37.2± 0.03 (25 m) S10 27.1± 0.21 26.5± 0.31 (19 m) 37.1± 0.05 37.2± 0.05 (19 m) S11 27.0± 0.32 25.9± 0.06 (29 m) 37.2± 0.02 37.3± 0.01 (29 m) S12 27.3± 0.26 26.0± 0.24 (31 m) 37.2± 0.02 37.2± 0.02 (31 m)
During winter (wet season), the horizontal temperature varia-tion between the ocean and the bay was reduced to less than 1◦C (surface mean temperatures varying from 26.5◦C to 27.1◦C). On the other hand, the horizontal salinity difference increased, with values as large as 4. For the northernmost part of the BTS, the surface mean salinity could be as low as 32.3, while values above 36 were found at the inner shelf. This less salty and relatively cold waters found inside the BTS gave rise to a so called coastal water mass (CW), that inhibited the penetration of TW into the bay. This CW was observed in the inner shelf (stations 9, 10, 11 and 12)
with thickness varying from 5 to 10 m.
The seasonal formation of CW appears to be entirely rela-ted to the discharge of the smallest catchments areas around the bay (as well as direct precipitation), since the discharge from Rio Paraguac¸u reaches its lowest value between May and July. The average monthly discharges from Rio Paraguac¸u in January and May 1999 were 9.9 m3s-1and 11.3 m3s-1, respectively. Extreme
discharges from Rio Paraguac¸u are, however, likely to affect the salinity structure as far as station 4. Genz et al. (2006) monitored a simulated 8-day flood event with water being released by Pedra do
Table 9 – As in Table 7, but during the winter sampling period.
Site Temperature (
◦C) Salinity
Surface Bottom Surface Bottom
W1 26.8± 0.21 26.7± 0.08 (7 m) 32.7± 0.22 33.0± 0.16 (7 m) W2 26.7± 0.18 26.6± 0.04 (11 m) 33.7± 0.15 34.5± 0.26 (11 m) W3 27.1± 0.24 26.9± 0.06 (30 m) 33.4± 0.22 34.1± 0.12 (30 m) W4 26.7± 0.12 26.6± 0.04 (13 m) 32.7± 0.20 34.2± 0.07 (13 m) W5 26.6± 0.14 26.5± 0.00 (29 m) 33.7± 0.12 34.9± 0.03 (29 m) W6 26.7± 0.10 26.6± 0.00 (23 m) 34.3± 0.02 34.9± 0.03 (23 m) W7 26.6± 0.14 26.5± 0.01 (26 m) 33.2± 0.48 34.6± 0.04 (26 m) W8 26.4± 0.14 26.5± 0.02 (34 m) 35.0± 0.15 35.3± 0.07 (34 m) W9 26.6± 0.15 26.5± 0.02 (30 m) 35.8± 0.08 36.6± 0.02 (30 m) W10 26.5± 0.11 26.5± 0.01 (19 m) 35.7± 0.15 36.2± 0.46 (19 m) W11 26.6± 0.17 26.5± 0.03 (30 m) 35.7± 0.10 36.7± 0.04 (30 m) W12 26.5± 0.18 26.6± 0.08 (33 m) 35.8± 0.13 36.8± 0.10 (33 m)
Table 10 – As in Table 8, but during the winter sampling period.
Site Temperature (
◦C) Salinity
Surface Bottom Surface Bottom
W1 27.0± 0.35 26.6± 0.06 (7 m) 32.3± 0.36 33.5± 0.30 (7 m) W2 26.7± 0.12 26.6± 0.04 (12 m) 33.7± 0.28 34.4± 0.31 (12 m) W3 26.9± 0.23 26.8± 0.06 (30 m) 32.4± 0.54 34.2± 0.11 (30 m) W4 27.1± 0.32 26.7± 0.10 (12 m) 33.1± 0.21 33.9± 0.23 (12 m) W5 26.7± 0.20 26.6± 0.01 (29 m) 33.3± 0.52 34.7± 0.16 (29 m) W6 26.6± 0.12 26.5± 0.02 (24 m) 34.2± 0.08 34.8± 0.09 (24 m) W7 26.7± 0.12 26.6± 0.07 (12 m) 34.2± 0.11 34.3± 0.07 (12 m) W8 26.5± 0.12 26.5± 0.05 (37 m) 35.1± 0.34 35.7± 0.30 (37 m) W9 26.8± 0.27 26.8± 0.07 (40 m) 36.3± 0.14 37.0± 0.06 (40 m) W10 26.7± 0.13 26.6± 0.05 (18 m) 36.1± 0.22 36.6± 0.08 (18 m) W11 26.7± 0.28 26.8± 0.03 (29 m) 36.4± 0.14 36.9± 0.01 (29 m) W12 26.7± 0.25 27.0± 0.04 (39 m) 36.5± 0.15 37.1± 0.03 (39 m)
Cavalo dam, with a maximum discharge of 1534 m3s-1(15 times
the pre-dam average discharge). The maximum discharge coinci-ded with high water spring (3.3 m tide range in Ba´ıa de Iguape) and caused a surge of 0.5 m close to the river mouth inside the Ba´ıa de Iguape. This surge was imperceptible at the gauging station in S˜ao Roque (see location in Figure 1). The salinity field, however, was influenced along the whole extent of Canal do Paraguac¸u. A well-mixed water column (vertical salinity variation of 0.3), with surface value of 32.4 at the end of the channel, became partially mixed (vertical variations of 5.2), with surface salinity of 27.2. In scenarios like this, the Ba´ıa de Iguape and secondarily the Canal do Paraguac¸u, act as a buffer region against the Rio Paraguac¸u floods. Short-lived river floods are almost completely damped
inside the bay. Surface salinity gradients, reaching up to 8 psu km-1 during a flood event, were found inside the Ba´ıa de Iguape (Genz et al., 2006).
An estimate of the flushing time for the innermost station where CTD profiles were performed (stations 1 and 4 in Fig. 2) was done analytically based on the conservation of salt and vo-lume (Miranda et al., 2002) and according to the equation
Tf = [(S0− ¯S)/S0](V/Qf).
S0and ¯S represent salinity at the oceanic and innermost
sta-tions, respectively. V is the volume of the bay associated with the flushing process, which is equal to 1.1 × 10¹⁰ m3
Figure 13 – Schematic representation of vertical profiles for the mean (thick line) temperature and salinity during summer
and winter at Rio Paraguac¸u mouth (station 4), in the center of the BTS (station 5) and at the entrance of the bay (station 8) for a complete tidal cycle (13 hours). The gray areas represent± 1 standard deviation from the mean value.
¯S and Qf for January (May) 1999 are 37.2 (36.2), 35.6
(32.5) and 89.0 (345.5) m3 s-1, respectively. These
para-meters indicate that due to the small freshwater inflow, the flushing time in summer (∼62 days) is about 1.7 times longer than that in winter (∼38 days).
When compared to other relevant coastal bays in Brazil, the BTS is likely to be the one with the longest flushing time, given its high ratio between volume and freshwater discharge (0.32× 10⁸
s< V/Qf < 1.2 × 10⁸s for the central area of the bay). For
example, Ba´ıa de Guanabara, according to Kjerfve et al. (1997), has aV/Qf ratio twice as small, varying from 0.12× 10⁸s to
0.67× 10⁸s in the dry and wet season, respectively. AV/Q
f
ratio of 0.12× 10⁸s was also estimated for Ba´ıa de Paranagu´a,
considering a year average freshwater input of about 200 m3s-1
(Lessa et al., 1998; Mantovanelli et al., 2004). Due to the large flushing times it is recommended that proper management poli-cies regarding the disposal of urban and industrial waste into the BTS must be adopted.
The total freshwater inflow into the BTS was reduced after the construction of Pedra do Cavalo dam (mean annual discharge dropped from 199 m3s-1to 162 m3s-1). This reduction,
howe-ver, is not entirely related to the effects of the dam, since the inflow was also diminished during the winter when Rio Paraguac¸u would normally account for less than 30% of the total freshwater input. Longer trends (20-30 year cycles) in precipitation and river
dis-charges, as pointed out by Pekarova et al. (2003) are more likely to be the reason for the observed reduction of the fresh water in-flow into the BTS after 1985.
While the circulation did not vary significantly between sea-sons inside the bay, a clearly seasonal pattern was observed at the associated inner shelf. During the summer, the easterly winds drove sub-inertial currents parallel to the coastline and towards southwest mostly, except for the station in front of Canal de Ita-parica. The near bottom onshore flow (stations with two current meters) associated with the presence of relatively cold waters at the bottom (when compared to the values found during the win-ter) is an indication of an upwelling process. In the winter, the arrival of cold fronts and the associated reversal of the wind di-rection generated events of northeast currents which, depending on the wind persistence, would dominate the residual circulation. A similar pattern of seasonal circulation was observed by Lessa & Cirano (2006) at the southern coast of Bahia and by Amorim (2005) at about 100 km south of the BTS.
The seasonal variations imposed by the changes in the me-teorological forcing also affect the sub-inertial oscillations in the BTS and at its vicinity. During summer the BTS is less affected by the easterlies and the oscillations in the most inland portion of the bay can be decoupled from those observed at the inner shelf. This could also be caused by the distinct wind patterns (in and outside the BTS) that can occur during this season. On the other
hand, during winter the more frequent arrival of cold fronts and the longer fetch created in the presence of southerly winds give rise to a strong coupling between the sub-inertial oscillations for the waters inside the BTS and those at the inner shelf.
Due to the orientation of the residual current vectors inside the bay, one would feel tempted to suggest that an anticlockwise cir-culation is normally established inside the BTS where water mo-ves northward towards station 15 and returns via Canal de Itapa-rica. However, the spatial density of the current meters deployed inside the bay is far too small, and it is very likely that the resi-dual vectors indicate segments of eddies of much smaller scale. These eddies are normally generated by the interaction of the flow with complex bathymetry and the coastal contours of a water body. Kjerfve et al. (1992) understand that residual circulation gyres arise due to lateral circulation, which in turn are a manifestation of the variability of the current magnitude and direction over short distances. This lateral variability is explained by the presence of prevailing ebb and flood channels within the same cross-section, as demonstrated by Kjerfve & Proehl (1979). Some current me-ters inside the bay might have been deployed in predominantly flood or ebb channels, either enhancing the expected tidal current asymmetry (station 8) or reversing it (station 21). Therefore, the degree of ebb or flood dominance among the stations is highly de-pendable on their location. For instance, strong ebb dominance at station 8 is apparently counterbalanced by flood dominance at the western side of Canal de Salvador, where a small flood-tidal delta in front of Mar Grande (see Figure 2 for location) is clearly map-ped in the depth charts. The overall stronger ebb-tidal currents are in agreement with the pattern of asymmetry of the tidal wave. Ebb-directed bed-load net sediment transport is thus expected in most areas of the bay, especially those close to large intertidal areas. This direction of net-sediment transport is corroborated by the presence of extensive ebb-tidal deltas in front of Canal de Sal-vador (Banco de Santo Antonio) and Canal de Itaparica. Also, an ebb-tidal delta internal to the bay, in front of Canal do Paraguac¸u, is also an indication of bed-load flushing.
Given the vast amount of data available, the main goal of this paper was to provide a general characterization of oceanographic aspects of the BTS and adjacent areas and identify how these as-pects vary during the dry (summer) and the wet (winter) season. Although the circulation driving forces have been described here, several questions remain and need to be elucidated before a satis-factory understanding of the different spatial and temporal scales involved in the physical oceanography of the bay can be achieved. The authors are aware that in this study the region was reasonably well covered in space, but not in time. The temporal coverage (15
days for each season) is far too short for a good description of the seasonality. The results already obtained in this work will be used to plan a more comprehensive observational programs focusing on the study of mass and volume transports for the most impor-tant pathways within the bay, as well as the seasonal variation of the water properties within the BTS and its interaction with the coastal zone. A 3D circulation numerical model is already being implemented to help addressing these questions.
ACKNOWLEDGEMENTS
This work was supported by the projects MARBOBA – CTPE-TRO/CNPq (grant number 502356/2003-0) and SACODE – CT-PETRO/CNPq (grant number 550469/2005-2). Further support was also provided by a Brazilian scientific network called REDE 05/01 – PETRORISCO, funded by CTPETRO/FINEP/CNPq. Gui-lherme C. Lessa was supported by a CNPq research grant. We are thankful to the Environmental Department of the State Govern-ment of Bahia (Centro de Recursos Ambientais) for providing all the data sets related to Projeto Bahia Azul. We also thank the two anonymous referees for their thoughtful comments and the tech-nician Rafael Cabral Carvalho for helping with some figures.
REFERENCES
AMORIM FN. 2005. Caracterizac¸˜ao oceanogr´afica da Ba´ıa de Camamu e adjacˆencias e mapeamento das ´areas de sensibilidade a derrames de ´oleo. M.Sc. Thesis, Curso de P´os-Graduac¸˜ao em Geologia da Universi-dade Federal da Bahia. 163 pp.
ANGULO RJ, LESSA GC & SOUZA MC. 2006. A critical review of mid- to Late-Holocene sea-level fluctuations on the eastern Brazilian coastline. Quaternary Sci. Rev., 25(5-6): 486–506.
ANP. Agˆencia Nacional do Petr´oleo, G´as Natural e Biocombust´ıveis.
2007. Available at: < http:// www.brazil-rounds.gov.br/ geral/ mapas/
JEQ CAL.pdf>. Access on: November 10, 2007.
ANTAQ. Agˆencia Nacional de Transportes Aquavi´arios. 2005. Anu´ario
Estat´ıstico Portu´ario – 2005. Available at: < http:// www.antaq.gov.br/
NovositeAntaq/ estatisticasanuario.asp>. Access on: November 9, 2007.
BITTENCOURT ACDP, DOMINGUEZ JML & USSAMI N. 1999. Flexure as a tectonic control on the large scale geomorphic characteristics of the eastern Brazil coastal zone. J. Coast. Res., 15(2): 505–519.
CASTRO BM & MIRANDA LB. 1998. Physical oceanography of the
wes-tern Atlantic continental shelf located between 4◦N and 34◦S. In:
ROBIN-SON AR & BRINK KH (Ed.). The Sea, John Wiley & Sons, Inc., New York, 11: 209–251.
CEPLAB. 1979. Bacias Hidrogr´aficas do Estado da Bahia. Centro de Pla-nejamento da Bahia, S´eries Recursos Naturais, Salvador, Bahia, 215 pp. CHAVES RR. 1999. Variabilidade da precipitac¸˜ao na regi˜ao Sul do Nor-deste e sua associac¸˜ao com padr˜oes atmosf´ericos. M.Sc. Thesis, Insti-tuto Nacional de Pesquisas Espaciais. 159 pp.
CRA. Centro de Recursos Ambientais. 2000. Saneamento ambiental da Ba´ıa de Todos os Santos. Modelamento e avaliac¸˜ao ambiental. Desen-volvimento de modelos computacionais de circulac¸˜ao hidrodinˆamica, de transporte de contaminantes e de qualidade de ´agua da BTS, e elaborac¸˜ao do seu diagn´ostico. Relat´orio dos estudos b´asicos. Technical Report RT-257-03-GR-002-RF, 248 pp., Centro de Recursos Ambientais, Salvador, Bahia, Brazil.
CRA. Centro de Recursos Ambientais. 2001. Saneamento ambiental da Ba´ıa de Todos os Santos. Modelamento e avaliac¸˜ao ambiental. Desen-volvimento de modelos computacionais de circulac¸˜ao hidrodinˆamica, de transporte de contaminantes e de qualidade da ´agua da BTS. Progn´ostico dos efeitos do Programa Bahia Azul com relac¸˜ao `a balneabilidade das praias. Technical Report RT-257-05-MA-003-RF, 262 pp., Centro de Re-cursos Ambientais, Salvador, Bahia, Brazil.
CUPERTINO JA & BUENO GV. 2005. Arquitetura das seq¨uˆencias estra-tigr´aficas desenvolvidas na fase de lago profundo no Rifte do Recˆoncavo. Bol. Geoc. Petrobras, 13(2): 245–267.
DIAS K. 2004. Reavaliac¸˜ao da distribuic¸˜ao espacial das facies texturais do leito da Ba´ıa de Todos os Santos, Undergraduate Thesis, Curso de Graduac¸˜ao em Geologia da Universidade Federal da Bahia. 50 pp. EMILSON I. 1961. The shelf and coastal waters off Southern Brazil, Bolm. Inst. Oceanogr., S˜ao Paulo, 17: 101–112.
FRANCO AS. 1988. Tides: Fundamentals, Analysis and Prediction, S˜ao Paulo, Fundac¸˜ao Centro Tecnol´ogico de Hidr´aulica, 249 pp.
GENZ F. 2006. Avaliac¸˜ao dos efeitos da Barragem de Pedra do Cavalo sobre a circulac¸˜ao estuarina do Rio Paraguac¸u e Ba´ıa de Iguape. Tese de Doutoramento, Programa de P´os-Graduac¸˜ao em Geologia, Universidade Federal da Bahia, 266 p.
GENZ F, LESSA GC & CIRANO M. 2006. The Impact of an Extreme Flood upon the Mixing Zone of the Todos os Santos Bay, Northeastern Brazil. J. Coast. Res., 39: 707–712.
IBGE. Instituto Brasileiro de Geografia e Estat´ıstica. 2006. Estima-tivas Populacionais para os munic´ıpios brasileiros em 01/07/2006.
Available at: < http:// www.ibge.gov.br/ home/ estatistica/ populacao/
estimativa2006/default.shtm>. Access on: November 9, 2007.
INMET. Instituto Nacional de Meteorologia. 1992. Normais Clima-tol´ogicas – 1961 a 1990. Minist´erio da Agricultura, Pecu´aria e Abas-tecimento. 155 pp.
KING LC. 1956. Geomorfologia da Regi˜ao Oriental do Brasil. Rev. Bras. Geogr., 2: 37–72.
KJERFVE B & PROEHL JA. 1979. Velocity variability in a cross-section of a well-mixed estuary, J. Mar. Res., 37(3): 409–418.
KJERFVE B, SEIM HE, BLUMBERG AF & WRIGHT LD. 1992. Model-ling of the Residual Circulation in Broken Bay and the lower Hawkesbury River, NSW, Aust. J. Mar. Freshw. Res., 43: 1339–1357.
KJERFVE B, RIBEIRO CHA, DIAS GTM, FILIPPO AM & QUARESMA VS. 1997. Oceanographic characteristics of an impacted coastal bay: Ba´ıa de Guanabara, Rio de Janeiro, Brazil. Cont. Shelf Res., 17(13): 1609–1643. LESSA GC. 2000. Morphodynamic controls on tides and tidal currents in two macrotidal shallow estuaries, NE Australia. J. Coast. Res., 16(4): 976–989.
LESSA GC, MEYERS S & MARONE E. 1998. Holocene Stratigraphy in the Paranagu´a Bay estuary, southern Brazil, J. Sediment. Res., 68(6): 1060–1076.
LESSA GC, BITTENCOURT ACSP, BRICHTA A & DOMINGUEZ JML. 2000. A reevaluation of the late quaternary sedimentation in Todos os Santos Bay (BA), Brazil. An. Acad. Bras. Cienc., 72(4): 573–590. LESSA GC, DOMINGUEZ JML, BITTENCOURT ACSP & BRICHTA A. 2001. The tides and tidal circulation of Todos os Santos Bay, north-east Brazil: a general characterization. An. Acad. Bras. Cienc., 73(2): 245–261.
LESSA GC & CIRANO M. 2006. On the Circulation of a Coastal
Chan-nel within the Abrolhos Coral-Reef System -Southern Bahia (17◦40’S),
Brazil, J. Coast. Res., 39: 450–453.
LIMA GMP & LESSA GC. 2002. The freshwater discharge in Todos os Santos Bay and its significance to the general water circulation. Revista Pesquisas. Porto Alegre (RS), 28: 85–98.
MANTOVANELLI A, MARONE E, DA SILVA ET, LAUTERT LF, KLINGEN-FUSS MS, PRATA VP, NOERNBERG MA, KNOPPERS BA & ANGULO RJ. 2004. Combined tidal velocity and duration asymmetries as a determi-nant of water transport and residual flow in Paranagu´a Bay estuary. Estuar. Coast. Shelf Sci., 59(4): 523–537.
MARTIN L, BITTENCOURT ACSP, FLEXOR JM, SUGUIO K & DOMIN-GUEZ JML. 1986. Neotectonic movements on a passive continental mar-gin: Salvador region, Brazil. Neotectonics, 1: 87–103.
MIRANDA LB, CASTRO BM & KJERFVE B. 2002. Princ´ıpios de Oce-anografia F´ısica de Estu´arios, Editora da Universidade de S˜ao Paulo, S˜ao Paulo, 414 pp.
MONTENEGRO AM, FONSECA CA & CAMPOS EJD. 1999. Implemen-tac¸˜ao do modelo oceˆanico da Universidade de Princeton para o estudo da circulac¸˜ao e dispers˜ao de materiais na Ba´ıa de Todos os Santos, PUC, Ci. Biol. e do Meio Amb., 2: 10–18.
PEKAROVA P, MIKLANEK P & PEKAR J. 2003. Spatial and temporal runoff oscillation analysis of the main rivers of the world during the 19th-20th centuries. J. Hydrol., 274(1-4): 62–79.