Universidade do Minho Escola de Engenharia Departamento de Inform ´atica
Master Course in Computing Engineering
Nuno Pereira
Concept Location based on System Dependency Graphs
Master dissertation
Supervised by: Pedro Rangel Henriques Maria Jo ˜ao Varanda
A B S T R A C T
Software maintenance can be seen as the act of correct errors in the software, improve it and/or adding new features. This is one of the most difficult and frequent jobs of a software engineer and one of the most important and expensive parts of software development.
Maintaining software is very complex mainly because before making the change to the program, software engineers need to find the location, or locations, where the changes will be made; in other words, first they need to understand the program. Real applications are always huge and sometimes these programs are old or were written by other person and it is difficult to find the location where the change will be applied. There are various techniques to find these locations minimizing the time spent, but this phase of software development continues to be one of the most expensive and longer.
The objective of this Master Work is to combine Program Comprehension techniques like comment analysis and SDG visualization, creating a tool easy to use, that can simplify and decrease the time spent understanding a program.
R E S U M O
Manutenc¸˜ao de software pode ser vista como o ato de corrigir erros no software, melhor´a-lo e/ou de adicionar novas funcionalidades. Esta ´e uma das tarefas mais frequentes e dif´ıceis de um engenheiro de software e uma das mais importantes e dispendiosas partes do desenvolvimento de software.
Manter um software ´e muito complicado principalmente porque antes de efectuar a alterac¸˜ao do programa, o engenheiro de software precisa de encontrar o local, ou locais, onde a alterac¸˜ao ser´a efectuada, ou seja, primeiro ele precisa de perceber o programa. Por vezes estes programas s˜ao antigos ou foram escritos por outra pessoa e ´e dif´ıcil encontrar o local onde a alterac¸˜ao ser´a feita. Existem muitas t´ecnicas para encontrar estes locais minimizando o tempo despendido, mas esta fase do desenvolvimento de software continua a ser uma das mais caras e demoradas.
O objetivo do presente Trabalho de Mestrado ´e combinar t´ecnicas de Compreens˜ao de Programas tais como an´alise de coment´arios e visualizac¸˜ao do SDG, criando uma ferramenta f´acil de usar, que consiga simplificar e diminuir o tempo despendido a perceber um programa.
C O N T E N T S Contents . . . iii 1 I N T R O D U C T I O N . . . 4 1.1 Objectives . . . 4 1.2 Research Hypothesis . . . 6 1.3 Document structure . . . 6 2 P R O G R A M C O M P R E H E N S I O N: B A S I C C O N C E P T S . . . 8 2.1 Programming Languages . . . 8
2.1.1 Context Free Grammar . . . 8
2.1.2 Attribute Grammars . . . 10 2.1.3 ANTLR . . . 12 2.2 Understanding a Program . . . 13 2.3 Concept Location . . . 14 2.3.1 Information Retrieval . . . 15 2.3.2 Darius. . . 15 2.4 Graphs. . . 18 2.4.1 DOT . . . 20 2.4.2 JGraphX . . . 22 2.4.3 JUNG . . . 25
2.5 System Dependency Graph . . . 26
2.5.1 What is it? . . . 26
2.5.2 Tools that build a System Dependency Graph . . . 27
3 D A R I U S S D G: D E S I G N . . . 30
3.1 Requirements . . . 30
3.2 Architecture . . . 32
4 D A R I U S S D G: D E V E L O P M E N T . . . 34
4.1 Comment Analyser for Concept Location . . . 34
4.2 Building the System Dependency Graph . . . 37
4.3 Designing the System Dependency Graph . . . 42
4.4 Integration. . . 44
4.5 Testing. . . 46
4.5.1 Loading, Analysing and Build SDG . . . 46
4.5.2 Comments . . . 50
Contents
L I S T O F F I G U R E S
Figure 1 Evolution of maintenance costs . . . 4
Figure 2 Representation of one production in an attribute grammar . . . 11
Figure 3 ANTLRWorks interface . . . 12
Figure 4 How Software Reconnaissance works . . . 14
Figure 5 Darius Architecture . . . 16
Figure 6 Darius Graphical User Interface: Comment Statistics tab . . . 17
Figure 7 Darius Graphical User Interface: Words Analyser tab . . . 17
Figure 8 Darius Graphical User Interface: Concept Location tab . . . 18
Figure 9 Directed Graph example . . . 19
Figure 10 Graph generated by a DOT tool . . . 20
Figure 11 A System Dependency Graph . . . 21
Figure 12 A System Dependence Graph . . . 21
Figure 13 Styles that can be drawn with JGraphX . . . 22
Figure 14 Sample graphs made with JGraphx . . . 24
Figure 15 A node inside a node . . . 24
Figure 16 Jung graph example . . . 25
Figure 17 A System Dependency Graph . . . 27
Figure 18 JavaPDG interface. . . 28
Figure 19 Architecture of DariusSDG . . . 33
Figure 20 Darius structure shown by NetBeans . . . 35
Figure 21 How DariusSDG associates comments with methods . . . 36
Figure 22 How DariusSDG associates comments with statements . . . 36
Figure 23 How the SDG Builder saves the CFG of a method . . . 39
Figure 24 How DariusSDG handle DDG objects . . . 42
Figure 25 System Dependency Graph built with JGraphX . . . 43
Figure 26 DariusSDG graphical user interface . . . 44
Figure 27 Excerpt of the Statistics showed by DariusSDG . . . 47
Figure 28 NetBeans window that shows the structure of a test program . . . 47
Figure 29 NetBeans window that shows the methods present in the IRS class . . 48
Figure 30 Detail of DariusSDG that shows the methods present in the IRS class. 48 Figure 31 Graph drawn by DariusSDG that shows a Do While loops . . . 49
Figure 32 Excerpt of a graph drawn by DariusSDG that shows data dependencies edges 49 Figure 33 Search query executed in DariusSDG. . . 51
List of Figures
Figure 34 Behaviour of DariusSDG when a comment is selected . . . 52
Figure 35 How DariusSDG associates a comment that is outside a method and before one. . . 53
Figure 36 How DariusSDG associates a comment that is outside a method and after all methods . . . 53
Figure 37 How DariusSDG associates a comment that is inside a method and before a statement . . . 54
Figure 38 How DariusSDG associates a comment that is inside a method and in the same line as a statement . . . 54
Figure 39 How DariusSDG associates a comment that is inside a method and after all statements . . . 54
Figure 40 DariusSDG Statistics window realtive to DatumBox . . . 55
Figure 41 DariusSDG with DatumBox loaded example . . . 56
L I S T O F E Q U AT I O N S
1 Context Free Grammar representation . . . 9
2 Production representation . . . 9
3 Context Free Grammar example . . . 9
4 Context Free Grammar example with BNF. . . 10
5 Context Free Grammar example with eBNF . . . 10
6 Attribute Grammar representation . . . 10
7 Directed Graph representation . . . 19
L I S T O F TA B L E S
Table 1 Some graph options available in JGraphX . . . 23
L I S T O F L I S T I N G S
2.1 DOT example . . . 20
2.2 Sample code to make two graphs using JGraphX . . . 23
2.3 Excerpt of a Java program . . . 26
4.1 Example method with a Do While loop . . . 49
4.2 Example code that shows a reassignment. . . 50
1
I N T R O D U C T I O N
This document introduces a master work, in the area of Program Comprehension. The development of a thesis and its presentation in the format of a dissertation is a component of the second year of the Master Degree in Informatics Engineering that is held at University of Minho in Braga, Portugal.
1.1 O B J E C T I V E S
”Software Maintenance is defined as the modification of a software product after delivery to correct faults, to improve performance or other attributes or to adapt the product to a changed environment” (Chikofsky and Cross,1990).
Software maintenance is one of the most expensive phases of software development. In Figure1
(extracted from (Engelbertink and Vogt,2010)) we can see that 80% to 95% of the overall costs are spent in maintenance, and half the time spent in software maintenance is to understand the program code and the instructions that have to be changed (Erlikh,2000;Fjeldstad and Hamlen,1983).
Figure 1: Evolution of maintenance costs
These conclusions are easily understandable because before making the change to the program, software engineers need to find the location, or locations, where the changes will be made. These pro-grams tend to be complex and huge, in terms of lines of code and number of files, are usually written by different software engineers with different visions of the problem and different forms of thinking. Moreover, the variables and methods names in the source code may not be explicit and usually these
1.1. Objectives
kind of programs (legacy programs) do not have good or updated documentation (Forward et al.,2002;
de Souza et al.,2005).
There are various techniques to find the locations where the software engineer need t intervene minimizing the time spent searching but the most used techniques consist in navigating through the statement dependencies or searching for keywords that can indicate where the concept is implemented. In the first technique, the software engineer navigates through the dependencies among elements, usually the navigation starts at the main function and a specific path is taken until he finds the desired concept implementation. If the search is not successful, the software engineer must backtrack to the previous point (e.g., class, method or conditional structure) and choose a different path.
The other technique consists in searching for certain keywords in the source code files (related to the change that will be made) that can indicate the location, or locations, where the software engineer needs to intervene.
When the software engineer search in the source code, he is not only searching in the program instructions but also in the comments.
The best documentation for a program includes comments, and software engineers makes a lot (and relevant) comments in the source code wherein about 19% of the source code are comments. Comments can explain source code in a natural language connecting the program domain with the problem domain (Kernighan and Plauger,1978;Forward et al.,2002;de Souza et al.,2005).
Although being the most used, these techniques are used in a very inefficient way.
The process of navigating through dependencies until finding the location that needs intervention is slow and depends on the quality of the code (explicit names) to find the right path.
The process of searching (finding concepts in the source code) can also be improved with other techniques like stemming, which consists in reducing the word to its grammatical root, so when the software engineer search for the keyword sales the program can return other similar words like sold or sell. Also the search could be more ”smart” and find words at any order; so when the software engineer search the terms user options results like options the user have could be returned.
There are very few applications that implement these two techniques (find concepts in the source code comments and navigating through the statements dependencies) in order to speed up the process of program comprehension.
Also, the tools are built focusing one Program Comprehension technique and, until now, there is no application that join these two mentioned techniques. These two techniques complement each other, giving semantic and structural information about the program, joining them in one application can give a much clear vision of the program to the software engineer.
For all these reasons, becomes clear that it is challenging, interesting and useful to create a tool with a friendly interface that allows to perform concept location over a System Dependency Graph (SDG). The main idea is to visualize a dependency graph (control flow and data dependencies) and locate the nodes that can be related to a given term. More than locate a set of hot instructions (based on the associated comments) it will allow to detect the other instructions (the whole method).
1.2. Research Hypothesis
The final objective of the tool proposed in this thesis, named DariusSDG, is to decrease the time spent to locate concepts in source code in order to reduce the cost of maintenance tasks.
Finally, the language that will be our case of study is Java1. Java is one of the most used program-ming languages in the world (TIOBE,2014;LangPop,2013), it supports object-oriented design, has an extensive API, it has web support and many third-party packages. By designing a tool that can analyse Java code we can reach a much broader audience.
1.2 R E S E A R C H H Y P O T H E S I S
As mentioned before, software maintenance is one of the most important, expensive and poorly optimized phase of software development (Stamelos et al.,2002;Brooks,1978;Gosling et al.,2005). The time spent understanding the program can be minimized using techniques of Program Compre-hension.
Hereupon, the objective of this thesis, is to create a tool (DariusSDG) easy to use that can show various kinds of information about a program (structural and semantic) reducing the time spent in program comprehension.
If the time spent to understand a program decreases the software engineer can correct the error, or the implementation of a new feature quicker, reducing costs.
In this context, the research hypothesis underlying the present master work is that it is possible to improve a tool (Darius, previously developed by our Research Group) designed for Concept Location, based on Comment Analysis, with a navigation mechanism supported by the System Dependency Graph.
Although eminently technological, to demonstrate this research hypothesis requires a full under-standing of the main problems in the area of program comprehension and of the two specific ap-proaches (that we wish to combine) in order to find an intelligent schema to integrate them in a useful and effective way.
1.3 D O C U M E N T S T R U C T U R E
This chapter was an introduction to the document, describing the purposes and objectives of this master work. In chapter 2, it is introduced the area of Program Comprehension, some concepts, definitions and techniques which are fundamental to this master work. In the first section of the chapter it is introduced the concept of Programming Language and how it is defined. In the following section we will deepen some the Program Comprehension concepts. The third section of chapter 2
describes in more detail the Concept Location technique as well some tools that perform this kind of search. The next section describe the concepts of graph theory. The chapter ends with an overview of
1.3. Document structure
the System Dependency Graph technique. It also describes and analyses the existing tools that create this kind of graph.
The architecture and design of DariusSDG are described in chapter3.
Chapter 4 is divided in five sections. The first section will explain how the comment analyser for concept location was implemented and used. How the System Dependency Graph was built is explained in the second section and how it was represented is described in the following section. Section four is where the integration between the tools is explained. The last section presents some tests that where made with the tool.
This document ends in chapter5where the conclusions about this master work are made and some improvements are pointed out for future work.
2
P R O G R A M C O M P R E H E N S I O N : B A S I C C O N C E P T S
Program Comprehension is a component of Software Engineering discipline whose principal pur-pose is to study how software engineers understand programs (Storey,2005).
Software Maintenance is one of the most expensive phases of software development (as mentioned in Chapter 1), being that half the time spent doing this task is understanding the program. Aware of this fact, many techniques of Program Comprehension were created to streamline this phase of software development. This chapter introduces a set of basic technical concepts that will be later used to implement DariusSDG as a program comprehension tool.
Starting with the programming language concept and the formalisms used to define it (context-free grammars and attribute grammars) and going through the compiler generator tool AnTLR used to create the structure of the System Dependency Graph and finishing with the visual construction of those graphs. At the end of the chapter, the original Darius is also introduced because the objective of this work is to merge its results with the visualization of the SDG.
2.1 P R O G R A M M I N G L A N G U A G E S
Natural languages were created to facilitate the communication between humans and were created before the rules (grammar), despite following a pattern they have a lot of exceptions. Formal lan-guages, like programming lanlan-guages, work the other way around, first, very well defined rules are created and then, based on those rules we create sentences/instructions which give origin to texts/pro-grams.
A formal language is a set of elements (symbols, letters or tokens) and rules that explain how the symbols can be related. These elements and rules are described in a formal grammar. If a sentence is recognized by the grammar, that sentence belongs to the language.
2.1.1 Context Free Grammar
A context free grammar (CFG) is a formal grammar which is used to represent a formal language, it describes the elements (symbols, letters or tokens) the language can use and how to related them (build sentences) (Crespo,cop. 1998;Halfeld-Ferrari).
2.1. Programming Languages
Formally a context free grammar can be represented by a tuple:
CFG= (T, N, s, P) (1)
Where
• T is a set of terminal symbols • N is a set of nonterminal symbols
• s is the initial nonterminal symbol, the axiom • P is a of set derivation rules, the productions
A terminal symbol can be a symbol, a letter or a token and a nonterminal symbol is an identifier. A production is represented as:
P : a0 →a1...an (2)
Where
• P is the identifier of the production • a0is a nonterminal symbol
• a1...anare terminal or nonterminal symbols
The left hand side (LHS) of the production (a0) derives in the right hand side (RHS) (a1...an) of the
production. If the RHS of the production contains a nonterminal symbol we must check the production that derives the nonterminal symbol till we have only terminal symbols.
A context free grammar that represent a sequence of zeros or ones or zeros and ones separated by a comma can be:
zeros and ones= (T, N, s, P) T =0, 1, ‘, ’
N= List, Item s =List
P1 : List→ Item P2 : List→ Item, List P3 : Item→0
P4 : Item→1
(3)
In the production P2 the nonterminal symbol List derives in the nonterminal symbol Item, followed by the terminal symbol ’,’, followed by the nonterminal symbol List.
2.1. Programming Languages
When we have more than one production with the same right hand side, we must choose one of them to continue the derivation. For example, when we have the nonterminal symbol List whe can derive it into Item or into Item , List.
The rules are grouped by the LHS of the production, so we can omit P2 and P4 left hand side of the production, this notation is known as Backus–Naur Form (BNF) (Garshol,2008).
P1 : List→ Item P2 : |Item, List P3 : Item→0
P4 : |1
(4)
In P2 rule we use a recursive call to make the list as big as we want. The extended Backus–Naur Form (eBNF) let us use three symbols of the regular expressions (Aho et al.,1986;Kleene,1956) that can reduce the number of productions.
The symbols are:
• ? which means optional occurrence • * which means zero or more occurrences • + which means one or more occurrences
Using the extended Backus–Naur Form we can join P1 and P2 produtions. P1 : List→ Item(, Item)*
P2 : Item→0 P3 : |1
(5)
2.1.2 Attribute Grammars
An attribute grammar is a formalism to define attributes for the productions of a grammar (Knuth,
1968;Slonneger and Kurtz,1978). Formally an attribute grammar can be represented by a tuple:
2.1. Programming Languages
Where
• G is a context free grammar
• A is a set of attributes (associated to the terminal and nonterminal symbols of G)
• CR is the set of contextual rules to obtain the value of the attributes in the productions of G • CC is the set of contextual conditions in the productions of G
• TR is the set of translation rules in the productions of G
The attributes are divided into two groups: synthesized attributes and inherited attributes.
The inherited attributes transport information down the derivation tree. The child node inherits these attributes from the parent nodes. The axiom and terminal symbols do not have inherited attributes.
The synthesized attributes transport information up the derivation tree. They are the result of eval-uation rules. Terminal symbols have intrinsic synthesized attributes like the position, the line or the text (content of the attribute).
In Figure2we can see that the nonterminal symbol A derives in B and C. A inherits two attributes (red inverted triangles) and synthesises other two (green triangles). B inherits one attribute from A and returns it another one. C inherits one attribute from A and synthesize two attributes.
Figure 2: Representation of one production in an attribute grammar
The computational rules are mathematical expressions that are used to compute the values of the attributes. These values can be computed using the synthesised attributes, the inherited attributes or constants.
The contextual conditions are mathematical expressions to check the validity of the sentences. For example, if a nonterminal symbol has an attribute day of the month contextual condition shall restrict the values to numbers from 1 to 31.
The attribute grammar can be seen as object oriented if we think that a production is an object and the incoming attributes are the resources. The outgoing attributes must be computed only using the available resources.
2.1. Programming Languages
2.1.3 ANTLR
ANTLR (ANother Tool for Language Recognition) is a powerful and free tool for parsing formal languages (Parr,2014). It has a recognizer generator (parser and lexer) that can be used for reading, processing or translating formal languages (Aho et al.,1986;Waite and Goos,1984).
It has a development environment called ANTLRWorks (see Figure3) where we can design the grammar, debug it and test it with inputs. ANTLRWorks also has a navigation system, autocompletion and a syntax diagram visualizer.
Figure 3: ANTLRWorks interface
ANTLR can be used for every formal language. To use it we must describe which language we want to read/process/translate by using a context free grammar and using the extended Backus–Naur Form (eBNF).
As mentioned, the output of ANTLR is a lexer and a parser that recognizes the language specified. ANTLR can generate code in several programming languages.
Attribute grammars can also be used in ANTLR. ANTLR has a specific notation for inherit and synthesized attributes. The actions (translation rules, contextual rules and contextual conditions) to make in each production must be written directly in the production and in the programming language that will be generated.
When the recognizer is being generated, the actions are embedded in the source code at the appro-priate points.
2.2. Understanding a Program
2.2 U N D E R S TA N D I N G A P R O G R A M
Understanding a program depends on the knowledge the software engineers have about the program that is being analysed, his experience and knowledge about the real world problem that the program solves.
These two concepts, real world problem and how it is solved in a programming language, are known in Program Comprehension as: Problem Domain and Program Domain.
Despite being related many times, Problem Domain concepts do not have a direct correspondence to their implementation.
We can see Problem Domain as the concepts related to the problem, the relationship between them and how the problem can be solved. For instance, if a teacher needs to manage a school class there are various concepts related to that problem like students, grades, faults, summaries and so on.
This problem has various tasks, or more small problems associated like: • how to add a summary?
• how to register the information about the students?
• how to register the grades? Should they be part of the student record or be saved apart? • where is the information stored?
Program Domain is concerned with the programming language and with the implementation tech-niques used to solve the problem in a computer. Taking the example above, we can say that in Program Domain the concern is what data structures will be used to store the information (an array?), how the information about the grades will be implemented (as attribute of the school class or the student?) among others.
The time spent understanding a program also depends on the program that is being analysed: how it was created, how it is being maintained, in which programming language is written and the changes that should be implemented also have a strong influence in the effort and time required for program comprehension.
When a software engineer analyses a program a Mental Model of the program is constructed, which is updated when new informations are collected (Storey et al.,1999). The software engineer needs to know the flow of the program, which methods are called, by whom, what these methods do, the data dependencies and the effect a change may cause. As said before, programs tend to be huge (many lines of code, many methods and many files) and it causes to be unworkable the task of knowing all these details about the program by hand.
Every software engineer has his own way to understand a program, to capture information from the source code (Storey et al., 1999). To help the software engineer on this task there are several tools that can be used to explore the source code. The choice depends on the needs of the user: static or dynamic source code analysis, use of visualizations or textual information to show the results and so
2.3. Concept Location
on. Moreover, almost all tools are programming language dependent and some of them adopt invasive approaches that modify the source code with code inspection instructions (da Cruz et al.,2009).
Some Program Comprehension techniques are used to extract the structural information from source code like the System Dependence Graph. This technique enables software engineers to easily see how the program executes, which methods are called, who called certain method, the order they are called and other similar information. However, this artefact does not show all the information about the program (Maletic and Marcus,2001). It does not show informations about the relation between Program Domain and Problem Domain, how the real world concepts are emulated in the source code. The main focus of this master work are the System Dependency Graph and Concept Location based on comments techniques, which will be discussed in the next sections as well as some tools that imple-ment these techniques in order to have a complete tool that shows structural and semantic information about a program.
2.3 C O N C E P T L O C AT I O N
Concept Location is a component of Program comprehension that has the objective to find in the code where the concepts are implemented (Rajlich and Wilde,2012).
We can find these concepts analysing/inspecting the code or the System Dependency Graph but that can take a lot of time.
Software reconnaissance (Wilde and Casey, 1996), for example, is a technique that runs a set of cases where the action that implements the concept occurs and a set of cases where the action that implements the concept does not occur. The traces are analysed and compared. The differences can indicate where the concept is implemented. In Figure4(extracted from (Wilde,2012)) we can see a graphical representation of this technique.
Figure 4: How Software Reconnaissance works
Other option is searching for certain keywords in the source code that can indicate where the con-cept is being implemented. This is possible because the text present in the source code can give us various kinds of semantic information about a program (Carvalho et al.). If a method is called
”re-2.3. Concept Location
turn average grade”it is almost certain what the method returns. The problem is when these methods or variables do not have an explicit name or are relevant to understand the context and the concepts involved like result or auxiliary.
That is why comments are so important. Comments can explain source code in a natural language connecting the Program Domain with the Problem Domain, like an interface between them (Woodfield et al.,1981a). By reading the comments we can understand what the software engineer was thinking when writing the code and what problem was trying to solve (Tenny,1988).
2.3.1 Information Retrieval
As we can see in (Manning et al., 2009), the main goal of Information Retrieval is finding and retrieving documents that satisfy a certain search or query.
An Information Retrieval System analyses several documents processing its text with the assistance of some tools like:
• Sentence tokenizer, that separates the text into sentences. • Word tokenizer, that separates the sentences into words. • Stemming, that reduces the word to its grammatical root.
• Elimination, that eliminates words that do not have significance or value.
After complete all the tasks the user only needs to insert in the system the query (set of keywords) to execute. The system perform the same process mentioned before in the query, to assure consistence, and retrieves a set of documents that satisfy the search ranked them by relevance.
Ranking the results, according to some criteria (query), is the main problem of Information Re-trieval.
There are various algorithms designed to rank documents, however in the most famous are Vector Space Model (Zhao et al.,2006) and Latent Semantic Analysis (Deerwester et al.,1990).
2.3.2 Darius
Comments in the code, as mentioned before, are one of the most important sources of information about the program. It is one of the best ways to understand what the software engineer was thinking and how the Problem Domain and Program Domain were related. Even in ”Agile” development it is useful commenting wisely the source code. The comments can be helpful to understand the program but also the problem that it solves.
Studies ((Woodfield et al.,1981b) and (Teny,1985)) conclude that programs that have more com-ments are more easily understandable by software engineers and tend to be more stable (Aman and Okazaki,2008).
2.3. Concept Location
To the best of our knowledge, at present Darius is the only tool available that performs concept location based on source code comments.
Darius is a tool built by Jos´e Lu´ıs Figueiredo de Freitas, in his master work (de Freitas,2011) at University of Minho, that uses several techniques of Information Retrieval to analyse the various types (inline, multiline and JavaDoc) of comments presented in the source code.
In Figure5we can see the architecture of Darius. Darius is composed by four main modules: • A comment extractor
• A statistic calculator • A word analyser • A concept locator
Figure 5: Darius Architecture
These four modules are presented in a graphical interface that is composed by three tabs.
The first tab (see Figure 6) uses the static calculator module and show to the user informations about the commenting practice on the program previously loaded as well as other informations like the number of files, the number of conditional statements and loops.
2.3. Concept Location
Figure 6: Darius Graphical User Interface: Comment Statistics tab
In the second tab, that is shown in Figure7, the user can write some words to be analysed by Darius and relate them to the comments in the code (it uses the word analyser module).
2.4. Graphs
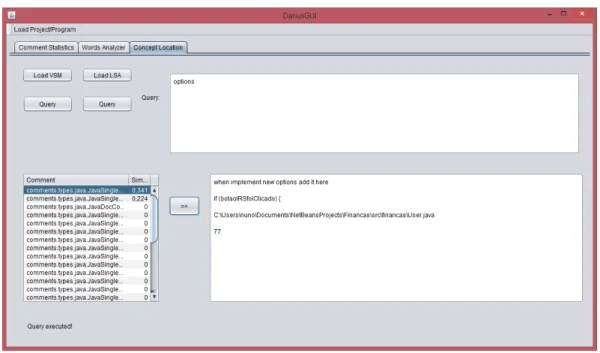
The concept locator module is used in the last tab (see Figure8) and offers the possibility to choose between two different types of Information Retrieval techniques: Vector Space Model (Zhao et al.,
2006) and Latent Semantic Analysis (Deerwester et al.,1990). These two techniques are used to rank documents i.e. decide which results are more important according to the criteria expressed in the query.
After Darius process the program the user can write queries in the text field of that tab. Next the software engineer can choose which technique wants to use and see the retrieved documents (in this case comments) ordered by relevance. If the software engineer wants to see more detailed information about a comment must select that comment and press the button with an arrow. This detailed information will appear in the text field present in the bottom right corner of the window.
Figure 8: Darius Graphical User Interface: Concept Location tab
All the three tabs use the comment extractor module.
Besides the quality of the tool, one of the main advantages is that we have access to the source code. This allows to adapt easily the code to the needs and improve some aspects.
2.4 G R A P H S
A graph is representation of a set of objects (called nodes or vertices) where some pairs of objects are connected by lines (called edges or arcs). Usually a graph is represented in a diagrammatic form as a set of dots (for the vertices) joined by lines (for the edges).
2.4. Graphs
The edges can have a direction making the graph a directed graph. A directed graph (like the System Dependency Graph) is an ordered pair represented by:
D= (V, A) (7)
Where:
• V is a set of vertices • A is a set of ordered edges
A directed edge is a pair of vertices represented by:
e= (v1, v2) (8)
This representation indicates that the edge goes from v1to v2.
In Figure9we can see a definition of a directed graph and its representation (example extracted from (Schlag,2004)).
2.4. Graphs
2.4.1 DOT
DOT is a graph description language very simple and powerful (Gansner et al., 2006). It can describe graphs that are easily read by humans and programs.
For example, the code listed in2.1is written in DOT and it outputs the graph in Figure10.
digraph graphname { a -> b -> c; b -> d; }
Listing 2.1: DOT example
Figure 10: Graph generated by a DOT tool
DOT is also largely adopted, there are a lots of tools, written in many different programming lan-guages, that can read and write DOT format.
The tools that implement the DOT language have mechanisms to automatically choose the best positions to the nodes (if not specified), which is an advantage, if we do not care about that but it is a big issue if the positions of the nodes are important (like in a System Dependency Graph).
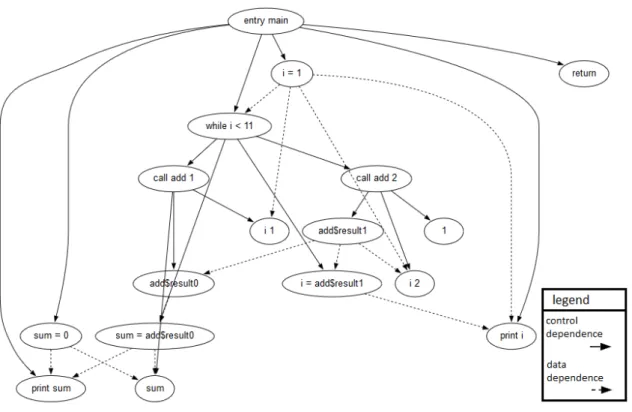
For example Figure11and Figure 12represent the same program (the program listed in2.3) but, the position of the nodes are different. The System Dependence Graph in Figure 11is more easily understandable than the System Dependence Graph in Figure12.
2.4. Graphs
Figure 11: A System Dependency Graph
Figure 12: A System Dependence Graph
We can specify every detail of the graph: the position, the shape, the colour, the labels of the nodes and edges among others. But that turns the language more complicated and it is laborious specify every node position.
2.4. Graphs
2.4.2 JGraphX
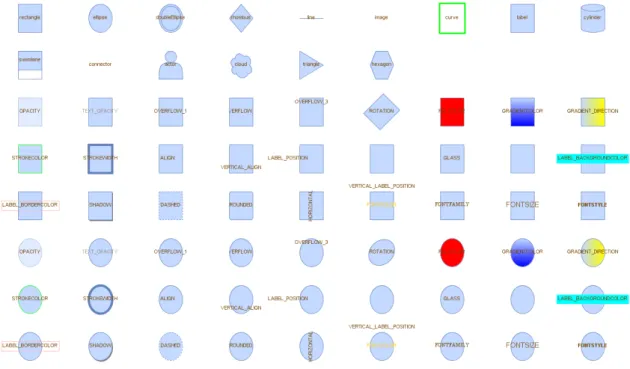
JGraphX (Benson and Alder,2014) is a Java Swing Diagramming library that provides functionality for visualisation and interaction with graphs. It offers many methods to construct graphs, change their appearance and behaviour. JGraphX has an enormous and well documented API. In Figure 13
(extracted from (Bibliowicz,2011)) we can see some styles that JGraphX provides.
2.4. Graphs
As mentioned the tool provides many methods and options to interact with the graph. Some of them are listed in Table1.
Function Description
setAllowLoops Specifies if loops are allowed.
setAutoSizeCells Specifies if cell sizes should be automatically updated after a label change. setCellsEditable Specifies if the graph should allow in-place editing for cell labels.
setCellsMovable Specifies if the graph should allow moving of cells. setCellsResizable Specifies if the graph should allow resizing of cells.
setCellsSelectable Sets cellsSelectable that specifies if the given cell is selectable.
setLocked Sets if any cell may be moved, sized, bended, disconnected, edited or selected. setCellsDeletable Sets cellsDeletablet hat specifies if the given cell is deletable.
setMultigraph Specifies if the graph should allow multiple connections between the same pair of vertices.
setConnectableEdges Specifies if edges should be connectable. setTooltips Specifies if tooltips should be enabled.
Table 1: Some graph options available in JGraphX
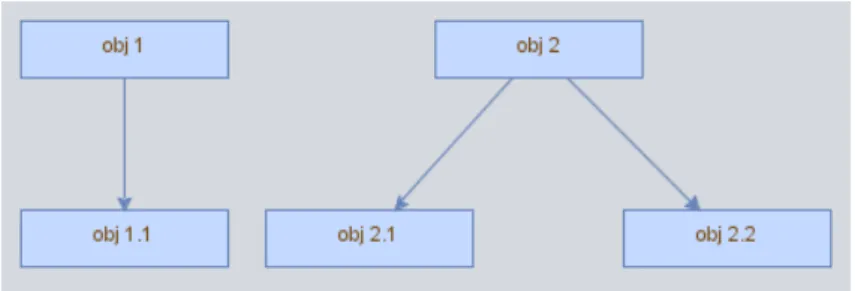
Despite being a powerful tool, JGraphX is also very simple. Listed in2.2we can see the code that gives origin to the graphs shown in Figure14.
mxGraph graph = new mxGraph();
Object parent = graph.getDefaultParent(); graph.getModel().beginUpdate();
Object obj1 = graph.insertVertex(parent, null, "obj 1", 20, 20, 110,30); Object obj1_1 = graph.insertVertex(parent, null, "obj 1.1", 20, 20, 110,30); Object obj2 = graph.insertVertex(parent, null, "obj 2", 20, 20, 110,30); Object obj2_1 = graph.insertVertex(parent, null, "obj 2.1", 20, 20, 110,30); Object obj2_2 = graph.insertVertex(parent, null, "obj 2.2", 20, 20, 110,30); graph.insertEdge(parent, null, "", obj1, obj1_1);
graph.insertEdge(parent, null, "", obj2, obj2_1); graph.insertEdge(parent, null, "", obj2, obj2_2); graph.getModel().endUpdate();
mxGraphComponent graphComponent = new mxGraphComponent(graph);
2.4. Graphs
Figure 14: Sample graphs made with JGraphx
In the example the parent used was the default parent but we can use an existing cell as the parent being the result showed in Figure 15. Also the size of the nodes were specified but we can set the auto-size property of the cells to fit its content.
Figure 15: A node inside a node
With JGraphX we can also apply automatic layout algorithms to the graph like: • hierarchical • swim-lane • circle • compact tree • composite • parallel edge • partition • radial tree • stack
2.4. Graphs
2.4.3 JUNG
JUNG, Java Universal Network/Graph Framework (O’Madadhain et al.,2013), is an open source library that allows the user to create and visualize graphs.
The framework has various layout algorithms like: • balloon • circle • Fruchterman Rheingold • Kamada Kawai • radial tree • spring • tree
JUNG also allows the user draw anything in the graph like graphics from Java (circles, rectangles, triangles) or images. In Figure 16(extracted (O’Madadhain et al.,2013)) we can see a graph drawn with JUNG that has a tree layout and Java graphics (circles) in the nodes.
Figure 16: Jung graph example
JUNG also can read the graph content from a GraphML (Committee,2007) file. GraphML is a file format for graphs that describes its structural properties.
2.5. System Dependency Graph
2.5 S Y S T E M D E P E N D E N C Y G R A P H
Static Code Analysis is one of the most used methods to extract data and return information from a program (Du et al.,2012;Baca et al.,2008). By doing that we can understand the workflow of the program, which methods are called (and by whom) and which variables are used.
Real world programs tend to be huge and it is impossible know all these details. Every time a change needs to be made in the program the software engineer needs to navigate in the methods and discover the location where the change will take place. This is an enormous waste of time.
2.5.1 What is it?
The System Dependency Graph (Livadas and Johnson,2000) is a visual artefact, created by program comprehension researchers, that shows all the static dependencies of a program in the form of a graph. The System Dependency Graph (SDG) is composed by two components: the Control Flow Graph (CFG) and the Data Dependency Graph (Du et al., 2012). The Control Flow Graph shows all the dependencies and calls between methods and classes. It shows all the statements of the program and how they are related. If a statement B is called by statement A, statement B is connected to statement A and it is positioned one level below statement A. Just looking at the Control Flow Graph, a software engineer can see the flow of the program and discover in which class, method and statement will do the change (when a maintenance is needed). The Data Dependency Graph shows where the variables in the code are changed (variables dependencies). As in Control Flow Graph, when a variable is changed in one statement it is connected to that statement showing that there is a dependency between them. As mentioned above, when joined, these two graphs form the System Dependency Graph. A graph where the software engineers can see all the static dependencies and workflow of the program in a very easy and intuitive way.
In Figure17, the same image that is in Figure11 (duplicated to facilitate the reading) we can see the System Dependency Graph of the source code listed in2.3(example extracted from (TONG et al.,
2.5. System Dependency Graph
public static void main(String[] args) {
int sum, i; sum = 0; i = 1;
while (i<11) { sum = add(sum, i); i = add(i, 1); }
System.out.println("sum = " + sum); System.out.println("i = " + i); }
Listing 2.3: Excerpt of a Java program
Figure 17: A System Dependency Graph
2.5.2 Tools that build a System Dependency Graph
Creating by hand a System Dependency Graph for a given program is not an easy task. And despite the fact that Java is one of the most famous programming languages, there is a very small amount of tools to analyse Java code and build its dependencies (packages, classes, variables, methods), and an even more small number to build the System Dependency Graph.
2.5. System Dependency Graph
JavaPDG
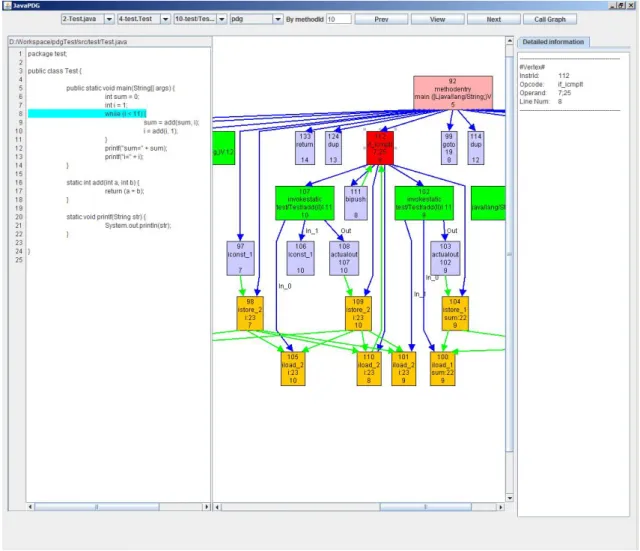
JavaPDG (Shu et al.,2013) is a ”static analyser for Java bytecode, which is capable of producing various graphical representations such as the system dependence graph, procedure dependence graph, control flow graph and call graph”. It has two modules:
• SDG Generator: As the name implies, this module generates the System Dependence Graph of a program and stores the data into a database.
• Graph Viewer: This module can show the data stored in a visual mode.
Although it is a good tool, the possibility of building a graphical representation, like in Figure
18(example extracted from (Shu et al.,2013)) of the data does not serve the purposes of this thesis because it is necessary making changes to the graph with the information from the comments found in the comment analyser.
2.5. System Dependency Graph
The first module uses a database (Apache Derby) to store the results, which implies some configu-rations. Or the tool created (DariusSDG) can automatize all the steps (or the great part of them) or the software engineer will spend some time configuring the tool, and that can fend the software engineer to use the tool. Another disadvantage is that JavaPDG needs a lot of memory to work.
JavaPDG uses the Java bytecode to construct the System Dependency Graph. Java System Dependence Graph API
The Java System Dependence Graph API (TONG et al., 2010) is a tool that can construct the System Dependency Graph of a program and return the information collected to the user in a JSON (JavaScript Object Notation) format.
As the name indicates, the objective of this tool is to construct the System Dependence Graph and provide methods to access it.
In the Table2are listed some of the main functions associated with the SystemDependenceGraph object (TONG et al.,2010).
Function Description
ControlDependenceBFS Breath first search following the control dependence edge. ControlDependenceDFS Depth first search following the control dependence edge. DataDependenceDFS Depth first search following the data dependence edge. NodeCount Return the number of nodes in a SDG.
PDGCount Return the number of PDGs in a SDG. PDGRetrieve Return a PDG by a call node.
Table 2: Main functions of the System Dependence Graph API
Despite being equivalent in terms of functionality (JavaPDG first module and Java System Depen-dence Graph API), Java System DepenDepen-dence Graph API has some advantages:
• does not need a database, therefore is easier to configure • is open source, which means it can be customized to the needs • has a very complete documentation about the methods available
Like JavaPDG, Java System Dependence Graph API uses the Java bytecode to construct the System Dependency Graph.
3
D A R I U S S D G : D E S I G N
As mentioned in the Research Hypothesises (1.2) the objective of this tool is to join two Program Comprehension techniques: Concept Location over source code comments; and System Dependency Graphs. Thus software engineers can visualize both semantic and structural information about a program and how they are related.
We named the tool as DariusSDG because it is an integration between an existing tool that performs concept location over source code comments, named Darius, and other two tools that build the System Dependency Graph of a Java program. In that way we believe that the name is easy to understand and memorize, as it is the tool purpose: help in understanding the meaning of programs. A detailed explanation about the choice of these tools and how they are integrated will be described in this chapter.
3.1 R E Q U I R E M E N T S
As mentioned in the objectives, the language recognized by DariusSDG is Java. Java is one of the most used programming languages in the world and it is platform independent which means it can run in every equipment (TIOBE,2014;LangPop,2013). With this we can reach a much broader audience, helping more software engineers in their software maintenance work.
If the objective of the tool is to recognize Java, which is platform independent, it makes sense to build a tool that is also platform independent. Hereupon DariusSDG will also be written in Java.
In order to build DariusSDG, three main components are required: • A tool that can perform Concept Location over source code comments • A tool that can build the System Dependency Graph
• A tool that can draw graphs
As mentioned in Chapter2, the only tool we have knowledge that can perform Concept Location over source code comments is Darius. Thankfully we also have access to Darius source code, enabling us to do the necessary adaptions directly in the tool instead of building a complementary tool to meet our needs.
3.1. Requirements
To the best of our knowledge, at present there is not any system that can build the System Depen-dency Graph of a Java program based on the source code. The programs described in Chapter2can build the System Dependency Graph of a Java program but based on its bytecode.
When the Java source code is compiled to Java bytecode (a intermediate representation that is interpreted by Java Virtual Machines) the code is changed to that representation, it is optimized and the comments are removed.
There are some tools, called decompilers, that can revert some changes made by the compiler but, the comments can not be recovered. This occurs because the comments are removed while the instructions are transformed and/or optimized; so it is possible to revert some changes. For example unused code (also known as dead code) is removed and cannot be recovered. Also the increment of a variable by one cannot be 100% recovered because there are many ways to increment a variable:
• i++; • i = i+1; • i += 1; • ++i;
On account of that the decompiler is unable to decide the original version of the code.
Another obstacle to using these tools is that we need to relate the System Dependency Graph with results out coming from the search done with the comment analyser. If the source code is modified (comments are removed and instructions are optimized) it is extremely difficult to make that associa-tion (comments with the SDG).
If a comment and its respective instruction is found, we want to highlight that instruction in the System Dependency Graph. But we cannot make that because the two instructions (the one found in the source code and the one in the SDG) do not have the same line number (to compare them) and could have different syntax (because of the optimizations).
Also, when is doing maintenance the software engineer wants to get the results from a PC tool at the source code level (where the software engineer will do the change). If the tool does not show the exact location where an intervention is needed, the software engineer will spent even more time analysing the results of the tool slowing down the process.
Hereupon it is necessary to develop a tool that can build the System Dependency Graph based in the source code. The tool build will be called SDG Builder.
Scalability also can be a problem. The input program (received by DariusSDG) can be extremely huge and consequently the System Dependency Graph will be extremely huge. Building so many nodes and connections between them can reduce significantly the performance of the tool and difficult the analysis. So, we decided to break the System Dependency Graph into smaller pieces: methods. The software engineer has the same structural information about the program but split by methods, becoming easier to understand and more scalable.
3.2. Architecture
In Section2.4some tools that can draw graphs were analysed. JGraphX is the tool that better fits our needs and so is the tool chosen to build the graph. JGraphX is a Java library that provides many functionalities for visualisation and interaction with graphs; it can automatically order the nodes in an hierarchical structure (typical in a SDG); moreover, it has a very complete documentation and it is simple to use.
The graph that DariusSDG will display must be ”flexible”. The software engineer must be able to move the nodes and the edges rearranging them the way the software engineer wants. With this the software engineer has more power over the tool and can adapt the results to his/her needs. For example, if the data dependence and the control flow edges are overlapping the software engineer can move them or move the nodes (and consequently the edges) to a position where they do not overlap.
DariusSDG must also offer the possibility to turn off the data dependency edges making the graph clearer and cleaner. The software engineer may not want to see the data dependence between the nodes and only the flow of the program. Or the data dependence and control flow edges can be in such a high number that the graph becomes confusing and this option (turn the data dependence edges off) could help.
DariusSDG must have an input field where the software engineer can enter search terms that will be compared with the comments extracted from Darius. It must show the results ordered by similarity and when the software engineer pick a result (comment) it must show the associated method and instruc-tion in the System Dependency Graph. The statement must be highlighted to be visually distinguished from all the others and make clear that it is the one associated with the selected comment.
The software engineer must also be capable to navigate in the System Dependency Graph without searching for terms. This navigation must be done by selecting the different methods present in the loaded program.
Finally, the tool must also be intuitive, simple and easy to use. The objective is to simplify and assist the software engineer reducing the time spent in maintenance.
3.2 A R C H I T E C T U R E
In Figure19we can see the diagram that depicts the tool architecture, its structure, components and connections among them. From this diagram it is possible to understand the steps that are taken by the tool to build the result, which is the construction of the System Dependency Graph and the mapping of the extracted information from source code comments with the nodes of the graph.
The tool receives the source code of a program as input. That program will be analysed by Darius (described in Section2.3.2) and retrieves a list of comments present in the program based on Vector Space Model (VSM) technique.
The program will be also analysed by the SDG Builder (the tool we developed to build the System Dependency Graph of a Java program). The SDG Builder was built using ANTLR which needs a Java Grammar in order to transform the Java source code in a representation of the System Dependency
3.2. Architecture
Graph. The development of the SDG Builder will be described in more detail in the next chapter. The SDG Builder outputs a representation of the SDG divided by methods (to overcome the scalability problem mentioned in the previous section).
If the software engineer interacts with DariusSDG by entering search terms the tool will display the list of comments and their respective similarity to the searched terms (the list will be ordered by similarity). If the software engineer select a comment the corresponding part of the SDG will be displayed using JGraphX and the associated instruction will be highlighted.
The software engineer can also interact with DariusSDG by selecting the methods that he wants to see. The information about the System Dependency Graph is passed to JGraphX that draws it.
4
D A R I U S S D G : D E V E L O P M E N T
The objective of DariusSDG, the tool proposed in this thesis, is to join two Program Comprehension techniques (System Dependency Graph and Concept Location over comments in the source code) reducing the time spent to understand a program. To achieve this goal the development of DariusSDG was divided in four steps:
• To improve and adapt Darius (a comment analyser tool for concept location)
• To build a tool that can extract the System Dependency Graph of a Java program based on its source code
• To draw the System Dependency Graph using JGraphX • To integrate all the tools
All these steps will be described in more detail in the following sections.
Despite being made tests during each development step, the last section will be used to describe the tests made to the tool.
4.1 C O M M E N T A N A LY S E R F O R C O N C E P T L O C AT I O N
Comments in the code are one of the most important source of information about the program. It is one of the best ways to understand what the software engineer was thinking and how the Problem Domain and Program Domain were related (Woodfield et al.,1981b;Teny,1985;Aman and Okazaki,
2008).
Darius (de Freitas,2011) is the only tool that we have knowledge that can extract Java comments (inline, singleline, multiline and Javadoc) present in the source code of a Java program and perform concept location with them.
As mentioned before Darius extract the comments present in the source code, separates the text into sentences and the sentences into words. The words that have no significance or value are eliminated and the others reduced to its grammatical root. The system also performs these actions in the query inserted to assure consistence.
4.1. Comment Analyser for Concept Location
Darius uses two algorithms to rank documents (Vector Space Model (Zhao et al.,2006) and Latent Semantic Analysis (Deerwester et al.,1990)) and let the user choose which one he wants to use. In order to keep the tool simple, DariusSDG will only have one algorithm. The algorithm chosen is the Vector Space Model because, according to Jos´e Lu´ıs Freitas thesis (de Freitas,2011), was more effective and faster in the tests performed.
When searching for comments, Darius not only save the text present in the comment but also some associated information like the file where it was found, the next line after the comment and the type of comment.
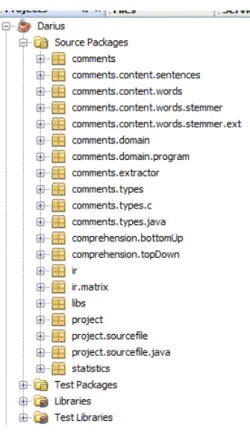
The same comment can occur more than once in the same file, so we need more information about the comment in order to associate them with the instruction in the System Dependency Graph. In order to associate the comments with the SDG, Darius source code was changed. As we can see in Figure 20Darius is not a small program, it contains 42 classes and 295 different methods. Before we make changes to Darius program we needed to understand how it works, how was constructed and the right locations we needed to intervene in order to achieve the objectives. In other words, we performed a complex task of reusing a software.
Figure 20: Darius structure shown by NetBeans
As the System Dependency Graph will be divided by methods, Darius was adapted to associate the name of the method to each comment.
4.1. Comment Analyser for Concept Location
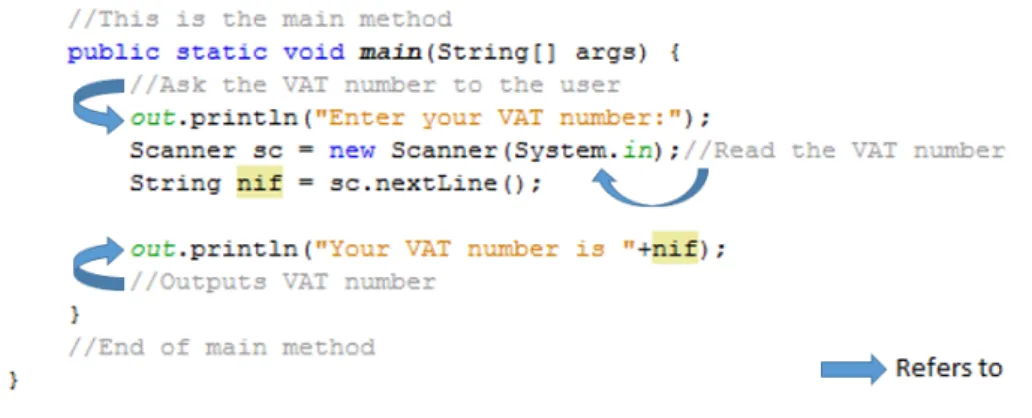
If the comment is inside a method then it belongs to it but, if a comment is outside methods which method does it belong? Initially we thought in a audacious strategy that consists in finding expressions in the comment that can indicate if the comment was referring the last or the next method, but that was not viable. So we decided that comments outside methods are referring to the next method and if the comment was in the end of the file, without a method following, the comment was referring to the last method declaration. In Figure21we can see an example of how we associate comments with methods.
Figure 21: How DariusSDG associates comments with methods
To associate the comment with the exact instruction in the SDG, Darius was also changed to store the line where the comment starts (it can be multiline). That association can not be made with the line after commentoffered by Darius because the line after a comment could be a parentheses, and a parentheses is not represented in the System Dependency Graph.
The rules to associate a comment to a statement are basically the same used to associate a comment to a method. If a comment is in the same line as the statement (inline comment) the comment is referring it. If a comment is before a statement, it is referring to that statement. Lastly, if a comment is inside a method but after all the statements, the comment is referring to the last instruction in that method. In Figure22we can see an example of how we associate comments with statements.
4.2. Building the System Dependency Graph
4.2 B U I L D I N G T H E S Y S T E M D E P E N D E N C Y G R A P H
In Section2.5we described and analysed some tools that build the System Dependency Graph of a Java program but none of them does what we need: build the SDG of a program based on its source code. Therefore we decided to develop a tool that builds the System Dependency Graph based on the source code of a Java program. We named the tool SDG Builder.
The tool that was created needs to analyse the source code recognizing when a statement is using a variable (to make a data dependency connection, that will be shown in the Data Dependency Graph); it also needs to ”know” that when a set of statements are inside an if-then block they depend on the condition that is defined on the if-then statement and so on.
Java is a very big and complex language; it allows for multiple ways to achieve the same thing, like loops, conditional structures or variable declaration. Java give us the possibility of doing many things like inheritance, encapsulation, polymorphism, threads, graphics and so on. But, despite all this, Java is a formal language; it has very well defined rules that allow computers understand what was specified in the source code without ambiguity (Power,2002).
As mentioned in Section2.1, ANTLR is a powerful tool that can generate a processor to parse a formal language like Java. It also has a specific notation to use attributes and translation rules, since we are going to transform a Java program in its System Dependency Graph representation.
To accomplish this task, the first step is to build a grammar that can recognize the Java programming language. Fortunately Terence Parr, the creator of ANLTLR, already created a grammar for it, that was updated by the community in order to recognize new Java syntax.
Before we started developing the tool we made some tests to verify if the Java grammar could correctly parse Java source code files. We passed various files to it and checked if everything was correctly parsed and it was. The next step was to study the grammar in order to understand how it was constructed and where we needed to add transformation rules in order to create a representation of the System Dependency Graph.
We divided the process of building the System Dependency Graph in two phases: first we build the Control Flow Graph (CFG) and then the Data Dependency Graph (DDG). Basically, after we have the CFG we only need to specify the data dependency connections.
4.2. Building the System Dependency Graph
When the program starts to be parsed a list of nodes is created and it increases every time a new statement is parsed. A Java class was created to save the nodes of the program. That class has six fields:
• a node identifier
• the content of the node (statement) • the line where the statement starts • the method to which it belongs
• the name of the class to which it belongs • the father node identifier
We need to save the class and method name because a statement (for example return id;) can occur in multiple methods, and a method (for example get ID) can occur in multiple classes.
Every Control Flow Graph has an entry point which is represented by a node usually called entry. All the ”independent” nodes are connected to the entry node, the entry node is the father of these nodes. A node can also have children, for example an if-then statement have a set of instructions that are executed if the condition evaluates to true. These instructions are children of the if-then node.
A node could have a list of nodes (their children) but it is simpler and faster to have a node identi-fying its father. Instead of a list that needs to be updated when new children nodes are parsed we only need to save one identifier (the father). This is the last field of our class.
When a new method starts to be parsed the node entry is created as well as a list of father nodes. The entry node is added to the list. As the method gains deepness the list becomes bigger, when the method lose deepness the list becomes smaller. For example, if a instruction while is parsed it is added to the list of father nodes. All the instruction inside the while block have the while identifier as father. When the block ends the while node is removed from the father nodes.
Also, when a statement starts to be parsed, token by token, the statement content (tokens) is being stored in a variable till it is fully parsed. When this happens a node (with all the fields mentioned before) is created and added to a list that contains all the nodes of the program.
In Figure23we can see some steps that exemplify how parsing is done and what is stored in the list of nodes and in the list of father nodes.
4.2. Building the System Dependency Graph
4.2. Building the System Dependency Graph
One problem we faced when constructing the Control Flow Graph was the parsing of the do-while-loop. The CFG is built with levels (the parent and the children), usually the instruction in Java are in this order. In for-loop the condition appears first (the father) and the children appear in the block that succeeds the condition. However in the do-while-loop the condition appears in the end of the block. In this case we save the node that contains the token do and when the condition is parsed (at the end of the block) we update the do node with the condition.
Despite the fact that the statements inside the do-while-loop execute even when the condition is not met it seems more logical that the do-while-loop follow the same structure of the while-loop. We cannot omit the condition and also cannot put it bellow the block because that means it depends of the block which is wrong. So we write it the node the text ”DO WHILE CONDITION”.
The grammar ignores the white spaces and new lines that appear in the source code. This happens because the source code can have multiple white spaces or new lines and the objective is not capture them. But, as the instructions will be showed to the user we need to insert white spaces between the tokens in order to make a more readable statement.
With this we have a list with all the statements. Each statement has information that can be used to create the connections between them in order to build the Control Flow Graph.
As mentioned, the System Dependency Graph will be divided in methods and the user will be allowed to navigate between them. It was created another class that represents a method and has four fields:
• the name of the method
• the name of the class to which it belongs • the line where the method starts
• the line where the method ends
When a new method is parsed it is created an instance of that class and added to a list of methods in the program. When the parse is over, the instance is updated in order to save the line where the method ends.
4.2. Building the System Dependency Graph
We use a different approach to save the data dependencies between the variables. Instead of save the name of the method and class of that variable we save the method (defined before) to which the variable belongs. Also, instead of saving the father we save a list of children. The fields of the class are listed below:
• a variable identifier • the name of the variable • the line where the variable is • the method to which it belongs • a list with the dependent variables
We also create a list that will store all the DDG objects found in the source code.
When a variable is parsed we check if that variable is already in the list; if it is not, a new instance of the mentioned class is created and it is added to the list. If the parsed variable is in the list we check the next token to assure if is an attribution or a use of the variable. If is an attribution it means that the variable is ”independent”; its value only depends on that attribution. So a new instance of the class is created and added to the list. If is not an attribution (but an use of the variable), a link will be created to the last occurrence of that variable in the list, because it depends on the last assignment. In Figure
4.3. Designing the System Dependency Graph
Figure 24: How DariusSDG handle DDG objects
At the end of the parsing we have three lists:
• a list with all methods and respective class (class defined before)
• a list with all statements and how they are connected (class defined before) • a list with all variables and their dependencies (class defined before)
4.3 D E S I G N I N G T H E S Y S T E M D E P E N D E N C Y G R A P H
As said before, the System Dependency Graph is an important and useful tool due to its graphi-cal representation. The tool built as described in the last section only offers methods to access the different nodes and connections between them (edges) in a text representation. On account of that, it is necessary a tool to build the graphical representation of the SDG. JGraphX (Benson and Alder,
2014) is a Java Swing library that provides functionality for visualisation and interaction with graphs. It offers many methods to construct the graph, change the colour of the nodes or the edges and can order the graph in a hierarchical form (which is the typical form of a System Dependency Graph). By combining these two tools it is possible to build a System Dependency Graph of any Java program.
At this stage, we will have as input the three lists generated during the parsing (described in the section before) that contain all the information about the nodes of the System Dependency Graph,
4.3. Designing the System Dependency Graph
their control and data dependencies. The System Dependency Graph is divided by methods, so as input we also need to know which class and which methods will be displayed.
After that, the nodes in list that will be drawn, i.e., the nodes that have the same class and method as the input, will be inserted in the graph ordered by the identifier, which is also the order of appearance. In JGraphX first we insert the nodes and then we make the connections. The nodes are ”visited” again to make the connections between them using the identifier that corresponds to the position in the graph.
After the graph contains the nodes and the flow connections (Control Flow Graph) we apply the hierarchical layout of JGraphX.
The last step is to create the data connections between the nodes. The list that contains the data dependencies is traversed and for each node in the list we check its dependants. For each dependant a new connection is created.
In order to distinguish easily the two types of edges, the data dependency connections are drawn in white and the flow dependencies are drawn in blue.
In Figure 25 we can see the System Dependency Graph of the method in Figure 23 built with JGraphX.
Figure 25: System Dependency Graph built with JGraphX
The autosize property of the nodes was setted to true in order to adjust them according to the contents automatically. This feature has a small bug: the autosize only works on an update, not in the creation. So, when we create the node and insert it to the graph the size of the node does not fit the text it have; we need to update the node (with the same text) in order to resize the node according to the size of the text.
Lastly the options that allows the user to move the node and edges without detaching it are activated. This allows the user to isolate nodes in order to get a clear view.
4.4. Integration
4.4 I N T E G R AT I O N
As mentioned before, DariusSDG is a combination between tools (Darius, JGraphX and SDG Builder). The construction of SDG Builder and the adaptation of the other tools where described in the last sections. In this phase we need to create a User Interface, easy to use and visual appealing that connect all the tools. This integration also includes the navigation between the methods and the representation of the statements/nodes that match the comment selected.
The interface was made using Swing which is a Java GUI toolkit that provides an API to create graphical interfaces. With Swing we can create frames, panels, buttons, text fields, grids, labels and all the components that are needed to build a GUI.
Figure 26: DariusSDG graphical user interface
We build a simple interface, that can be seen in Figure26, which is divided in four sections: • in the right is the list of methods presented in the program
• in the middle of the window is the graph that represents the selected method
• in the top are the buttons and a text field that allow the user to interact with DariusSDG • in the left is the list of comments presented in the loaded program and some informations about
each comment
As mentioned, in the right of the window there is a list that contains of all methods that are used by the program (and the name of the class they belong). By clicking on an item in the list the