Genetic approaches for studying transgene inheritance and genetic
recombination in three successive generations of transformed tobacco
Kalthoum Tizaoui
1and Mohamed Elyes Kchouk
2 1Department of Biology, Faculty of Sciences, El Manar, Tunis, Tunisia.
2Center of Biotechnology of Borj Cedria, Hammam Lif, Tunisia.
Abstract
Transgene integration into plant genomes is a complex process accompanied by molecular rearrangements. Classic methods that are normally used to study transgenic population genetics are generally inadequate for assessing such integration. Two major characteristics of transgenic populations are that a transgenic genome may harbor many cop-ies of the transgene and that molecular rearrangements can create an unstable transgenic locus. In this work, we ex-amined the segregation of T1, T2 and T3 transgenic tobacco progenies. Since transfer DNA (T-DNA) contains the NptII selectable marker gene that confers resistance to kanamycin, we used this characteristic in developing a method to estimate the number of functional inserts integrated into the genome. This approach was based on calcu-lation of the theoretical segregation ratios in successive generations. Mendelian ratios of 3:1, 15:1 and 63:1 were confirmed for five transformation events whereas six transformation events yielded non-segregating progenies, a finding that raised questions about causal factors. A second approach based on a maximum likelihood method was performed to estimate recombination frequencies between linked inserts. Recombination estimates varied among transformation events and over generations. Some transgenic loci were unstable and evolved continuously to segre-gate independently in the T3 generation. Recombination and amplification of the transgene and filler DNA yielded additional transformed genotypes.
Key words:copy number variation, gene rearrangements, genetic inheritance, transgenic.
Received: September 28, 2011; Accepted: May 21, 2012.
Introduction
Plant transformation mediated by Agrobacterium
tumefacienshas become the most used method for intro-ducing foreign genes into plant cells. This method yields a high level of perfect transgenic loci with complete conser-vation of the host genome (Pawlowski and Somers, 1996). The mechanisms involved in the integration of transfer DNA (T-DNA) are still not well characterized, although in-tegration is considered to occur by illegitimate recombina-tion (Tinland, 1996; Gorbunova and Levy, 1997; Salomon and Puchta, 1998; Britt, 1999; Brunaudet al., 2002; Van Attikum and Hooykaas, 2003). The structure of transgenic loci depends on genomic factors and does not depend on the method how the transgene is transferred to the genome (Somers and Makarevitch, 2004). The complexity of inte-gration mechanisms leads to transgenic loci consisting of two or many copies of the transgene (De Neveet al., 1997; Takanoet al., 1997). Frequently, copies of the transgene are arranged in the same direction and separated by filler DNA (Krizkova and Hrouda, 1998). Integration is often
as-sociated with complex rearrangements including deletions, filler DNA, inversions and duplication of the original in-serted sequence (Joneset al., 1994; Zhuet al., 2010).
Transgenes are inherited sexually as a dominant trait
(Christouet al., 1989; Misra, 1989; Pawlowski and
So-mers, 1996; Theunset al., 2002), with inheritance conform-ing to a 3:1 Mendelian ratio (Srivatavaet al., 1996; Chenet al., 1998; Perretet al., 2003; Yonget al., 2006; Shrawatet
al., 2007). Non-Mendelian segregation occurs at a
fre-quency of 10%-50% through either unstable transmission of the transgene or poor expression (Deroles and Gardner, 1988; Registeret al., 1994; McCabeet al., 1999; Liman-ton-Grevet and Julien, 2001). Many factors influence trans-gene expression and inheritance, including the transtrans-gene itself, the host genome and the interaction between them (Prols and Meyer, 1992; Makarevitchet al., 2003; Yinet al., 2004; Shrawatet al., 2007).
Intra-chromosomal recombination occurs during meiosis and mitosis, with spontaneous recombination nor-mally being a rare event (10-6-10-5events per cellular divi-sion). Embryogenic cells have the highest recombination ability, with an average of 3 x 10⁻⁵recombination events per
genome (Yanget al., 2010). The frequency of
recombina-tion can be strongly increased by T-DNA integrarecombina-tions,
Send correspondence to Kalthoum Tizaoui. Department of Biology, Faculty of Sciences, Tunis, FST Campus Universitaire 2092, El Manar, Tunis, Tunisia. E-mail: [email protected].
which cause double-strand breaks (Gorbunova and Levy, 1999; Wehrkamp-Richteret al., 2009), or by other factors related to stress (Dong, 2004). Recombination between copies of the transgene has been reported for transgenic loci in various plant species (Joneset al., 1985; Eckes et al., 1986; Christouet al., 1989; Tovar and Lichtenstein, 1992; Choffenset al., 2001).
The objective of this study was to examine the num-ber of functional inserts, the mode of transgene inheritance and the recombination frequencies of linked inserts in the first three generations of transgenic tobacco lines.
Materials and Methods
Transgenic material
Nicotiana tabacum Lplants were genetically
trans-formed withAgrobacterium tumefaciensby using the leaf
disk method. The T-DNA consisted of a traditional cassette made up of the neomycin phosphotransferase selection marker gene (NptII) driven by the nopaline synthase pro-moter and theb-glucuronidase reporter gene (GUS) under control of theCaMV35S promoter (Sanderset al., 1987). Only the expression and inheritance ofNptIIthat conferred resistance to aminoglycosidic antibiotics was studied. Transformed plants were regenerated on selective medium containing kanamycin and were grown in a chamber under carefully controlled conditions. After three weeks, trans-formed plants were transferred to larger pots and kept in a greenhouse with no pollinating insects or wind in order to avoid pollen dispersal and hybridization. At maturity, seeds from each plant (T0) were collected in a single tube and preserved in bottles with silica gel to avoid humidification and the loss of germination capacity (S Thaminy, unpub-lished data). Seeds from each plant (line T0) were cultured on medium containing MS salts (Murashige and Skoog, 1962) and 100 mg of kanamycin/L in Petri dishes; this
con-centration of antibiotic was sufficient to select transformed plants (Klein et al., 1988; Tavazza et al., 1988; Misra, 1989). In this assay, non-transformed seedlings turned brown and died while transformed seedlings survived and grew healthy. T1 transgenic plants (n= 25-30) were trans-ferred to larger pots and kept in a greenhouse. At maturity, seeds from each line were collected and mixed to form the “bulk” for the T2 generation. Subsequently, 50-100 seeds of the bulk were cultured on selective medium and the T2 resistant plants (n= 25-30) were transferred to soil. At ma-turity, seeds from each transformed plant were harvested and tested for resistance to kanamycin. Table 1 summarizes the experimental protocol.
Segregation analysis
Segregation analysis was done using the c2 test in which observed values were compared to theoretical values corresponding to the integration of one or more copies of the transgene.
Estimation of recombination frequencies
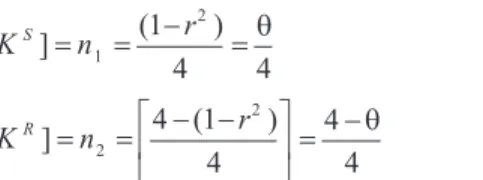
Recombination frequencies were estimated using a genetic approach derived from the maximum likelihood method. Suppose that there are two linked inserts in the host genome, with both insertions (genes) having two allelic forms (K1RandK1Sfor the first gene andK2RandK2S for the second gene).KRindicates the presence of a func-tional insert whereasKSindicates the absence of the insert. The two transgenes are inserted in cis or in trans. The dis-tance separating the physically linked inserts is defined asd
andris the recombination frequency. Whenr³50% the
two transgenes segregate independently and whenr< 50% the two transgenes recombine with a frequencyr. Thus, for two linked inserts in cis:
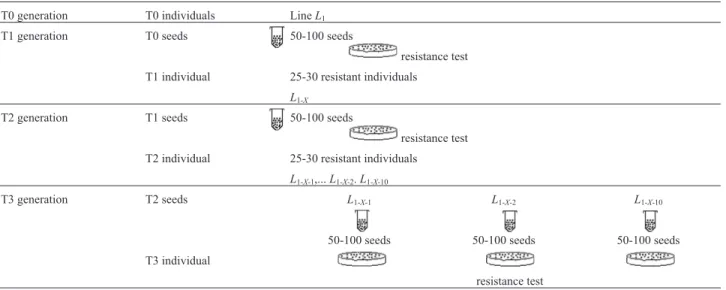
Table 1- Experimental protocol.
T0 generation T0 individuals LineL1 T1 generation T0 seeds 50-100 seeds
resistance test T1 individual 25-30 resistant individuals
L1-X
T2 generation T1 seeds 50-100 seeds
resistance test
T2 individual 25-30 resistant individuals
L1-X-1,...L1-X-2.L1-X-10
T3 generation T2 seeds L1-X-1 L1-X-2 L1-X-10
50-100 seeds 50-100 seeds 50-100 seeds
T3 individual
[KS]=n =( -r )= 1 2 1 4 4 q (1)
[KR]=n =é - -( r ) ë
ê ù
û
ú =
-2 2 4 1 4 4 4 q (2)
wheren1is the frequency of sensitive seedlings,n2is the frequency of resistant seedlings andn1+n2= 1. The proba-bility of observingn1orn2follows multinomial law:
L n n
N n n n n ( ) ( ; ) ! ( ! !) ( ) q q q = =
-probability 1 2
1 2 1 2 4 4 4 (3)
log( ) log !
! ! log log( )
( ) log
L N
n n n n
n n = + + - -1 2 1 2 1 2 4 4 q q (4) d
d L ni
d
d Pi
q(log )=
å
qlog =0;q = + 4 1
1 2
n
n n (5)
The distance between two inserts is defined as:
d r n
n n
= = -+
1 4 1
1 2
(6)
For two linked inserts in trans, the recombination fre-quency was estimated as described above for insertion in
cis, but withn
[ ]
r1 4
2
= . Similarly, for cases involving three
transgenes with two inserts linked in cis or trans the recom-bination frequency was estimated based on the principles outlined above; Table 2 summarizes the calculations in-volved in this analysis.
Results
Theoretical considerations
Segregation ratios depend on the number of func-tional inserts integrated into T0 plants. The greater the number of copies of independently segregating inserts in the genome, the greater the probability of obtainingKR ga-metes and, consequently, the ratio of kanamycin-resistant
plants increases. The marker gene NptII is considered a
dominant trait. Self-pollinated tobacco plants were grown in a greenhouse to avoid inter-crosses. In this model, there are two variables: generation (T1,T2,... Tn,Tn+1) and the number of inserts (I1,I2, ...,In,In+1). The following equa-tions were used to calculate theoretical values in transgenic populations:
XTn+1 =XTn´ y (7)
whereXTnis the number of possible genotypes or zygotes in generationTn,XTn+1is the number of possible genotypes or zygotes in generationTn+1and y is the number of possible gametes that depends on the number of insertions. Genera-tion varies while y is stable.
yIn+1 = ´2 yIn (8)
whereyInis the number of possible gametes in the case of n inserts andyIn+1is the number of possible gametes in the case ofn+ 1 inserts.
xTn+1 =xT1+(xTn´ XT1) (9)
Equation (9) is applied in the case of one insert where xTn+1is the number of sensitive seedlings (KS//KS) in gener-ationTn+1,xT1is the number of sensitive seedlings (KS//KS) in the case of one insert in T1,xTnis the number of sensitive seedlings (KS//KS) in generationTnandXT1is the total num-ber of possible zygotes in T1. This equation can be ex-tended to the case of two, three,...In,In+1inserts:
xIn+1 =xIn´xI1 (10)
wherexIn+1is the number of sensitive seedlings (KS//KS) in the case ofn+ 1 inserts andxI1is the number of sensitive seedlings in the case of one insert. When the progenies of each T0 line were tested on selective medium, sensitive ho-mozygous seedlings (KS//KS) died. This selection was taken into account when calculating the theoretical segregation ratios (Table 3).
When the number of inserts was greater than one copy, Eq. (11) was used to calculate the theoretical number of kanamycin-sensitive homozygous plants in each genera-tion. Sensitive homozygous plants unable to grow on selec-tive medium did not participate in reproduction in the next generation and were excluded from calculations. The popu-lations tended to be homozygous at equilibrium.
¢ + = + - ´
x Tn 1 xTn 1 (xTn XT1) (11)
wherexTn+1is the number of sensitive seedlings (KS//KS) in generationTn+1 with selection against (KS//KS) in genera-tionTn.
Identification of transgenic plants
Eleven self-pollinated transgenic tobacco lines con-sidered as separate transformation events were analyzed (Table 4). Kanamycin-resistant plants had green leaves, were well rooted and developed on selective medium. In contrast, sensitive-kanamycin plants had yellow leaves and weak rooting with delayed growth; these plants died early
Table 2- Estimation of ‘r’ in different cases of linkage.
Linkage in cis Linkage in trans
Two inserts
d r n
n n
= = -+
1 41
1 2
d r n
n n
= = +
4 1
1 2
Three inserts of which two are linked d r
n
n n
= = -+
1 16 1
1 2
d r n
n n
= = +
161
1 2
at the two-leaf stage. The frequency of kanamycin-resistant plants varied among progenies.
Lines L1and L7 had homogenous progenies with a
kanamycin-resistant phenotype in T1 and T2 generations. There was no segregation in either generation, possibly be-cause the parent plants were homozygous for one or more copies of the transgene.
Line L2 progeny was homogenous for
kanamycin-resistance in T1 and heterogeneous in T2. The segregation in T2 did not reflect the hypothesis of a homozygous locus. This finding indicated that the genome harbored many cop-ies of the transgene since the frequency of resistant plants depends on number of expressed inserts.
LinesL3r,L14randL16rhad both kanamycin-resistant and kanamycin-sensitive plants in T1, but in T2 all proge-nies were kanamycin-resistant. The increase in transgene expression may have resulted from the amplification of one or more copies of the original insert or, alternatively, the transgenic locus may have become homozygous in T2.
LinesL4,L4r,L6,L17andL17rhad heterogeneous prog-enies in both generations and the respective parents may have been heterozygous for one or more copies of the transgene. Segregating progenies are the primary material for studying transgene inheritance and recombination.
Inter-transformant variability is attributable to the fact that each transgenic line is the result of a single,
sepa-rate transformation event, with one or moreNpTII
trans-genes being inserted at a single locus, or inserted independ-ently at segregating loci. Consequindepend-ently, screening a transgenic line based only on transgene expression is insuf-ficient; it is more convenient to screen for plants with a sin-gle copy of the transgene.
Segregation analysis
Hypotheses of segregation can be tested only for
het-erogeneous progenies (Table 5). The progenies ofL2were
homogenous with regard to the resistant phenotype in T1. The number of individuals screened was much greater in
T2, in which a sensitive phenotype was observed. Thec2
test was significant for one, two and three inserts, suggest-ing that this line may harbor more than three copies of the transgene.
LinesL3r,L14randL16rhad heterogeneous progenies in T1. Thec2test suggested the presence of more than one in-sert for linesL3randL16r, whereas forL14r, this test was sig-nificant for one, two and three inserts. The corresponding progenies became homogenous and had a kanamycin-resis-tant phenotype in T2, making it impossible to test the hy-pothesis of segregation in this generation. The instability of these transgenic lines may be attributable to amplification of the original transgenic loci or other complex rearrangements. LinesL4,L4r,L6,L17andL17rhad heterogeneous prog-enies in T1 and T2. LineL4rhad a stable 3:1 segregation ra-tio in both generara-tions, in agreement with the presence of a single functional insert. For lineL4, the hypothesis of a sin-gle insert was confirmed in T1 but not verified in T2. A
15:1 segregation ratio was confirmed forL6in T1 and T2
and the hypothesis of three inserts was also confirmed in T2. For linesL17andL17r, thec2test was not significant for a single insert in T1 and not significant for two inserts in T2. The frequency of resistant individuals increased in T2, possibly as a result of recombination and amplification.
Genetic recombination analysis
When inserts were physically linked (Figure 1), the distance between the two inserts and their position (cis or trans) need to be considered. Only distances between 0 and
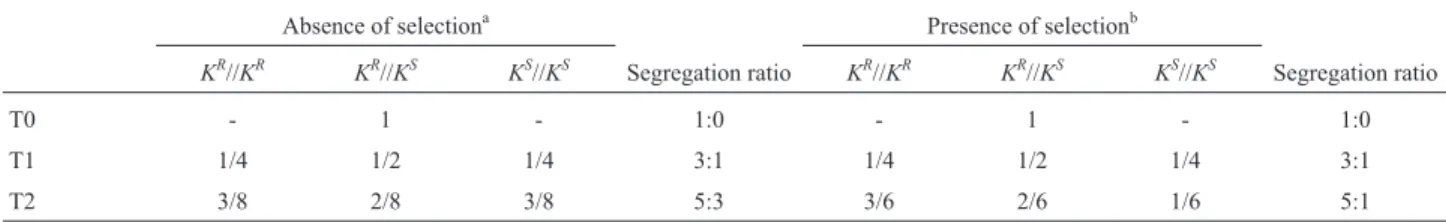
Table 3- Genotypic frequencies of self-pollinated plants harboring a single copy of the transgene.
Absence of selectiona Presence of selectionb
KR//KR KR//KS KS//KS Segregation ratio KR//KR KR//KS KS//KS Segregation ratio
T0 - 1 - 1:0 - 1 - 1:0
T1 1/4 1/2 1/4 3:1 1/4 1/2 1/4 3:1
T2 3/8 2/8 3/8 5:3 3/6 2/6 1/6 5:1
T0 individuals were heterozygous for one copy of the transgene.aPlants germinated on non-selective medium without kanamycin,bPlants germinated on selective medium with kanamycin,KR//KR: kanamycin-resistant homozygous genotype,KR//KS: kanamycin-resistant heterozygous genotype andKs//KS:
kanamycin-sensitive homozygous genotype.
Table 4- Kanamycin-resistance test in T1 and T2 generations. T1 generation T2 generation
Lines KR KS Lines KR KS
L1 61 0 L1-x 32 0
L7 30 0 L7-x 79 0
L2 59 0 L2-x 255 3
L3r 38 5 L3r-x 105 0
L14r 195 31 L14r-x 331 0
L16r 68 13 L16r-x 177 0
L4 134 45 L4-x 324 96
L6 53 3 L6-x 155 11
L17 124 34 L17-x 275 24
L17r 53 9 L17r-x 317 29
L4r 45 21 L4r-x 142 37
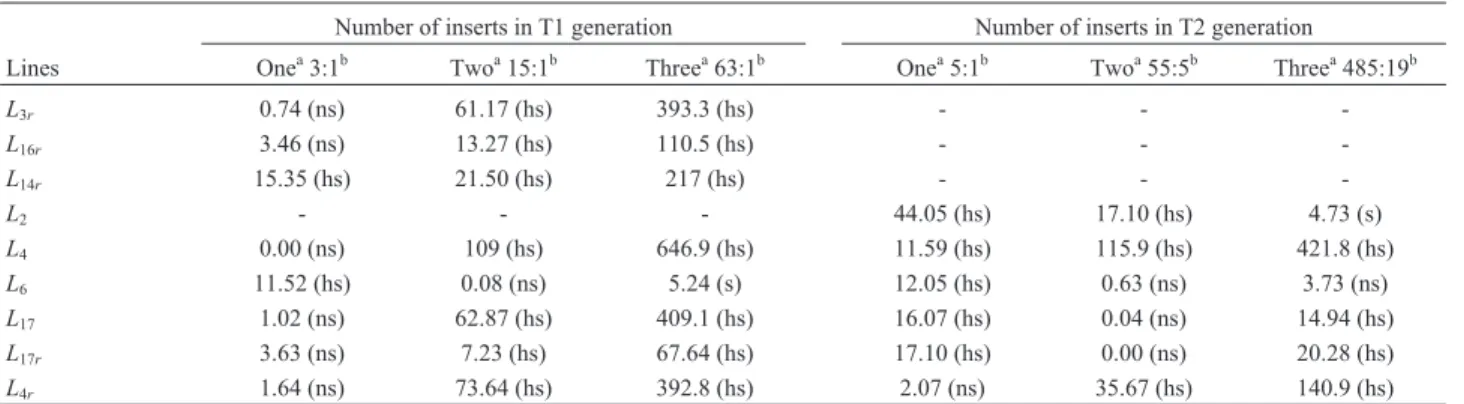
Table 5-c2test results for transgene segregation in the T1 and T2 generations.
Number of inserts in T1 generation Number of inserts in T2 generation
Lines Onea3:1b Twoa15:1b Threea63:1b Onea5:1b Twoa55:5b Threea485:19b
L3r 0.74 (ns) 61.17 (hs) 393.3 (hs) - -
-L16r 3.46 (ns) 13.27 (hs) 110.5 (hs) - -
-L14r 15.35 (hs) 21.50 (hs) 217 (hs) - -
-L2 - - - 44.05 (hs) 17.10 (hs) 4.73 (s)
L4 0.00 (ns) 109 (hs) 646.9 (hs) 11.59 (hs) 115.9 (hs) 421.8 (hs)
L6 11.52 (hs) 0.08 (ns) 5.24 (s) 12.05 (hs) 0.63 (ns) 3.73 (ns)
L17 1.02 (ns) 62.87 (hs) 409.1 (hs) 16.07 (hs) 0.04 (ns) 14.94 (hs)
L17r 3.63 (ns) 7.23 (hs) 67.64 (hs) 17.10 (hs) 0.00 (ns) 20.28 (hs)
L4r 1.64 (ns) 73.64 (hs) 392.8 (hs) 2.07 (ns) 35.67 (hs) 140.9 (hs)
a
number of inserts,btheoretical segregation ratios, ns: not significant, s: significant, hs: highly significant, (-) homogenous resistant progenies were not tested because no segregation was observed.
0.5 Morgans were considered (Table 6). This analysis in linesL3randL16rconfirmed the hypothesis of a single in-sert. The estimated recombination frequencies between two linked inserts in cis were 32% forL3rand 20% for L16r. Linked inserts were not sufficiently far apart to segregate independently, which explains why thec2test was not sig-nificant for a single copy of the transgene. ForL14r, thec2 test was not significant for one, two and three transgene copies. The estimated recombination frequency between two linked inserts in cis was 26%.
ForL2in T2, thec2test was highly significant for the presence of two copies and significant for three inserts. Based on estimated recombination frequencies, we
con-cluded thatL2harbored three inserts, of which two were
linked in trans and recombined with a frequency of 40%. T1 of lineL4confirmed the hypothesis of one copy, with a recombination frequency of 0%. Hypotheses of one and two independent inserts were not confirmed in T2 and the estimated recombination frequency between two linked inserts in cis was very low (4%). For lineL4r, thec2test confirmed the hypothesis of a single insert in T1 and T2 and the recombination frequencies were not considered in these cases.
For lineL6, hypothesis of two inserts was confirmed in T1 and T2, both of which had high recombination fre-quencies (46% in T1 and 49% in T2), indicating that the two inserts segregated independently.
For lineL17, in which the hypothesis of a single insert was confirmed in T1, the recombination frequency was low (7%). In T2, hypothesis of two inserts was confirmed with a recombination frequency of 43%. These results suggested the presence of two tightly linked inserts in cis in T1, with a low recombination frequency. The transgenic locus evol-ved in T2 and inserts were far enough apart to recombine with a high frequency.
For lineL17rin T1, two linked inserts in cis recom-bined with a frequency of 24%, which explained why thec2
test was not significant for the presence of a single insert. The recombination frequency increased sufficiently (to 42%) to allow independent segregation in T2.
The findings described above indicated thatL4,L17 andL17rcarried unstable transgenic loci. Since filler DNA is a property of complex integration and amplification was detected at sites of insertion, we hypothesized that linked inserts were far apart because filler DNA may have been amplified. Similarly, the original copy of the transgene could have been amplified or duplicated. Molecular ap-proaches could be used to confirm these hypotheses.
T3 Generation analysis and screening good events of transformation
For each line with heterogeneous progenies in T1 and T2 we separately analyzed six T3 progenies obtained by self-pollination of T2 individuals (Table 7). Lines L4-x-1, L4-x-2andL4-x-3had heterogeneous progenies with a ratio of 15:1, indicating the segregation of two independent inserts. The corresponding recombination frequencies were high (44%, 40% and 46%, respectively). These lines might be heterozygous with two copies of the transgene. Two proge-nies originated fromL4-x-5andL4-x-6progenies were homog-enous for the kanamycin-resistant phenotype, indicating that the corresponding parents might be homozygous for one or two copies of the transgene. For lineL4-x-4, the pres-ence of one, two and three copies of the transgene was not confirmed and the recombination frequency between two linked inserts in cis was 27%. LineL4was possibly hetero-zygous for two tightly linked inserts in cis in T1, with re-combination frequencies varying between 27% and 46%. The original parent may also have been heterozygous for a single insert which was amplified in T3.
Two lines (L6-x-1, andL6-x-3) had heterogeneous proge-nies, which confirmed the hypothesis of two independently segregating transgenic loci. We rejected the possibility of two linked inserts in trans because the hypothesis of two in-dependent inserts was confirmed in T1 and T2. The
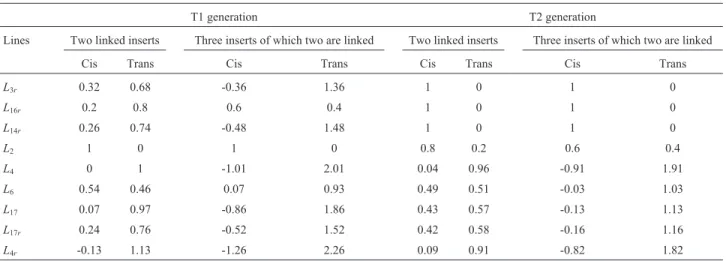
hypoth-Table 6- Estimated distances between linked inserts (Morgan) in the T1 and T2 generations.
T1 generation T2 generation
Lines Two linked inserts Three inserts of which two are linked Two linked inserts Three inserts of which two are linked
Cis Trans Cis Trans Cis Trans Cis Trans
L3r 0.32 0.68 -0.36 1.36 1 0 1 0
L16r 0.2 0.8 0.6 0.4 1 0 1 0
L14r 0.26 0.74 -0.48 1.48 1 0 1 0
L2 1 0 1 0 0.8 0.2 0.6 0.4
L4 0 1 -1.01 2.01 0.04 0.96 -0.91 1.91
L6 0.54 0.46 0.07 0.93 0.49 0.51 -0.03 1.03
L17 0.07 0.97 -0.86 1.86 0.43 0.57 -0.13 1.13
L17r 0.24 0.76 -0.52 1.52 0.42 0.58 -0.16 1.16
esis of three inserts, two of which were linked in cis, was also confirmed; in this case, the recombination frequencies were 38% (L6-x-1) and 35% (L6-x-3). Four lines (L6-x-2,L6-x-4, L6-x-5 andL6-x-6) had homogenous progenies with a kana-mycin-resistant phenotype; these lines may be homozygous for one, two or three copies of the transgene.
T3 confirmed the stability of line L4r; three lines (L4r-x-1,L4r-x-2,L4r-x-1) had segregation ratios indicative of the presence of a single functional transgenic locus. Lines L4r-x-3,L4r-x-4andL4r-x-6were homozygous for one copy of the transgene. From these three progenies, we screened ho-mozygous lines for a single copy of the transgene with sta-ble and acceptasta-ble transgene expression. T3 progenies showed Mendelian inheritance of the transgene and con-firmed the hypotheses for T1 and T2.
LinesL17-x-1andL17-x-5had two inserts each, both of which were linked in T1 and were sufficiently far apart in T3 to allow detectable crossing-over, with frequencies of 33% (L17-x-1) and 43% (L17-x-5). LinesL17-x-2,L17x-3, L17-x-4
and L17-x-6, which had homogenous kanamycin-resistant
progenies, were possibly homozygous for two copies of the transgene.
Line L17r-x had only one heterogeneous progeny
(L17r-x-5) and the estimated recombination frequency be-tween two linked inserts in cis was 31%. Lines L17r-x-1, L17r-x-2,L17r-x-4andL17r-x-6were probably homozygous for two copies of the transgene because their progenies were homogenous for kanamycin-resistance. Interestingly, for the kanamycin-sensitive progeny ofL17r-x-3 the genotype was probably homozygous (KS//KS). Sensitive progeny
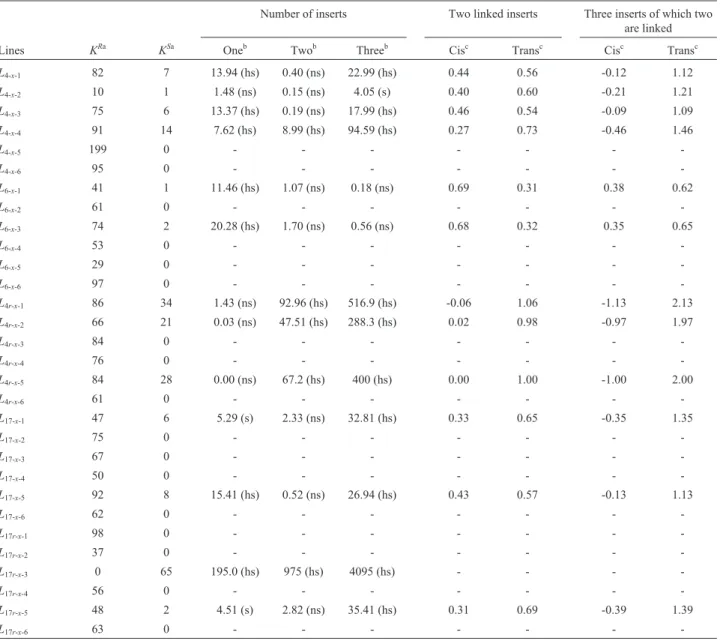
Table 7- Segregation ratios,c2test results and distances between linked inserts (Morgan) in the T3 generation.
Number of inserts Two linked inserts Three inserts of which two are linked
Lines KRa KSa Oneb Twob Threeb Cisc Transc Cisc Transc
L4-x-1 82 7 13.94 (hs) 0.40 (ns) 22.99 (hs) 0.44 0.56 -0.12 1.12
L4-x-2 10 1 1.48 (ns) 0.15 (ns) 4.05 (s) 0.40 0.60 -0.21 1.21
L4-x-3 75 6 13.37 (hs) 0.19 (ns) 17.99 (hs) 0.46 0.54 -0.09 1.09
L4-x-4 91 14 7.62 (hs) 8.99 (hs) 94.59 (hs) 0.27 0.73 -0.46 1.46
L4-x-5 199 0 - - -
-L4-x-6 95 0 - - -
-L6-x-1 41 1 11.46 (hs) 1.07 (ns) 0.18 (ns) 0.69 0.31 0.38 0.62
L6-x-2 61 0 - - -
-L6-x-3 74 2 20.28 (hs) 1.70 (ns) 0.56 (ns) 0.68 0.32 0.35 0.65
L6-x-4 53 0 - - -
-L6-x-5 29 0 - - -
-L6-x-6 97 0 - - -
-L4r-x-1 86 34 1.43 (ns) 92.96 (hs) 516.9 (hs) -0.06 1.06 -1.13 2.13
L4r-x-2 66 21 0.03 (ns) 47.51 (hs) 288.3 (hs) 0.02 0.98 -0.97 1.97
L4r-x-3 84 0 - - -
-L4r-x-4 76 0 - - -
-L4r-x-5 84 28 0.00 (ns) 67.2 (hs) 400 (hs) 0.00 1.00 -1.00 2.00
L4r-x-6 61 0 - - -
-L17-x-1 47 6 5.29 (s) 2.33 (ns) 32.81 (hs) 0.33 0.65 -0.35 1.35
L17-x-2 75 0 - - -
-L17-x-3 67 0 - - -
-L17-x-4 50 0 - - -
-L17-x-5 92 8 15.41 (hs) 0.52 (ns) 26.94 (hs) 0.43 0.57 -0.13 1.13
L17-x-6 62 0 - - -
-L17r-x-1 98 0 - - -
-L17r-x-2 37 0 - - -
-L17r-x-3 0 65 195.0 (hs) 975 (hs) 4095 (hs) - - -
-L17r-x-4 56 0 - - -
-L17r-x-5 48 2 4.51 (s) 2.82 (ns) 35.41 (hs) 0.31 0.69 -0.39 1.39
L17r-x-6 63 0 - - -
-asegregation ratios,bchi square values,cgenetic distances, ns: non-significant, s: significant and hs: highly significantc2test result, KRandKS:
would be expected with a probability of 1:4 in the case of one copy and 1:16 in the case of two copies.
For the genetic engineer who desires excessive ex-pression of the transgene, the best approach would be to screen homozygous lines for two copies of the transgene in homogenous kanamycin-resistant progenies of linesL4,L6, L17andL17r. In addition, lines that yielded homogenous re-sistant progenies in T1 and/or T2 (L1,L7,L3r,L14randL16r) may have more than three copies of the transgene.
Discussion
The analysis of transgenic segregating progenies based on the two approaches described here provided addi-tional information concerning the transgenic population. The major findings of this study agreed with those of previ-ous reports. Genetic analysis confirmed high inter-trans-formant variability. Indeed, expression levels can vary con-siderably among plants transformed with the same construct (Hobbset al., 1990; Peach and Velten, 1991) and in most cases, this expression does not correlate with the copy number (Mlynarovaet al., 1991; Hobbset al., 1993). The copy numbers of transgenic and rearranged fragments are often highly variable, possibly because one or more transgenes can occur at any site.
The two approaches described here were useful for confirming hypotheses regarding the number of insert cop-ies (one insert, two independent or linked inserts, three in-dependent inserts or three inserts of which two were linked) but were unsuitable for non-segregating progenies. Lines with homogenous kanamycin-resistant progenies in T1, T2 and T3 may harbor many copies of the transgene. The best hypothesis for explaining non-segregating progenies is that each chromatid sister possesses a functional transgene. Kohliet al.(1998) reported that the first integrated site acts as a hot spot to integrate more copies of the transgene. This can result in multiple T-DNA insertions (De Neveet al., 1997), with single transgene insertions occurring at a low frequency (Huanget al., 2001). T-DNA acts as an endoge-nous stimulus that activates the cellular machinery (Fagard and Vaucheret, 2000). As a result, a previously stable ge-nome can become particularly reactive in response to newly inserted transgenes, depending on the extent of inter-genic reactions (Jones et al., 1985; Gheysen et al.,
1987; Mayerhoferet al., 1991; Petrov, 1997; Drews and
Yadegari, 2002; Brunaudet al., 2002; Van Attikum and
Hooykaas, 2003).
Inter-transformant variability was accompanied by variation within the transformed line; transgene expression in most of the lines was unstable and increased across gen-erations. Enhanced transgene expression can be explained by amplification or duplication of the original transgene loci. Since amplification and duplication are frequent events during the repair of double-strand breaks (Spenceret al., 1992; Cannellet al., 1999; Cucuet al., 2002) the num-ber of transgene copies increases in the host genome. This
explains why the progenies of linesL3r,L14randL16r be-came homogenous for the kanamycin-resistant phenotype in T2 and T3. This observation agrees with the finding of Yonget al. (2006) who reported that homozygous trans-genic progeny plants were obtained in T2. In meiotic cells, a copy of the transgene on one chromatid can be passed to the allelic position on the opposite homologue so that the transformed line becomes homozygous for the transgene. Moreover, for self-pollinating species, all loci become ho-mozygous at equilibrium. Upon selfing, the epigenetically silenced loci may segregate, thereby restoring expression of the trans-silenced locus (Khaitováet al., 2011).
The modified maximum likelihood method used here showed that there was frequent crossing-over between linked inserts. Crossing-over occurs naturally in plants and its major role is to generate new genetic combinations; this phenomenon is observed at meiosis and during mitosis be-tween sister-chromatids (Galet al., 1991; Gorbunova and Levy, 1999). The frequency of crossing-over increases in response to endogenous and exogenous stimuli such as transgenes newly integrated into the genome. Filler DNA, which has been observed in complex transgenic loci (Ghey-senet al., 1987; Krizkova and Hrouda, 1998; Brunaudet al., 2002; Theunset al., 2002; Somers and Makarevitch, 2004), may be amplified such that inserts that were previ-ously tightly linked at the same transgenic site, now be-come sufficiently separated from each other physically to allow detectable crossing-over.
Several studies have shown that transgene integration sites exhibit different levels of structural complexity rang-ing from the simple integration of two apparently contigu-ous transgene copies to tightly linked clusters of multiple copies of transgenes interspersed with host DNA (Svi-tashevet al., 2000). Epistatic interaction between different loci and/or allelic interaction within a single locus also
oc-cur (Matzke and Matzke, 1995; Napet al., 1997). In the
present study, only lineL4rwas stable, with a 3:1 segrega-tion ratio, indicating the presence of a single funcsegrega-tional transgenic locus. This line represented a good transforma-tion event since the stability of transgene expression is a challenge for genetic engineering. However, such analyses should not be limited to the first or second generation.
The results described here showed that transgene in-heritance followed Mendelian laws. Mendelian segregation has not been verified for most transformed lines because of transgene instability. The instability of transgenic loci may reflect complex rearrangements, especially amplification of the transgene and filler DNA. Amplification can increase the recombination frequencies, leading to more trans-formed genotypes. The scenario of transgene introduction may reflect what happened in the history of gene movement among relatives in land races or through horizontal gene transfer (Parrott, 2010).
and practical issues: (1) they allowed us to screen for stable genetic transformation events that are desirable for breed-ing programs, (2) they provided insights into the evolution and variation of transgenic loci in early generations (T1, T2 and T3) and (3) they facilitated the study of transgene inheritance. However, future investigations should use mo-lecular analyses such as quantitative PCR to quantify trans-genes in the host genome.
Acknowledgments
The present research was funded by the Center of Biotechnology of Borj Cedria. We thank the reviewers for their relevant comments and suggestions to the original pa-per. We also wish to thank Karima Jandoubi and Fakhri Boukhari for their technical support.
References
Britt AB (1999) Molecular genetics of DNA repair in higher plants. Trends Plant Sci 4:20-25.
Brunaud V, Balzergue S, Dubreucq B, Aubourg S, Samson F, Chauvin S, Bechtold N, Cruaud C, DeRose R, Pelletier G,et al.(2002) T-DNA integration into the Arabidopsis genome depends on sequences of pre-insertions sites. EMBO J 3:1152-1157.
Cannell ME, Doherty A, Lazzeri PA and Barcelo P (1999) A pop-ulation of wheat and tritordeumtransformants showing a high degree of marker gene stability and heritability. Theor Appl Genet 99:772-784.
Chen L, Marmey P, Taylor JN, Brizard JP, Espinoza C, D’Cruz P, Huet H, Zhan S, Kochko A, Beachy RN,et al.(1998) Ex-pression and inheritance of multiple transgenes in rice plants. Nat Biotechnol 16:1060-1064.
Choffnes DS, Philip R and Vodkin LO (2001) A transgenic locus in soybean exhibits a high level of recombination. In Vitro Cell Dev Biol Plant 37:756-762.
Christou P, Swain FW, Yang NS and McCabe DE (1989) Inheri-tance and expression of foreign genes in transgenic soybean plants. Proc Natl Acad Sci USA 86:7500-7504.
Cucu N, Tenea G and Gavrila L (2002) Genetically modified me-dicinal plants: II Transfer and expression of a marker kana-mycin resistance gene inAtropa belladonnaplants. Roum Biotechnol 7:869-874.
De Neve N, De Buck S, Jacobs A, Van Montagu M and Depicker A (1997) T-DNA integration patterns in cotrans formed plant cells suggest that T-DNA repeats originate from coin-tegration of separate T-DNAs. Plant J 11:15-29.
Deroles SC and Gardner RC (1988) Expression and inheritance of kanamycin resistance in a large number of transgenic petu-nias generated byAgrobacterium-mediated transformation. Plant Mol Biol 11:355-364.
Dong X (2004) Pathogen-induced systemic DNA rearrangement in plants. Trends Plant Sci 9:60-61.
Drews GN and Yadegari R (2002) Development and function of the Angiosperm female gametophyte. Annu Rev Genet 36:99-124.
Eckes P, Rosahl S, Schell J and Willmitzer L (1986) Isolation and characterization of a light inducible, organ specific gene from potato and its analysis of expression after tagging and
transfer into tobacco and potato schoots. Mol Gen Genet 205:14-22.
Fagard M and Vaucheret H (2000) (Trans)Gene silencing in plants: How many mechanisms? Annu Rev Plant Physiol 51:167-194.
Gal S, Pisan B, Hohn T, Grimsley N and Hohn B (1991) Genomic homologous recombination in plants. EMBO J 10:1571-1578.
Gheysen G, Van Montagu M and Zambryski P (1987) Integration
ofAgrobacterium tumefaciens: Transfer DNA involves
re-arrangements of target plant DNA sequences. Proc Natl Acad Sci USA 84:61-69.
Gorbunova V and Levy AA (1997) Non-homologous DNA end joining in plant cells is associated with deletions and filler DNA insertions. Nucleic Acids Res 25:4650-4657. Gorbunova V and Levy AA (1999) How plants make ends meet:
DNA double-strand break repair. Trends Plant Sci 4:263-268.
Hobbs SLA, Kpodar P and Delong CMO (1990) The effect of T-DNA number and methylation on reporter gene expres-sion in tobacco transformants. Plant Mol Biol 15:851-864. Hobbs SLA, Warkentin TD and Delong CMO (1993) Transgene
copy number can be positively or negatively associated with transgene expression. Plant Mol Biol 21:17-26.
Huang JQ, Wei ZM, An HL and Zhu YX (2001)Agrobacterium
tumefaciensmediated transformation of rice with the spider
insecticidal gene conferring resistance to leaf folder and striped stem borer. Cell Res 11:149-155.
Jones JD, Weller SC and Goldsbrough PB (1994) Selection for kanamycin resistance in transformedPetuniacells leads to the co-amplification of a linked gene. Plant Mol Biol 24:505-514.
Jones JDG, Dunsmuir P and Bedbrook J (1985) High level of ex-pression of introduced chimeric genes in regenerated trans-formed plants. EMBO J 4:2411-2418.
Khaitová LC, Fojtová M, Krízová K, Lunerová J, Fulnecek J, Depicker A and Kovaík A (2011) Paramutation of tobacco transgenes by small RNA-mediated transcriptional gene si-lencing. Epigenetics 6:650-660.
Klein TM, Harper EC, Sanford JC, Fromm ME and Maliga P (1988) Stable genetic transformation of intact Nicotiana
cells by the particle bombardment process. Proc Natl Acad Sci USA 85:8502-8505.
Kohli A, Leech M, Vain P, Laurice DA and Christou P (1998) Transgene organization in rice engineered through direct DNA transfer supports a two-phase integration mechanism mediated by the establishment of integration hot spots. Proc Natl Acad Sci USA 95:7203-7208.
Krizkova L and Hrouda M (1998) Direct repeats of T-DNA inte-grated in tobacco chromosome: Characterization of junction regions. Plant J 16:673-680.
Limanton-Grevet A and Jullien M (2001)Agrobacterium -medi-ated transformation ofAsparagus officinalisL., molecular and genetic analysis of transgenic plants. Mol Breed 7:141-150.
Matzke MA and Matzke AJM (1995) How and why do plants in-activate homologous (trans) genes? Plant Physiol 107:679-685.
Mayerhofer R, Koncz-Kalman Z, Nawrath C, Bakkeren G, Cra-meri A, Angelis K, Redei GP, Schell J, Hohn B and Koncz C (1991) T-DNA integration: A mode of illegitimate recombi-nation in plants. EMBO J 10:697-704.
McCabe MS, Mohapatra UB, Debnath SC, Power JB and Davey MR (1999) Integration, expression and inheritance of two linked T-DNA marker genes in transgenic lettuce. Mol Breed 5:329-344.
Misra S (1989) Transformation ofBrassica napus L. with a dis-armed-octopine plasmid of Agrobacterium tumefaciens: Molecular analysis and inheritance of the transformed phe-notype. J Exp Bot 41:269-275.
Mlynrov L, Loonen A, Heldens J, Jansen RC, Keizer P, Stiekema WJ and Nap JP (1994) Reduced position effect in mature transgenic plants conferred by the chicken lysozyme matrix associated region. Plant Cell 6:417-426.
Murashige T and Skoog F (1962) A revised medium for rapid growth and bio-assays with tobacco tissue culture. Physiol Plant 15:473-497.
Nap JP, Conner AJ, Mlynarova L, Stiekema WJ and Jansen RC (1997) Dissection of a synthesized quantitative trait to char-acterize transgene interactions. Genetics 147:315-320. Parrott W (2010) Genetically modified myths and realities. N
Biotechnol 27:545-551.
Pawlowski WP and Somers DA (1996) Transgenic inheritance in plants genetically enginerated using microprojectile bom-bardment. Mol Biotechnol 6:17-30.
Peach C and Velten J (1991) Transgene expression variability (position effect) of CAT and GUS reporter genes driven by linked divergent T-DNA promoters. Plant Mol Biol 17:49-60.
Perret SJ, Valentine J, Leggett JM and Morris P (2003) Integra-tion, expression and inheritance of transgenes in hexaploid oat (Avena sativa L.). J Plant Physiol 160:931-943. Petrov D (1997) Slow but steady: Reduction of genome size
through biased mutation. Plant Cell 9:1900-1901.
Prols F and Meyer P (1992) The methylation patterns of chromo-somal integration regions influence gene activity of trans-ferred DNA inPetunia hybrida.Plant J 2:465-475. Register JC, Peterson DJ, Bell PJ, Bullock WP, Evans IJ, Frame
B, Greenland AJ, Higgs NS, Jepson I, Jiao S,et al.(1994) Structure and function of selectable and non-selectable transgenes in maize after introduction by particle bombard-ment. Plant Mol Biol 25:951-961.
Salomon S and Puchta H (1998) Capture of genomic and T-DNA sequences during double-strand repair in somatic plant cells. EMBO J 17:6086-6095.
Sanders PR, Winter JA, Bamason AR, Rogers SG and Fraley RT (1987) Comparison of cauliflower mosaic virus 35S and nopaline synthase promoters in transgenic plants. Nucleic Acids Res 15:1543-1558.
Shrawat AK, Becker D and Lörz H (2007) Agrobacterium
tumefaciens-mediated genetic transformation of barley
(Hordeum vulgareL). Plant Sci 172:281-290.
Somers DA and Makarevitch I (2004) Transgene integration in plants poking or patching holes in promiscuous genomes? Curr Opin Biotechnol 15:126-131.
Spencer TM, O’Brien JV, Start WG, Adams TR, Gordon-Kamm WJ and Lemaux PG (1992) Segregation of transgenes in maize. Plant Mol Biol 18:201-210.
Srivastava V, Vasil V and Vasil IK (1996) Molecular character-ization of the fate of transgenes in transformed wheat
Triticum aesitivum L. Theor Appl Genet 92:1031-1037.
Svitashev S, Ananiev E, Pawlowski WP and Somers DA (2000) Association of transgene integration sites with chromosome rearrangements in hexaploid oat. Theor Appl Genet 100:872-880.
Takano M, Egawa H, Ikeda JE and Wakasa K (1997) The struc-tures of integration sites in transgenic rice: Three strucstruc-tures of integration sites in transgenic rice. Plant J 11:353-361. Tavazza R, Ordas RJ, Tavazza M, Ancora G and Benvenuto E
(1988) Genetic transformation ofNicotiana clevelendiusing a Ti-plasmid derived vector. Plant Physiol 133:640-644. Theuns I, Windels P, Debuck S, Depicker A, Van Bockstale E and
Deloose M (2002) Identification and characterization of T-DNA inserts by T-DNA finger printing. Euphytica 123:75-84.
Tinland B (1996) The integration of T-DNA into plant genome. Trends Plant Sc 1:178-184.
Tovar J and Lichtenstein C (1992) Somatic and meiotic chromo-somal recombination between inverted duplications in trans-genic tobacco plants. Plant Cell 4:319-322.
Van Attikum H and Hooykaas PJJ (2003) Genetic requirements for the targeted integration of Agrobacterium T-DNA in
Saccharomyces cerevisiae. Nucleic Acids Res 31:826-832.
Wehrkamp-Richter S, Degroote F, Laffaire JB, Wyatt P, Perez P and Picard G (2009) Characterisation of a new reporter sys-tem allowing high throughput in planta screening for recom-bination events before and after controlled DNA double strand break induction. Plant Physiol Biochem 47:248-255. Yang Z, Tang L, Li M, Chen L, Xu J, Wu G and Li H (2010) Mon-itoring homologous recombination in rice (Oryza sativaL.). Mutat Res 691:55-63.
Yin Z, Plader W and Malepszy S (2004) Transgene inheritance in plants. J Appl Genet 45:127-144.
Yong Z, Bao-Yu Y and Shi-Yun S (2006) Inheritance and analysis of herbicide-resistant transgenic soybean lines. Acta Genet Sin 33:1105-1111.
Zhu C, Wu J and He C (2010) Induction of chromosomal inver-sion by integration of T-DNA in the rice genome. J Genet Genomics 37:189-196.
Associate Editor: Adriana Hemerly