Degradation of a model azo dye in submerged anaerobic membrane
bioreactor (SAMBR) operated with powdered activated carbon (PAC)
B.E.L. Baêta
a,*, H.J. Luna
b, A.L. Sanson
a, S.Q. Silva
c, S.F. Aquino
daPost-Graduate Programme in Environmental Engineering, Federal University of Ouro Preto, Ouro Preto 35400-000, Brazil bPost-Graduate Programme in Environmental Engineering, University of the Andes, Bogotá, Colombia
cBiological Sciences Department, Federal University of Ouro Preto, Ouro Preto, Brazil dChemistry Department, Federal University of Ouro Preto, Ouro Preto, Brazil
a r t i c l e
i n f o
Article history:
Received 25 October 2012 Received in revised form 26 February 2013 Accepted 17 May 2013 Available online 26 June 2013
Keywords:
Submerged anaerobic membrane bioreactor (SAMBR)
Azo dye
Powdered activated carbon (PAC) Volatile fatty acids (VFA)
a b s t r a c t
This work investigated the anaerobic degradation of the model azo dye Remazol Yellow Gold RNL in an upflow anaerobic sludge blanket reactor (UASB) and two submerged anaerobic membrane (SAMBR) bioreactors, one of which (SAMBR-1) was operated with powdered activated carbon (PAC) in its interior. The reactors were operated at 35C with a hydraulic retention time of 24 h in three operational phases, aimed to assess the effect of external sources of carbon (glucose) or redox mediator (yeast extract) on the removal or color and organic matter. The results showed that removal efficiencies of COD (73e94%) and color (90e94%) were higher for SAMBR-1 when compared to SAMBR-2 (operated without PAC) and UASB reactors. In addition, the presence of PAC in SAMBR-1 increased reactor stability, thereby leading to a lower accumulation of volatile fatty acids (VFA). The microfiltration membrane was responsible for an additional removal ofw50% of soluble residual COD in the form of VFA, thus improving permeate quality. On its turn, PAC exhibited the ability to adsorb byproducts (aromatic amines) of azo dye degradation as well as to act as source of immobilized redox mediator (quinone groups on its surface), thereby enhancing color removal.
Ó2013 Elsevier Ltd. All rights reserved.
1. Introduction
In the last years, the textile industry has grown economically at national and international level leading to a high production of wastewater which is mainly produced in the units of desizing, scouring, bleaching, mercerizing, dyeing and printing (Kumar et al., 2008). In general textile wastewater has a great amount of organic compounds such as surfactants, softeners, fixers and dyes. These compounds contribute to Chemical Oxygen Demand (COD) or cause considerable color to the effluent in the case of dyes. Textile dyes lead to a disagreeable aesthetic aspect, and compromise the photosynthesis of algae, which reduces the amount of Dissolved Oxygen (DO) and might lead to mortality of aquatic species (Weisburger, 2002). In addition, textile dyes damages the envi-ronment and poses a threat to the human health, since some of them or their byproducts are carcinogenic or mutagenic (Kalyuzhnyi and Sklyar, 2000). It is estimated that there are more than 3000 types of dyes, and that the azo type, characterized by the
presence of one or moreeN]Nebond, representsw70% of the
commercialized dyes (Hunger et al., 2004).
Textile effluents can be treated by a variety of processes, which includes biological and physicalechemical schemes. In Brazil most
textile industries employ, for treatment of their wastewater, the well-known biological process of activated sludge. Such process is normally efficient in removing the organic load from wastewater, but is not so effective in decolorizing it. The use of activated carbon or coagulants might be used as a complement, which normally generates a high amount of sludge that needs to be properly
handled (Santos et al., 2009). According to Van Der Zee and
Villaverde (2005)currently there is no single technology capable of efficiently and economically removing color from textile effl u-ents, which keeps open research opportunities in thisfield.
An important wastewater treatment technology that has been researched for azo dyes removal is the anaerobic digestion (Georgiou and Aivasidis, 2006). Some electrophilic contaminants, such as the azo dyes, can be used asfinal electron acceptor in anaerobic environments, thereby leading to the reduction of dye chromophore system and color removal. Indeed, different research groups have found that anaerobic biotechnology is more efficient in azo dye degradation when compared with its aerobic counterpart, *Corresponding author. Tel.:þ55 (0)31 3559 1837.
E-mail address:bruno.baeta@ambiental.ufop.br(B.E.L. Baêta).
Contents lists available atSciVerse ScienceDirect
Journal of Environmental Management
j o u r n a l h o m e p a g e : w w w . e l s e v i e r . c o m / l o c a t e / j e n v m a n
and have reported removal efficiencies varying from 60% to 80% for COD and from 40% to 95% for color (Baêta et al., 2012a; Dos Santos et al., 2006; Méndez-Paz et al., 2005).
One strategy to increase the efficiency of color removal in anaerobic systems is the use of redox mediators (Dos Santos et al., 2005), since such compounds would enhance the kinetics of azo dye degradation by acting as electron carriers. Several authors have
shown that compounds such as riboflavin (vitamin B2) and
quinone-like compounds can act as redox mediators Cervantes
et al., 2001; Field and Brady, 2003; Rau et al., 2002). However, one disadvantage of anaerobic treatment of azo dyes is the for-mation of toxic byproducts such as aromatic amines, which can lead to volatile fatty acids (VFA) accumulation and process failure in terms of COD removal, de-granulation and biomass loss.
In order to minimize biomass loss triggered by the presence of toxic compounds some alternatives like the use of the membrane and powdered activated carbon (PAC) are suggested in the litera-ture (Baêta et al., 2012a, b). The use of membranes immersed in anaerobic reactors increases the cell retention time and produces a better quality effluent, which can be reused as process water (Hu and Stuckey, 2006). In its turn, the addition of PAC can control toxicity, improve the granulation process and help to control membrane fouling due to the adsorption of proteins, biopolymers and soluble microbial products (Akram and Stuckey, 2008; Aquino et al., 2006).
Given the obvious advantages offered by the anaerobic biotechnology (low installation and operation costs) and by membrane process when treating distinct types of wastewater (improves effluent quality, increases sludge age), the main objec-tive of this study was to evaluate the performance of submerged anaerobic membrane bioreactors (SAMBR) when compared to upflow anaerobic sludge blanket reactor (UASB) in the removal of an azo dye (Remazol Yellow Gold RNL) largely used in our region. In addition, the influence of PAC addition inside the SAMBR and the effect of yeast extract (source of the redox mediator riboflavin) on color removal were also investigated.
2. Material and methods
2.1. Apparatus and operational conditions
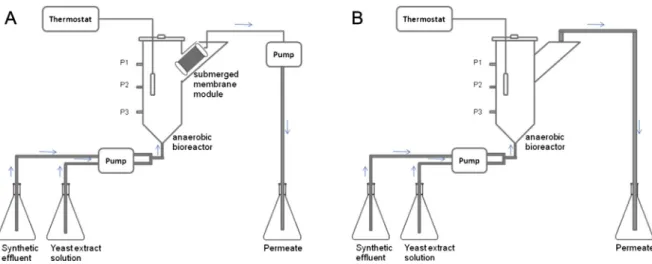
Two SAMBR (anaerobic reactors with microfiltration module placed inside of their settler compartment, i.e. side arm at the re-actor’s top right as seen inFig. 1) were built using polyvinyl chloride (PVC) pipes andfittings, and each reactor had a working volume of
3.25 L. The microfiltration membranes (0.8 m2 of hollowfibers, with pore sizes of 0.4
mm) were made of Polyimide and the modules
were manufactured by PAM membranes (PAM e Membranas
SeletivasÒ
). A third anaerobic system (UASB reactor) was built as control and had a working volume of 3.25 LFig. 1shows the scheme of the SAMBR (A) and UASB (B) reactors used.
SAMBR-1 was operated with 4.0 g L 1of PAC (SynthÒ ) in its interior, whereas the SAMBR-2 and UASB were operated without such adsorbent. The choice for this concentration of PAC is based in others works reported in the literature (Akram and Stuckey, 2008; van der zee et al., 2003). It is noteworthy that PAC was added only once, at the beginning of SAMBR-1 operation. All three reactors were operated at 35C using a hydraulic retention time (HRT) of 24 h, which was the HRT employed by other authors such asDos Santos et al. (2005)to treat the same type of wastewater. During operation the pH was kept in the 6.5e7.5 range by adding Na2CO3 0.1 M or HCl 0.01 M directly into the reactors, despite the fact that the yeast extract (HimediaÒ
) solution contained sodium bicarbon-ate as a buffer and micro and macronutrients. The composition of nutrient solution was chosen to maintain the minimum COD: N:P proportion of 350:5:1 (Mesquita et al., 2012).
The reactors were incubated with 0.8 L of anaerobic sludge (10 g L 1) from a demo scale UASB reactor fed with raw sewage in operation at the Center for Research and Training on Saniation (CePTS) UFMG/COPASA, located at the Arrudas WWTP, which re-ceives the major part of the domestic sewage of the urban area of Belo Horizonte city (Minas Gerais state, Brazil).
All reactors (SAMBR-1, SAMBR-2 and UASB) were operated during three phases, where each phase lastedw42 days, counted only after reactor stabilization. The stabilization time was deter-mined when the variation of COD removal efficiency was lower than 5%. The conditions of each phase as well as the objectives are shown inTable 1.
2.2. Analytical procedures
During reactor operation, samples of influent and effluent were collectedfive times a week for analysis of chemical oxygen demand (COD), color, pH and turbidity. In addition, samples of anaerobic effluent and from inside of the reactors (SAMBR-1, SAMBR-2 and UASB) were collected once a week for analysis of volatile suspended solids (VSS) and volatile fatty acids (VFA). The analysis of COD, pH, turbidity and VSS followed the procedures detailed in the Standard Methods for the Examination of Water and Wastewater (Clescerl et al., 2005).
COD analysis was employed with the supernatant obtained after centrifuging the sample for 15 min at 5000 rpm (Fanem Excelsa 11 centrifuges, model 206 BL), hence the results of COD refer to the soluble fraction. Color analysis was measured using a spectropho-tometer (HP 8453 UVeVisible system) in the wavelength of highest
absorbance (
l
¼410 nm) of Remazol Yellow Gold, RNL, the model azo dye which was generously provided by a local textile industry and used in this study without purification.VFA was analyzed by high performance liquid chromatography (HPLC) using an ion exchange column (Aminex HPX-87H, BioRad) which was kept at 55C under isocratic mode (0.6 ml min 1 of H2SO4 0.01 M). For this, 10
mL of the centrifuged samples was
injected in the Shimadzu HPLC so that the separated VFA could be detected at 210 nm in a diode array detector (DAD). The VFA method was properly validated as detailed elsewhere (Mesquita et al., 2012).VFA concentration was then used to estimate the fraction of COD due to such intermediate compounds, according to Equation(1).
CODðVFAÞ ¼0:35½formateþ1:07½acetateþ1:51
½propionateþ1:82½butyrateþisobutyrate þ2:04½valerateþisovalerate (1)
The identification of aromatic amines generated in the anaer-obic degradation of Remazol Yellow Gold RNL was carried out using the same methodology described before for VFA analysis, however their detection was at 191 nm, since according toPinheiro et al. (2004) at this wavelength the aromatic amines (e.g. sulfanilic acid) generated as byproducts of sulfonated azo dye degradation have higher absorbance.
The identification of quinone groups on the surface of PAC was accomplished by Fourier Transformed Infrared (FTIR) spectroscopy in a Shimadzu equipment (model IR Affinity) using a deuterated detector (triglycine sulfate doped withL-Alanine, DLATGS) in the
frequency range of 4000e400 cm-1 and employing a diffuse
reflectance accessory.
2.3. Adsorptions tests
To estimate VFA adsorption by PAC, samples from inside the SAMBR-2 were used in batch adsorption tests. For this, 100 mL of centrifuged samples from inside SAMBR-2 were transferred tofive erlenmeyers kept at 35C and 200 rpm for 24 h in an orbital shaker (model SL 120250, SolabÒ
), which received distinct mass of PAC (from 1 to 8 g/L). The concentration of VFA in the samples was previously evaluated and a known amount of VFA was spiked to the SAMBR-2 samples to raise the concentration of acetic, propionic and butyric acid to 200 mg L 1.
After the equilibrium was reached (12 h) the erlenmeyer sam-ples were centrifuged and analyzed for VFA. Adsorption data was then used with the isotherm models of Langmuir, Freundlich and Temkin, as described elsewhere (Teixeira et al., 2012).
To measure the azo dye adsorption by PAC 200 mL of azo dye solutions (50, 40, 30, 10 and 1 mg/L) were kept under stir (300 rpm) for 2 h with afixed amount of PAC (4 g/L). After this contact time the solutions were centrifuged and the amount of azo dye adsorbed in eachflask was evaluated by measuring the solutions absorbance at 410 nm. The adsorption data was analyzed according to the isotherm models of Langmuir, Freundlich and Temkin, as described elsewhere (Teixeira et al., 2012).
2.4. Specific microbial growth rate determination
The specific microbial growth rate (m) was estimated taking into account the volatile suspended solid (VSS) variation during the operational time in each phase. The results were obtained accord-ing to Equation(2), where (dX) is the VSS mass change, (Xo) the initial VSS mass used to inoculate the reactors and (dt) the run time employed in each phase. It is noteworthy that to calculate the mass of VSS in SAMBR-1, a previous study was carried out to evaluate the contribution of PAC to the volatile solids, as detailed in (Baêta et al., 2012a).
m
¼ dX=Xo$dt (2)2.5. Statistical analysis
In order to verify whether the differences observed between the SAMBR and UASB were significant, statistical tests were employed by means of the software StatisticaÒ
. The ShapiroeWilk test was
used to confirm that the results did not follow a normal distribu-tion, and then non-parametric tests (KruskaleWallis ANOVA,
Stu-denteNewman and ManneWhitney) were applied. A p-value
lower than 0.05 was adopted for rejecting the null hypothesis (Ho).
3. Results and discussion
Fig. 2(A) shows the COD efficiency removal for all reactors during the three operational phases. It can be seen that the mem-brane reactors SAMBR-1 and SAMBR-2 led to higher percentages of COD removal when compared to UASB reactor. This clearly shows the membrane positively contributed for organic matter removal, possibly by retaining colloidal organic compounds such as protein and polysaccharides generated from biomass decay (soluble
mi-crobial products) as shown before by Aquino et al. (2006).
Furthermore, the reactor SAMBR-1 had a better performance in removing organic matter than SAMBR-2, and this is due to the fact that SAMBR-1 was operated with a concentration of 4 g/L of PAC in its interior. This shows that PAC positively influenced the removal of organic matter in the anaerobic system, probably by adsorbing toxic intermediate compounds, as it will be discussed later. In
addition, Fig. 2(A) shows that when the reactors SAMBR-1 and
SAMBR-2 were fed with yeast extract (phase 3) there was an in-crease in the COD removal efficiency, which was probably due to
Table 1
Operational phases of the reactors SAMBR-1, SAMBR-2 and UASB.
Phases Dye (mg L1) Nutrient
Solutiona
Yeast
Extractb(mg L1)
Glucosec (mg L 1)
Organic Load (kg m3d1)
Operation time (d)
Objective
1 No Yes No Yes (500) 0.53 42 Biomass Adaptation
2 Remazol Yellow Gold RNL (50) Yes No Yes (500) 0.59 42 Assessment of glucose as
carbon source
3 Remazol Yellow Gold RNL (50) Yes Yes (500) No 0.59 42 Assessment of yeast extract
as source of redox mediator
aAs described inMesquita et al. (2010). bContained 50
the presence of yeast extract, source of the redox mediator riboflavin.
SAMBR-1 exhibited higher median COD removal efficiencies
(>70%) in all operational phases, which were statistically different (p-valued<0.05) from those exhibited by SAMBR-2 and UASB. During Phase 3 the median removal efficiency increased to 94% in SAMBR-1, and this is at even with the results obtained byAkram and Stuckey (2008)who observed higher organic matter removal (94% in average) when a SAMBR containing PAC (1.7 g/L) was operated with sucrose as carbon source under an HRT of 20 h.
A hypothesis to explain the high values of organic matter removal obtained in all operational phases of the reactors SAMBR-1 and SAMBR-2, when compared to the UASB reactor, is that the microfiltration enhanced the effluent quality by retaining colloidal material and active biomass, which could not be accomplished in the UASB despite the lower upflow velocities employed. It is well known that microfiltration membranes can promoted an increase in the cell retention time (CRT), thus avoiding sludge washout (Dereli et al., 2012), especially in systems operated under stressful conditions. According toLiao et al. (2006)there is a direct relationship between the CRT, biomass accumulation and COD removal efficiency, which is confirmed by Fig. 2B which shows there was a higher amount of biomass inside the SAMBR in all operational phases.
Another behavior observed in the SAMBR was the low COD
concentration (CODVFA and CODnot VFA) in the effluents when
compared to the anaerobic supernatant (inside reactors). Fig. 3 shows that when the effluent passed through the membrane, the CODVFA concentration decreased by 50%, which was not observed in the UASB reactor. Considering that it is improbable that a microfiltration membrane can reject low molecular weight com-pounds such as acetate (59 g/mol), propionate (73 g/mol) and butyrate (85 g/mol); a hypothesis for explaining the VFA reduction is the formation of a biofilm on the membrane surface. Other au-thors such as Martinez-Sosa et al. (2012) also found significant differences between the VFA concentration from inside SAMBR and the effluent and suggested that a biologically active part of the cake layer contributed to further degrade a part of the incoming organic
load. In addition to that it is also possible that the negatively charged VFA are rejected from the membrane by electrostatic repulsion. Unfortunately we do not have zeta potential or PCZ (pH of charge zero) of the membrane to confirm this hypothesis.
Fig. 3also shows that CODVFAinside SAMBR-1 was significantly lower than the other two reactors during all operational phases. This behavior is probably related to the high rate of VFA degrada-tion inside SAMBR-1, motivated by better biomass acclimadegrada-tion and accumulation, resulting from PAC capacity to adsorb toxic sub-stances (e.g. aromatic amines and azo dyes) that may hamper the growth of anaerobic microorganisms and the intermediate VFA (as it will be discussed later).
Fig. 4shows that propionate was the main VFA accumulated in all reactors, mainly in SAMBR-2 and UASB. It is well known that VFA accumulation in anaerobic systems occurs due to microbial growth imbalance caused by stressful conditions such as nutrient defi -ciency and toxicity, as well as due to kinetic and thermodynamic constraints (Aquino and Chernicharo, 2005). Since all reactors were fed with nutrient solution and at the same environmental condi-tions, the lower accumulation of propionate in SAMBR-1 is mainly attributed to the adsorption of aromatic amines by PAC, since the accumulation of such azo dye degradation byproducts was low in SAMBR-1 despite the high color removal efficiencies observed, as it will be shown later.
In addition, SAMBR-1 performance might have been enhanced by PAC due to the adsorption of intermediate VFA, thus avoiding thermodynamic inhibition of some conversion routes (e.g. propi-onate into acetate) and keeping an adequate balance between acid producers (e.g. acidogenesis) and consumers (e.g. acetogenesis and methanogenesis). To confirm this, adsorption studies of VFA onto PAC were carried out, as shown inTable 2. It is noteworthy that the adsorption data was tested with Freundlich, Langmuir and Temkin isotherm models, butTable 2shows only Langmuir model param-eters since it yielded the bestfitting.
Table 2shows that PAC exhibited a relatively high adsorption capacity for acetate and butyrate, and based on the values ofQmaxit was possible to estimate that the PAC added inside the reactor at the beginning of SAMBR-1 operation would be able to retain
Re
mov
a
l
ef
fic
ie
n
cy
CO
D
(%
)
phases
UASB SAMBR-2
SAMBR-1
3 2 1 3 2 1 3 2 1 100
90
80
70
60
50
40
30
20
10
V
SS
(g
)
phases
UASB SAMBR-2
SAMBR-1
3 2 1 3 2 1 3 2 1 40
35
30
25
20
15
10 94
86
73
85
77
64
70 73
49
33.4
23.4
12.8
35.1
25.9
13.4
21.0
16.1
9.6
A)
B)
81.2 mg of acetate on its surface. The acetate concentration differ-ences observed between SAMBR 1 and 2 varied from 14 mg (phase 3) to 46 mg (phase 1), corroborating the hypothesis that PAC might have played an important role in keeping a low acetate concen-tration into the bulk solution. A lower acetate concenconcen-tration would favor the acetogenic reactions, thereby reducing the accumulation of propionate and butyrate in the anaerobic supernatant and
enhancing acetoclastic methanogenesis. This would, in its turn, lead to a higher COD removal from the liquid phase and better reactor stability, and Figs. 3 and 4 show this was the case for SAMBR-1.
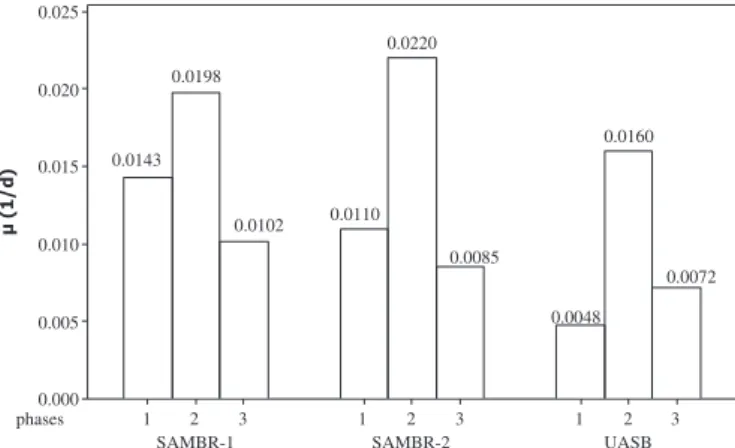
Specific microbial growth rate (m) was calculated (Fig. 5) and the results indicate that indeed there was a higher net growth in SAMBR-1 when compared to SAMBR-2 and UASB. The mass of VSS
CO Dv fa ( m g /L ) Sampling point phase 3 phase 2 phase 1 outside inside outside inside outside inside 360 240 120 0 COD v fa (m g /L ) Sampling point phase 3 phase 2 phase 1 outside inside outside inside outside inside 360 240 120 0 CO Dv fa ( m g /L ) Sampling point phase 3 phase 2 phase 1 outside inside outside inside outside inside 360 240 120 0 34 73 27 60 23 53 99 216 96 202 70 142 207 219 202 213 142 151 SAMBR-1 SAMBR-2 UASB
Fig. 3.Evaluation of CODVFAin samples from inside and effluent of reactors SAMBR-1(with PAC), SAMBR-2(without PAC) and UASB.
V F A (m g /L ) Phases Others Propionate Acetate 3 2 1 3 2 1 3 2 1 200 100 0 VF A (m g/ L ) Phases Others Propionate Acetate 3 2 1 3 2 1 3 2 1 200 100 0 V FA (mg /L ) Phases Others Propionate Acetate 3 2 1 3 2 1 3 2 1 200 100 0 4.5 3.7
1.3 38.2 36.1 30.2 3.2 0.4 0.61
8.8 16.1 15.4 85.0 118.1 121.2 1.0 1.9 4.0 10.2 18.1 15.8 92.1 120.9 124.5 0.2 1.1 3.3 SAMBR-1 SAMBR-2 UASB
in SAMBR-1 increased 11.0 g from phase 1 to 2; 13.0 g from phase 2 to 3 and 15.0 g during the third phase, whereas the VSS increase for SAMBR-2 in the same phases were respectively 8.0 g, 9.0 g and 8.0 g. For the UASB the VSS increase was roughly half of that observed in SAMBR-1, i.e. 6.0 g, 8.0 g and 7.0 g respectively. This confirms the hypothesis that addition of PAC into SAMBR-1 adsor-bed intermediate VFA and toxic byproducts, thereby providing a more adequate environment for microbial growth which led to higher stability when compared with the other reactors (SAMBR-2 and UASB). The fact that SAMBR-2 (without PAC) exhibited higher
m
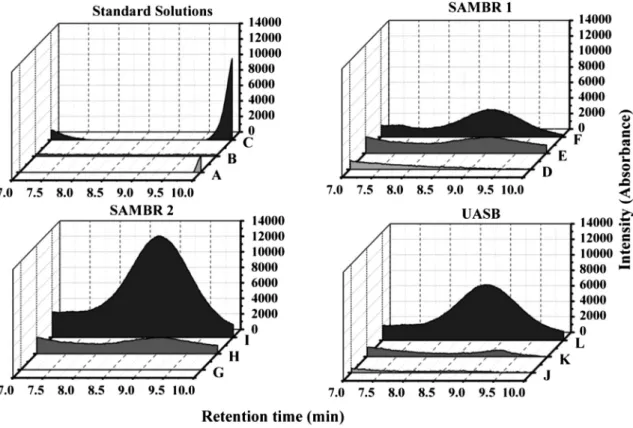
values than UASB can be attributed to higher biomass retention (higher CRT) as well as to higher degradation of colloidal material which would be retained by the membrane and serve as substrate by the anaerobic microorganisms.According to the results presented before, the aromatic amines generated from azo dye degradation were responsible for increasing anaerobic toxicity, mainly in phase 3 and in SAMBR-2 and UASB reactors. In order to evaluate the influence of PAC in the reduction of aromatic amines concentration, chromatographic analyses were carried out as shown inFig. 6.
A chromatographic signal in the retention time of 8.7 min was detected in the samples collected from inside the reactors SAMBR-1 (F), SAMBR-2 (I) and UASB (L) during phase 3 (Fig. 6). The same signal, although less intense, was also detected in the samples collected from these reactors during phase 2 (1 (E), SAMBR-2 (H) and UASB (K)), where it was observed a lower azo dye degradation when compared to phase 3. This signal intensity (peak at 8.7 min) difference is associated with the presence of extract yeast (source of the redox mediator riboflavin) in phase 3, which enhanced the kinetics of azo dye degradation and increased the production of aromatic amines. Since this chromatographic signal (8.7 min) was not detected in the samples from any reactor during phase 1, it is possible to ascertain that the compounds that caused such a peak are not Soluble Microbial Products (SMP) accumulated in the reactor. In addition, such peak was not observed in the chromatograms of the azo dye (A), VFA (B) or inlet feed solution (C). Another argument to strengthen the hypothesis that the chro-matographic signal observed at 8.7 min (191 nm) is an aromatic
amine relates to the comparison of pKa values of VFA and sulfanilic acid (a typical amine formed from sulfonated azo dye degradation) and their respective chromatographic retention times (RT) exper-imentally measured. As presented inFig. 7, the aromatic amines that result from the degradation of Remazol Yellow Gold RNL have a structure similar to that of sulfanilic acid, and thereby should have pKa values close to 3.2 (Agbaba et al., 1996). When using ion ex-change chromatography the separation of analytes occurs in accordance with the speed at which each substance exchange protons (Hþ) with the sulfonated polymer of the column. This process happens in an acid mobile phase, where the analytes are in the protonated form. Therefore, substances with lower pKa values (more acidic) can exchange Hþwith the column more rapidly when compared to molecules with higher pKa values (less acidic). Since formic acid (pKa¼3.75) comes from the column at 13,38 min, it is possible to conclude that the compound eluted at 8.7 min must have a lower pKa value, and this is the case of the sulfanilic acid like aromatic amines.
Another behavior observed inFig. 6was the capacity of PAC in adsorbing the byproducts generated during anaerobic degradation of Remazol Yellow Gold RNL since the intensity of the chromato-graphic signal at 8.7 min was lower in the SAMBR-1 during the phases 2 and 3 when compared to SAMBR-2 and UASB. If one considers the efficiency of azo dye degradation during the opera-tional phases 2 and 3 (Fig. 8), it would be expected a higher accu-mulation of aromatic amines inside SAMBR-1 following the higher color removal efficiencies observed in such system. However, this was not the case, confirming the hypothesis discussed before that PAC retained aromatic amines at its surface and enhanced microbial activity inside SAMBR-1, probably because it contains basic organic groups (e.g. cromene, pyrones) or rich electronic surfaces (e.g graphenic layers) that act as Lewis bases that can electrostatically interact with acidic compounds such as the sulfonated aromatic amines.
Fig. 8shows that the membrane did not have a direct influence on azo dye removal, since there were no statistical differences (p -value>0.05) in the efficiency of decolorization when the reactors SAMBR-2 and UASB are compared during phases 2 and 3. The removal of azo dye in the system was mostly influenced by the presence PAC in the reactor SAMBR-1 and also by the presence of yeast extract in both membrane reactors during phase 3. Indeed, the best behavior in relation to color removal was observed in SAMBR-1 during phase 3, when the decolorization reached a me-dian efficiency of 94.3%.
The positive role of yeast extract can be observed when comparing color removal efficiencies during phases 2 and 3, since an increase in azo dye removal was observed for all the reactors when the redox mediator riboflavin was added in the feed solution. This confirms other studies carried out in our labs which showed the potential of yeast extract in enhancing the kinetics of azo dye degradation in anaerobic systems (Baêta et al., 2012b; Correa et al., 2009). For instance, Baêta et al. (2012b) demonstrated that the presence of 500 mg/L of yeast extract was also able to increase by about 30% the azo dye removal efficiency in an anaerobic UASB treating a synthetic wastewater containing Drimaren blue HFRL (50 mg/L) and operated at ambient temperature (̴25C) and with an HRT of 24 h.
The beneficial role of PAC on color removal can be clearly seen comparing the efficiencies obtained during phase 2, when
SAMBR-1 performed w15% better than SAMBR-2 regarding effluent
decolorization.Table 2shows that PAC exhibited a relatively high adsorption capacity for Remazol Yellow Gold RNL, and based on the Qmaxvalue it is possible to estimate that the PAC added inside the SAMBR-1at the beginning of its operation would be able to retain 123.5 mg of Remazol Yellow Gold RNL if adsorption was the sole
Table 2
Langmuir isotherm parameters for VFA and azo dye adsorption onto PAC.
VFA Qmax(mg/g) KL(L/mg) RL R2
Acetate 5.80 0.0050 0.4999 0.9511
Propionate 0.096 4.05 0.0123 0.7706
Butyrate 5.19 0.0059 0.4567 0.8731
Remazol Yellow Gold RNL 9.469 0.2231 0.0823 0.9650
phases
UASB SAMBR-2
SAMBR-1
3 2 1 3
2 1 3
2 1 0.025
0.020
0.015
0.010
0.005
0.000
0.0102 0.0198
0.0143
0.0085 0.0220
0.0110
0.0072 0.0160
0.0048
Fig. 5.Specific microbial growth rate (m) calculated for SAMBR-1 (with PAC), SAMBR-2
mechanism for dye removal. Considering the azo dye load (7.2 mg/ h) that entered the SAMBR-1 and assuming removal efficiencies in the range of 89e95% (Fig. 8), the theoretical time for PAC saturation
would be 18e20 h. As during the 80 days of operation no new mass
of PAC was added to SAMBR-1, it is clear that the adsorption mechanism cannot solely explain the azo-dye removal in the sys-tem. It is noteworthy that the adsorption experiments were carried out with azo dye solutions prepared in distilled water. Since the anaerobic environment contains low molecular weight compounds (e.g. VFA, SMP) that can also be adsorbed by PAC, the Qmax re-ported here are overestimated, which would imply in a lower amount of azo dye being actually adsorbed in the SAMBR-1. This strengthens the hypothesis that azo dye degradation was the main mechanism of color removal in that system.
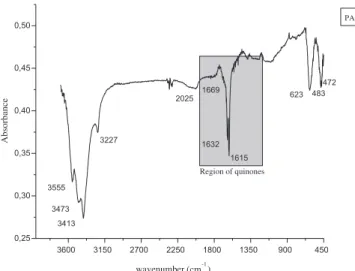
Another hypothesis for a better color removal performance in SAMBR-1 may be associated to the fact that PAC can also act as a source of immobilized redox mediators, and indeed some authors (Mezohegyi et al., 2010; Pereira et al., 2010; van der Zee et al., 2003) have already shown that the presence of quinone groups onto PAC can accelerate the kinetics of anaerobic degradation of azo dyes. In order to confirm the presence of such groups on the surface of the PAC used inside SAMBR-1, infrared (IR) analyses were carried out as
shown in Fig. 9. This figure shows bands at 1669 cm 1 and
1635 cm 1which are characteristic of
nC
¼O stretching in quinones with adjacent carbonyl groups. According to Nakanishi (1962),Fig. 6.Chromatography signal (l¼191 nm) of standard solutions and anaerobic supernatant collected from the anaerobic reactors in all operational phases. Remazol Yellow Gold RNL solution (A); standard VFA solution (B); feed solution (C); SAMBR-1 supernatant at phase 1 (D); SAMBR-1 supernatant at phase 2 (E); SAMBR-1 supernatant at phase 3 (F); SAMBR-2 supernatant at phase 1 (G); SAMBR-2 supernatant at phase 2 (H); SAMBR-2 supernatant at phase 3 (I); UASB supernatant at phase 1 (J) UASB supernatant at phase 2 (K); UASB supernatant at phase 3 (L).
Fig. 7.Chemical structure of Remazol Yellow Gold RNL (A); its possible degradation byproducts (B) e (C); and sulfanilic acid (D).
C
o
lo
r
r
em
o
va
l
ef
fi
ci
en
cy
(%
)
Phases
UASB SAMBR-2
SAMBR-1
3 2 3
2 3
2
94.3
89.6
87.3
77.3
86.3
75.83
quinones with peripheral hydroxyl groups have a strong band at
w1630 cm-1, and a very weak band atw1675 cm-1. Other authors
such asWen-Tien and Ching-Yuan (1995)also stated that some p-quinone show frequency absorbance near 1650 cm-1, while the carbons with C] O at the adjacent positions 1 and 2 show the
absorbance shifted to 1630 cm-1and 1600 cm-1. Therefore, as pre-viously reported in the literature, the vibration bands found at 1669 cm 1and 1632 cm 1refers to the presence of quinone groups on the surface of PAC used in SAMBR-1.
The association of redox mediators (quinone groups) present onto PAC surface with yeast extract (source of riboflavin) led to the highest color removal efficiency in SAMBR-1 in phase 3 and opens up the opportunity for novel technological processes for waste-water effluents from textile industries.
4. Conclusion
The use of microfiltration membranes inside the anaerobic reactor (SAMBR-1 and SAMBR-2) contributed to the increase of CRT and led to a higher organic matter removal in such reactors;
The microfiltration membranes showed to be able to remove soluble COD, mainly CODVFA, probably due to the formation of a biofilm on the membrane surface, thereby contributing to improving the quality of thefinal effluent;
The presence of PAC inside the reactor SAMBR-1 improved the stability of the reactor, resulting in higher removal efficiencies of COD, VFA and azo dye. This probably happened due to the ability of PAC in adsorbing byproducts of azo dye degradation (aromatic amines) as well as intermediate organic acids (VFA) formed during anaerobic degradation of organic matter; The presence of quinone groups that can act as redox mediators
on the surface of the PAC positively contributed with color removal by accelerating the degradation of azo dye Remazol Gold Yellow RNL model. Moreover, the addition of yeast extract enhanced azo dye removal efficiency in all anaerobic reactors tested indicating that such material may in fact be used as a cheap source of the redox mediator riboflavin.
Acknowledgments
The authors would like to acknowledge thefinancial support they received from the following Brazilian institutions: CAPES, CNPq and FAPEMIG.
References
Agbaba, D., Radovic, A., Vladimirov, S., Zivanov-Stakic, D., 1996. Simultaneous TLC determination of co-trimoxazole and impurities of sulfanilamide and sulfanilic acid in pharmaceuticals. J. Chromatogr. Sci. 34, 460e464.
Akram, A., Stuckey, D.C., 2008. Flux and performance improvement in a submerged anaerobic membrane bioreactor (SAMBR) using powdered activated carbon (PAC). Process Biochem. 43, 93e102.
Aquino, S.F., Hu, A.Y., AKram, A., Stuckey, D.C., 2006. Characterization of dissolved compounds in submerged anaerobic membrane bioreactors (SAMBRs). J. Chem. Technol. Biotechnol. 81, 1894e1904.
Aquino, S.F., Chernicharo, C.A.L., 2005. Acúmulo de ácidos graxos voláteis (AGVS) em reatores anaeróbios sob estresse: causa e estratégias de controle. Eng. Sanit Amb 10, 152e161.
Baêta, B.E.L., Ramos, R.L., Lima, D.R.S., Aquino, S.F., 2012a. Use of submerged anaerobic membrane bioreactor (SAMBR) containing powdered activated carbon (PAC) for the treatment of textile effluents. Water Sci. Technol. 65, 1540e1547.
Baêta, B.E.L., Aquino, S.F., Silva, S.Q., Rabelo, C.A., 2012b. Anaerobic degradation of azo dye Drimaren blue HFRL in UASB reactor in the presence of yeast extract a source of carbon and redox mediator. Biodegrad. 23, 199e208.
Cervantes, F.J., Van Der Zee, F.P., Lettinga, G., Field, J.A., 2001. Enhanced decolour-isation of acid orange 7 in a continuous UASB reactor with quinones as redox mediators. Water Sci. Technol. 44, 123e128.
Clescerl, L.S., Greenber g, A.E., Eaton, A.D., 2005. Standardmethods for Examination of Water & Wastewater, twenty-first ed. American Public Health Association. Correa, C.A.R., Aquino, S.F., Caldas, P.C.P., Silva, S.Q., 2009. Uso de extrato de levedura
como fonte de carbono e de mediadores redox para a degradação anaeróbia de corante azo. Eng. Sanit Amb 14, 559e568.
Dereli, R.K., Ersahin, M.E., Ozgun, H., Ozturk, I., Jeison, D., van der Zee, F., Van Lier, J.B., 2012. Potentials of anaerobic membrane bioreactors to overcome treatment limitations induced by industrial wastewaters. Bioresour. Technol. 122, 160e170.
Dos Santos, A.B., Cervantes, F.J., Van Lier, J.B., 2006. Potentials of high-temperature anaerobic treatment and redox mediators for the reductive decolorization of azo dyes from textile wastewaters. Water Sci. Technol. 54, 151e156. Dos Santos, A.B., Traverse, J., Cervantes, F.J., Van Lier, J.B., 2005. Thermophilic
treatment by anaerobic granular sludge as an effective approach to accelerate the electron transfer and improve the reductive decolorization of azo dyes in bioreactors. Water Sci. Technol. 52, 363e369.
Field, J.A., Brady, J., 2003. Riboflavin as a redox mediator accelerating the reduction of the azo dye Mordant yellow 10 by anaerobic granular sludge. Water Sci. Technol. 48, 187e193.
Georgiou, D., Aivasidis, A., 2006. Decoloration of textile wastewater by means of a
fluidized-bed loop reactor and immobilized anaerobic bacteria. J. Hazard. Mater. 135, 372e377.
Hu, A.Y., Stuckey, D.C., 2006. Treatment of dilute wastewaters using a novel sub-merged anaerobic membrane bioreactor. J. Environ. Eng. 132, 190e198. Hunger, K., Gregory, P., Miederer, P., Berneth, H., Heid, C., Mennicke, W., 2004.
Important Chemical Chromophores of Dye Classes,first ed. Wiley-VCH Verlag GmbH & Co. KGaA.
Kalyuzhnyi, S., Sklyar, V., 2000. Biomineralisation of azo dyes and their breakdown products in anaerobic aerobic hybrid and UASB reactors. Water Sci. Technol. 41, 23e30.
Kumar, P., Prasad, B., Mishra, I.M., Chand, S., 2008. Treatment of composite waste-water of a cotton textile mill by thermolysis and coagulation. J. Hazard. Mater. 151, 770e779.
Liao, B-Qiang, Kraemer, J.T., Bagley, D.M., 2006. Anaerobic membrane bioreactors: applications and research directions, critical reviews. Environ. Sci. Technol. 36, 489e530.
Martinez-Sosa, D., Helmereich, B., Horn, H., 2012. Anaerobic submerged membrane bioreactor (AnSMBR) treating low-strength wastewater under psychrophilic temperature conditions. Process Biochem. 47, 792e798.
Méndez-Paz, D., Omil, F., Lema, J.M., 2005. Anaerobic treatment of azo dye acid orange 7 under fed-batch and continuous conditions. Water Res. 39, 771e778. Mesquita, P.L., Aquino, S.F., Xavier, A.L.P., Silva, J.C.C., Afonso, R.J.C.F., Silva, S.Q.S., 2010. Soluble microbial products (SMP) characterization in bench-scale aerobic and anaerobic CSTRs under different operational conditions. Braz. J. Chem. Eng. 27, 101e111.
Mesquita, P.L., Leite, G.S., Afonso, R.J.C., Aquino, S.F., 2012. Validation of a liquid chromatography methodology for the 5 simultaneous analyses of seven volatile fatty acids (VFA) 6 intermediates of anaerobic digestion. Eng. Sanit Amb. in press.
Mezohegyi, G., Goncalves, F., Orfao, J.J.M., Fabregat, A., Fortuny, A., Font, J., Bengoa, C., Stuber, F., 2010. Tailored activated carbons as catalysts in bio-decolourisation of textile azo dyes. Appl. Catal. B 94, 179e185.
Nakanishi, K., 1962. Infrared Absorption SpectroscopyePratical. Holden-Day, Inc., e Nankodo Company Limited, São Franscisco e Tokyo.
Pereira, L., Pereira, R., Pereira, M.F.R., van der Zee, F.P., Cervantes, F.J., Alves, M.M., 2010. Thermal modification of activated carbon surface chemistry improves its capacity as redox mediator for azo dye reduction. J. Hazard. Mater. 183, 931e939.
Pinheiro, H.M., Touraud, E., Thomas, O., 2004. Aromatic amines from azo dye reduction: status review with emphasis on direct UV spectrophotometric detection in textile industry wastewaters. Dyes Pigm. 61, 121e139.
3600 3150 2700 2250 1800 1350 900 450 0,25
0,30 0,35 0,40 0,45 0,50
Absorbance
wavenumber (cm-1)
PAC
3555
3473
3413 3227
2025
1632
1615
623 483 472 1669
Region of quinones
Rau, J., Knackmuss, H.J., Stolz, A., 2002. Effects of different quinoid redox mediators on the anaerobic reduction of azo dyes by bacteria. Environ. Sci. Technol. 36, 1497e1504.
Santos, V.P., Pereira, M.F.R., Faria, P.C.C., Orfao, J.J.M., 2009. Decolourisation of dye solutions by oxidation with H2O2in the presence of modified activated carbons. J. Hazard. Mater. 162, 736e742.
Teixeira, T.P.F., Pereira, S., Aquino, S.F., Dias, A., 2012. Use of calcined layered double hydroxides for decolorization of azo dyes solutions: equilibrium, kinetics and recycling studies. Environ. Eng. Sci. 29, 685e692.
Van Der Zee, F.P., Villaverde, S., 2005. Combined anaerobic-aerobic treatment of azo dyesea short review of bioreactor studies. Water Res. 39, 1425e1440. van der Zee, F.P., Bisschops, I.A.E., Lettinga, G., Field, J.A., 2003. Activated carbon as
an electron acceptor and redox mediator during the anaerobic biotransforma-tion of azo dyes. Environ. Sci. Technol. 37, 402e408.
Weisburger, J.H., 2002. Comments on the history and importance of aromatic and heterocyclic amines in public health. Muta Res. 506e507, 9e20.