HESSD
10, 11861–11900, 2013Multi-decadal river flows variations in
France
J. Boé and F. Habets
Title Page
Abstract Introduction
Conclusions References
Tables Figures
◭ ◮
◭ ◮
Back Close
Full Screen / Esc
Printer-friendly Version Interactive Discussion
Discussion
P
a
per
|
D
iscussion
P
a
per
|
Discussion
P
a
per
|
Discuss
ion
P
a
per
Hydrol. Earth Syst. Sci. Discuss., 10, 11861–11900, 2013 www.hydrol-earth-syst-sci-discuss.net/10/11861/2013/ doi:10.5194/hessd-10-11861-2013
© Author(s) 2013. CC Attribution 3.0 License.
Hydrology and Earth System
Sciences
Open Access
Discussions
This discussion paper is/has been under review for the journal Hydrology and Earth System Sciences (HESS). Please refer to the corresponding final paper in HESS if available.
Multi-decadal river flows variations in
France
J. Boé1and F. Habets2
1
Sciences de l’Univers au CERFACS, URA1875, CNRS/CERFACS, Toulouse, France
2
MINES ParisTech, Geosciences Department, Fontainebleau, UMR7619, CNRS/UPMC, Paris, France
Received: 28 August 2013 – Accepted: 11 September 2013 – Published: 26 September 2013
Correspondence to: J. Boé ([email protected])
HESSD
10, 11861–11900, 2013Multi-decadal river flows variations in
France
J. Boé and F. Habets
Title Page
Abstract Introduction
Conclusions References
Tables Figures
◭ ◮
◭ ◮
Back Close
Full Screen / Esc
Printer-friendly Version Interactive Discussion
Discussion
P
a
per
|
D
iscussion
P
a
per
|
Discussion
P
a
per
|
Discuss
ion
P
a
per
Abstract
In this article, multi-decadal variations in French hydroclimate are investigated, with a specific focus on river flows. Based on long observed series, it is shown that river flows in France generally exhibit large multi-decadal variations on the historical period, espe-cially in spring. Differences of means between two 21 yr periods of the 20th century as
5
large as 40 % are indeed found for many gauging stations. Multi-decadal spring river flows variations are associated with variations in spring precipitation and temperature. These multi-decadal variations in precipitation are themselves found to be driven by large-scale atmospheric circulation, more precisely by a multi-decadal oscillation in a sea level pressure dipole between western Europe and the East Atlantic. It is
sug-10
gested that the Atlantic Multidecadal Variability, the main mode of decadal variability in the North Atlantic/Europe sector, controls those variations in large-scale circulation and is therefore the main ultimate driver of multi-decadal variations in spring river flows. Multi-decadal variations in river flows in other seasons, and in particular summer, are also noted. As they are not associated with significant surface climate anomalies (i.e.
15
temperature, precipitation) in summer, other mechanisms are investigated based on hydrological simulations. The impact of climate variations in spring on summer soil moisture, and the impact of soil moisture in summer on the runoffto precipitation ratio, could potentially play a role in multi-decadal summer river flows variations. The large amplitude of the multi-decadal variations in French river flows suggests that internal
20
variability may play a very important role in the evolution of river flows during the next decades, potentially temporarily limiting, reversing or seriously aggravating the long-term impacts of anthropogenic climate change.
1 Introduction
The role of internal low-frequency variations in the evolution of the climate system has
25
cli-HESSD
10, 11861–11900, 2013Multi-decadal river flows variations in
France
J. Boé and F. Habets
Title Page
Abstract Introduction
Conclusions References
Tables Figures
◭ ◮
◭ ◮
Back Close
Full Screen / Esc
Printer-friendly Version Interactive Discussion
Discussion
P
a
per
|
D
iscussion
P
a
per
|
Discussion
P
a
per
|
Discuss
ion
P
a
per
mate information on the next few decades for planning and adaptation in the context of climate change. Internal low-frequency variations can indeed temporarily either aggra-vate, moderate or even reverse the long-term impact of global warming. Current climate projections suggest that internal low-frequency variability is a major source of uncer-tainties on the coming decades (Hawkins and Sutton, 2009; Deser et al., 2010, 2012).
5
For example, regarding precipitation change over France at the middle of the 21st cen-tury, uncertainties related to internal variability may be as large as uncertainties due to climate models (Terray and Boé, 2013).
The realism of those estimations of the impact of internal variability in future projec-tions depends on the ability of climate models to simulate correctly low-frequency
inter-10
nal modes of variability. Unfortunately, current models generally present some moder-ate deficiencies in capturing the exact spatio-temporal characteristics of the observed low-frequency variations in the North Atlantic ocean, and serious difficulties in cor-rectly capturing the associated hydroclimate impacts over land (Kavvada et al., 2013). This issue regarding hydroclimate variations is especially problematic since because
15
of the multiplicity of the uses of water and the tensions that often already exist between demand and resources, low-frequency fluctuations in continental hydroclimate and in particular river flows may have particularly serious impacts for the society.
Some progresses are therefore to be made towards a better characterization and understanding of the low-frequency internal variations in the climate system, not only
20
in the ocean which plays a central role in their existence, but also how they impact continental hydroclimate. Despite the shortness of the historical record when dealing with multi-decadal variations and despite the fact that observed variations are always the result of both internal and forced components, and therefore do not allow to readily disentangle the contributions of both sources of variability, observational studies remain
25
HESSD
10, 11861–11900, 2013Multi-decadal river flows variations in
France
J. Boé and F. Habets
Title Page
Abstract Introduction
Conclusions References
Tables Figures
◭ ◮
◭ ◮
Back Close
Full Screen / Esc
Printer-friendly Version Interactive Discussion
Discussion
P
a
per
|
D
iscussion
P
a
per
|
Discussion
P
a
per
|
Discuss
ion
P
a
per
The main mode of multi-decadal variability in the North Atlantic-Europe sector is the Atlantic Multidecadal Variability (AMV, also known as Atlantic Multidecadal Oscillation; Kerr, 2000). The AMV is characterized by basin-wide variations in the North Atlantic sea surface temperature at multi-decadal time-scales (60–100 yr on the historical period, e.g. Schlesinger and Ramankutty, 1994; Kerr, 2000). Based on climate simulations,
5
it is generally hypothesized that buoyancy-driven variations of the Atlantic Meridional Overturning Circulation (AMOC) intrinsic to the climate system largely drive the AMV (Delworth and Mann, 2000). However, whether the AMV is mainly an internal mode of variability or is to a large extent forced by external forcing remains somewhat controver-sial. On the one hand, paleoclimate data suggest that AMV-like variability is not limited
10
to the historical period (e.g. Gray et al., 2004). Moreover, preindustrial control coupled climate simulations generally exhibit modes of variability whose spatio-temporal char-acteristics are relatively similar to the observed AMV (e.g. Knight et al., 2005). On the other hand, other studies point toward a potentially important role of climate forcing on observed multi-decadal variations in the North Atlantic on the historical period, as
15
volcanic eruption (Ottera et al., 2010) or aerosols (Booth et al., 2012).
Independently of the driving mechanism(s) which is not the object of our study, cur-rent literature suggests a potential impact of the AMV on continental hydrological cycle over France, as it is the case in the USA (Endfield et al., 2001). At inter-annual time-scales, statistical relationships between drought severity for some French rivers and
20
averaged North Atlantic sea surface temperatures (SST) have been found (Giuntoli et al., 2013). Regarding multi-decadal time-scales, on the historical period, positive phases of the AMV are significantly associated with larger temperature over France in spring and to a lesser extent in summer and with below average spring precipitation (Sutton and Hodson, 2005; Sutton and Dong, 2012). Physically, those changes in the
25
surface climate are expected to lead to decadal river flows anomalies.
HESSD
10, 11861–11900, 2013Multi-decadal river flows variations in
France
J. Boé and F. Habets
Title Page
Abstract Introduction
Conclusions References
Tables Figures
◭ ◮
◭ ◮
Back Close
Full Screen / Esc
Printer-friendly Version Interactive Discussion
Discussion
P
a
per
|
D
iscussion
P
a
per
|
Discussion
P
a
per
|
Discuss
ion
P
a
per
simulations are analyzed in Sect. 5 in the objective to better understand multi-decadal variations in summer flows. Finally, conclusions and perspectives are given in Sect. 6.
2 Data, models, and methods
Daily river flows at 38 gauging stations over France are analyzed in this study. Data have been extracted from the national HYDRO database (http://www.hydro.eaufrance.
5
fr/). Series at all selected gauging stations start before 1940 and cover at least 70 yr (the median length is 90 yr). Gauging stations with too much missing values have been discarded. When less than 3/4 of daily values are available during a given year (sea-son), the corresponding annual (seasonal) mean is considered as missing. At most, 6 % of years are missing for the selected stations with that definition. The missing
10
values as previously defined in the selected series are filled by the corresponding long-term climatological average. The use of this very crude approach is intentional. More sophisticated methods (e.g. temporal interpolation based on neighbor years etc.) might artificially enhance low-frequency variations.
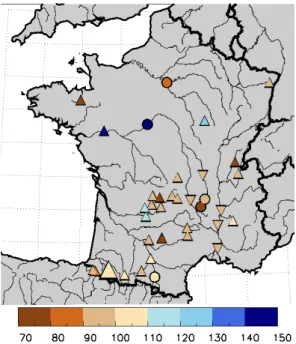
The location of the gauging stations and the length of the corresponding river flows
15
series are shown in Fig. 1. Stations are not uniformly distributed over France, with very few stations in the north while the central France is well covered.
Metadata indicate that river flows at some of the selected gauging stations are di-rectly influenced by man (e.g. dams or water intakes). It has been decided not to dis-card those stationsa priori because they may still provide valuable information, but we
20
flagged them for the interpretation of the results (Fig. 1). Note also that this data-set is not homogenized and therefore stations in the “no or little influence” categories are not necessarily free from other artifacts (e.g. change in measurement). One has therefore to be cautious about the interpretation of variations at any particular station, and the focus of this study is on large-scale patterns of coherent variations. For most of the
25
HESSD
10, 11861–11900, 2013Multi-decadal river flows variations in
France
J. Boé and F. Habets
Title Page
Abstract Introduction
Conclusions References
Tables Figures
◭ ◮
◭ ◮
Back Close
Full Screen / Esc
Printer-friendly Version Interactive Discussion
Discussion
P
a
per
|
D
iscussion
P
a
per
|
Discussion
P
a
per
|
Discuss
ion
P
a
per
For precipitation, a large set of monthly homogenized time series aggregated by department to form 51 time series that sample a large portion of France, from Météo-France, is used (HPS as homogenized precipitation series, Moisselin et al., 2002). HPS data are available from 1900 to 2000. In complement to this data-set that does not cover the beginning of the 21st century, the Global Precipitation Climatology Center
5
data-set (GPCC) is also used (full Data Reanalysis from 1901 to 2011, Rudolph and Schneider, 2005). This data-set is not optimized for variability study and is therefore
a priori less suitable than HPS to study low-frequency fluctuations. Homogenized tem-perature series at different stations over France from Météo-France are also used in this study (Moisselin et al., 2002).
10
Precipitation and sea level pressure have been extracted from the 20th Century Re-analysis (20CR in the following, Compo et al., 2011). This data-set covers the 1871– 2010 period. The only observation assimilated by the 20CR system is sea level pres-sure (SLP). Observed sea surface temperature, sea ice cover, time-varying global mean CO2and volcanic aerosols concentration, and incoming solar radiation are used
15
as forcing of the atmospheric model of the 20CR system. Some caveats are associ-ated with 20CR data. SLP observations are very sparse at the beginning of the period (and well within the 20th century for some areas) and therefore the accuracy of the reanalysis is necessarily more limited then. As only SLP is assimilated, this reanaly-sis cannot in theory have the same level of accuracy as more classical reanalyses for
20
variables that are not strongly controlled by large-scale circulation. On the other hand, temporal inconsistencies associated with changes in instruments (new satellites etc.) are avoided in 20CR. However, the change with time of the number of SLP observa-tions assimilated may still result in artificial temporal variaobserva-tions (Krueger et al., 2013).
The HadSST3 sea surface temperature (SST) data-set (Kennedy et al., 2011a,b)
25
from 1850 to 2012 is used to compute the AMV index. The AMV is defined as the low-pass filtered average of SST in the North Atlantic (in our case, the domain is 0–60◦N,
75–7.5◦W) with the impact of anthropogenic temperature rise removed. A linear trend
HESSD
10, 11861–11900, 2013Multi-decadal river flows variations in
France
J. Boé and F. Habets
Title Page
Abstract Introduction
Conclusions References
Tables Figures
◭ ◮
◭ ◮
Back Close
Full Screen / Esc
Printer-friendly Version Interactive Discussion
Discussion
P
a
per
|
D
iscussion
P
a
per
|
Discussion
P
a
per
|
Discuss
ion
P
a
per
anthropogenic temperature increase in this context. However the trend is not expected to be linear, especially on a long period as the one studied here. The global average of SST is also commonly used as an estimator of the forced temperature rise (e.g. Tren-berth and Shea, 2006). However, as there is very little observations outside the North Atlantic initially, the global average is expected to be biased towards the North Atlantic
5
average at the beginning of the period. This procedure could therefore lead to an un-derestimation of the AMV variations in the early period. Here, the forced component is estimated by regressing the North Atlantic SST average on the observed CO2 con-centration in order to compute and remove a non-linear trend. As the other ones, this method has drawbacks, but it is important to note that results presented in this study
10
are not crucially dependent on the way the anthropogenic temperature rise is removed when computing the AMV index. By definition in the following, by AMV we mean the de-trended and low-pass filtered AMV index.
Results of an hydro-meteorological simulation over France on the 1961–2012 pe-riod are also analyzed in this study. This simulation is based on the
SAFRAN-ISBA-15
MODCOU (SIM) hydro-meteorological coupled system. SIM is described and evalu-ated against observations in Habets et al. (2008). SIM is the combination of three independent systems. SAFRAN (Durand et al., 1993), based on obervations, analyses the seven atmospheric variables at the hourly time step on a 8 km grid necessary to force the soil-vegetation-atmosphere transfer (SVAT) scheme ISBA. Those variables
20
are liquid and solid precipitation, incoming long-wave and short-wave radiation fluxes, 10 m wind speed, 2 m specific humidity and temperature. A description and elements of validation of SAFRAN are given in Quintana Segui et al. (2008) and Vidal et al. (2010). ISBA (Noilhan and Planton, 1989) computes the surface water and energy budgets and then MODCOU (Ledoux et al., 1984) routes the surface runoffsimulated by ISBA
25
in the hydrographic network.
elim-HESSD
10, 11861–11900, 2013Multi-decadal river flows variations in
France
J. Boé and F. Habets
Title Page
Abstract Introduction
Conclusions References
Tables Figures
◭ ◮
◭ ◮
Back Close
Full Screen / Esc
Printer-friendly Version Interactive Discussion
Discussion
P
a
per
|
D
iscussion
P
a
per
|
Discussion
P
a
per
|
Discuss
ion
P
a
per
inated. No padding is applied: the first 9 yr and last 9 yr of the unfiltered series are considered as missing in the filtered series.
To assess the significance of correlations computed from the low-pass filtered series, which exhibit a very high level of serial correlation, the test proposed by Ebisuzaki (1997) and applied in the same context for example by Enfield et al. (2001) is followed.
5
The test is based on a Monte Carlo approach, with a randomization of phases in the frequency domain in order to generate random surrogate series with the same level of serial correlations than the original ones.
Through this paper, winter means December-January-February, spring means March-April-May, summer means June-July-August and autumn means
September-10
October-November.
3 Multi-decadal variability in observed French hydro-climate
Simple visual inspection reveals important multi-decadal fluctuations in river flows for many of the gauging stations examined in this study, especially in spring. As an ex-ample, Fig. 2a shows that the Gave d’Ossau, a small river in south-western France
15
(see Fig. 1), exhibits large decadal variations in spring and annual river flows, clearly discernible even in unfiltred series. Decadal minimums in the 1950s and 2000s con-trast with maximums in the 1920s and 1970s. Spectral analysis confirms that the Gave d’Ossau exhibits strong multi-decadal variations, significant for periods roughly greater than 30 yr (Fig. 2b).
20
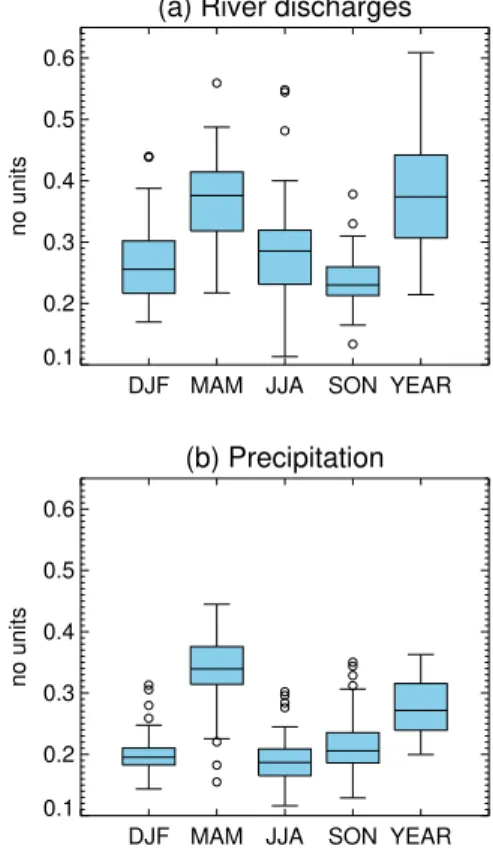
To quantify the importance of multi-decadal variations in river flows in France, the ratio of the standard deviation of low-pass filtered series to the standard deviation of unfiltered series is shown for the seasonal and annual averages (Fig. 3a). Seasonally, the importance of multi-decadal variations relatively to the total variability is generally much greater in spring. Large decadal variations are also seen in the annual series.
25
HESSD
10, 11861–11900, 2013Multi-decadal river flows variations in
France
J. Boé and F. Habets
Title Page
Abstract Introduction
Conclusions References
Tables Figures
◭ ◮
◭ ◮
Back Close
Full Screen / Esc
Printer-friendly Version Interactive Discussion
Discussion
P
a
per
|
D
iscussion
P
a
per
|
Discussion
P
a
per
|
Discuss
ion
P
a
per
than for yearly averages, in absolute term, the multi-decadal signal is much larger in spring than in annual means (1.8 times larger in average over France, not shown).
A straightforward hypothesis to explain the multi-decadal variations in river flows is that they are driven by precipitation fluctuations. Figure 3b shows that spring precipi-tation over France indeed also exhibits large multi-decadal fluctuations. Multi-decadal
5
variations for the other seasons are much weaker. Interestingly, the magnitude of multi-decadal variations in river flows is generally greater than in precipitation.
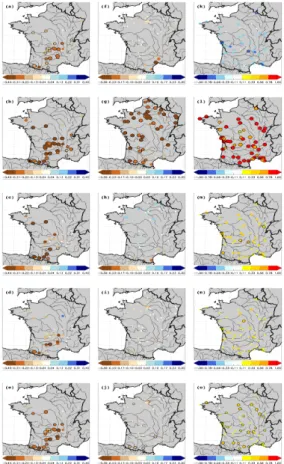
To assess whether the local multi-decadal fluctations of the Gave d’Ossau shown in Fig. 2a are part of a coherent larger scale signal, the relative differences in detrended river flows between the 1938–1958 and 1965–1985 periods, that roughly correspond
10
respectively to decadal minimum and maximum for the Gave d’Ossau, are shown in Fig. 4. The largest multi-decadal differences in river flows are generally seen in spring, with a signal shared by virtually all gauging stations over France. Differences in 21 yr average as large as or even greater than 40 % are seen in spring between the two periods. Many stations also exhibit important decadal differences in summer
(espe-15
cially over western France) and winter, while the signal is generally weaker in autumn, except for few stations. At the annual level, differences as large as 30 % and greater than 25 % are noted for most stations in western and central France. Corresponding precipitation and temperature anomalies between the two periods are also depicted in Fig. 4. The smaller spring river flows in 1938–1958 compared to the 1965–1985
20
period are associated with strong negative precipitation anomalies over France (up to
−30 %) and warmer temperature (up to 1 K). No significant differences in temperature
nor precipitation are generally observed for the other seasons.
Multi-decadal fluctuations in river flows noted for the Gave d’Ossau in Fig. 2a in spring are therefore part of large scale hydroclimate perturbations over France and are
25
HESSD
10, 11861–11900, 2013Multi-decadal river flows variations in
France
J. Boé and F. Habets
Title Page
Abstract Introduction
Conclusions References
Tables Figures
◭ ◮
◭ ◮
Back Close
Full Screen / Esc
Printer-friendly Version Interactive Discussion
Discussion
P
a
per
|
D
iscussion
P
a
per
|
Discussion
P
a
per
|
Discuss
ion
P
a
per
this line of reasoning and supposing that this relation is still valid at multi-decadal time-scales, larger temperatures in 1938–1958 would therefore be consistent with larger evapotranspiration, which would also result in smaller river flows. While multi-decadal variations in spring river flows could be explained by surface climate anomalies, the decadal differences in river flows observed in the other seasons are more puzzling
5
as they are not associated with significant specific climate anomalies and in particular precipitation anomalies.
The multi-decadal changes in mean river flows noted previously are also associated with modifications of the statistical distribution of river flows, which could have impor-tant practical impacts. Indeed, for most of the stations examined here, the 1938–1958
10
period compared to the 1965–1985 period is associated with an important increase in the occurrence of moderately low daily river flows and decrease in the occurrence of moderately intense daily river flows (often equal or greater than 50 %, Fig. 5).
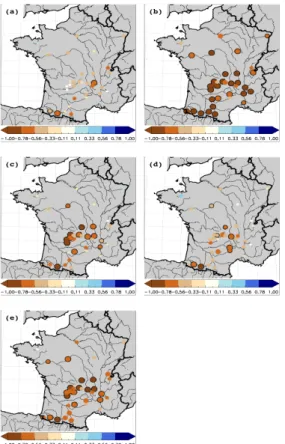
To assess whether multi-decadal variations in spring precipitation and river flows are in phase on the entire available periods, the correlations between low-pass filtered
15
spring precipitation averaged over France and low-pass filtered spring river flows at each gauging stations are computed (Fig. 6a). Very high significant correlations are obtained for the great majority of the gauging stations. Note that the average of pre-cipitation over France is used here because of the lack of prepre-cipitation data specific to each river basins on the whole period of interest. As shown in Fig. 6b, the multi-decadal
20
variations in spring precipitation over France are very spatially coherent. Precipitation at each point is indeed highly correlated with spatially-averaged precipitation, except in south-eastern France. Because of the orography, precipitation there are known to be often associated with particular synoptic conditions compared to the rest of France. Overall, this analysis shows that in spring it is justified to focus on spatially-averaged
25
HESSD
10, 11861–11900, 2013Multi-decadal river flows variations in
France
J. Boé and F. Habets
Title Page
Abstract Introduction
Conclusions References
Tables Figures
◭ ◮
◭ ◮
Back Close
Full Screen / Esc
Printer-friendly Version Interactive Discussion
Discussion
P
a
per
|
D
iscussion
P
a
per
|
Discussion
P
a
per
|
Discuss
ion
P
a
per
4 Mechanisms of spring hydroclimate variations
Based on the previous analyses and considering the straightforward physical link be-tween precipitation and river flows, it appears highly likely that multi-decadal fluctua-tions in spring river flows are driven to a large extent by large-scale precipitation varia-tions over France. Assessing the robustness of the multi-decadal signal seen in spring
5
precipitation and understanding its physical causes are therefore crucial.
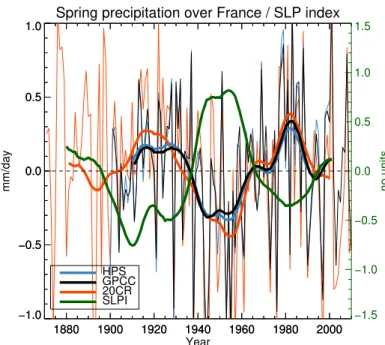
Averaged precipitation over France in spring from three data-sets (GPCC, HPS and 20CR) are depicted in Fig. 7. Very similar multi-decadal signals are visible for all three data-sets. GPCC and HPS data are not independent, as some stations used in GPCC are also used in HPS. However, the statistical treatment of raw data for the two
data-10
sets is largely different. HPS is a priori more adapted to the study of low-frequency variations because of the homogenization procedure applied. The extremely small dif-ferences seen between multi-decadal precipitation variations in GPCC and HPS show the robustness of those features to the statistical pre-treatment of precipitation data and to the exact number and location of stations. Moreover, it shows that even if it is
15
not homogenized, GPCC data can be used in the following analyses to estimate av-eraged precipitation over France, as it has the advantage to be available on a longer period compared to HPS.
Spring precipitation over France in 20CR exhibits a temporal pattern that is very similar to the one seen in HPS and GPCC, even if some limited differences exist,
espe-20
cially at the beginning of the record. This consistency with direct observations (GPCC, HPS) is noteworthy as 20CR provides an indirect and totally independent estimation of precipitation. Indeed, no observed precipitation is used in 20CR. Note that SLP obser-vations, the only variable assimilated in 20CR, are much sparser in the early period of the reanalysis, which has an impact on the quality of 20CR data then (Compo et al.,
25
HESSD
10, 11861–11900, 2013Multi-decadal river flows variations in
France
J. Boé and F. Habets
Title Page
Abstract Introduction
Conclusions References
Tables Figures
◭ ◮
◭ ◮
Back Close
Full Screen / Esc
Printer-friendly Version Interactive Discussion
Discussion
P
a
per
|
D
iscussion
P
a
per
|
Discussion
P
a
per
|
Discuss
ion
P
a
per
variations in spring precipitation are well captured by 20CR also suggests that they may be largely driven by SLP.
The previous analysis shows that the large multi-decadal variations seen in spring precipitation over the 20th century are a robust feature of French climate. Indirectly, it also reinforces the confidence in the general robustness of multi-decadal variations
5
seen in river flows.
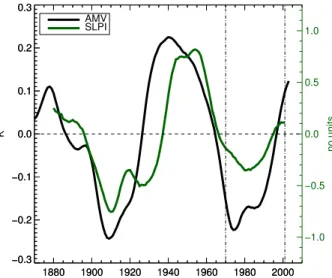
The multi-decadal variations in spring precipitation noted here are consistent with the results of Sutton and Dong (2012). Those authors also suggest that there is a link between the AMV and spring precipitation variations. In spring, the positive phase of the AMV is associated with an anomalous ridge over western and central Europe,
10
between two anomalous negative SLP anomalies over the East Atlantic and north-eastern Europe (Sutton and Dong, 2012). This circulation pattern is expected to be associated with an increase in southerly flows over France, with an advection of warmer and drier air, and therefore with negative precipitation anomalies over France. Sutton and Dong (2012) define a SLP index to capture this potential impact of the AMV on
15
atmospheric circulation on the North Atlantic/Europe sector in spring. A similar SLP index (SLPI) is used in our study.
As shown in Fig. 7, there is a very good anti-correlation between low-pass filtered SLPI and precipitation anomalies over France in spring. High and significant anti-correlations with precipitation series between−0.86 and−0.94 depending on the
pre-20
cipitation data-set (and therefore on the exact period) are noted. A positive value of SLPI corresponds to positive SLP anomalies over central/western Europe and nega-tive anomalies over the East Atlantic and is associated, as physically expected, with negative precipitation anomalies over France. This result is a strong evidence that the multi-decadal variations in spring precipitation over France and therefore in river flows
25
are driven by large-scale circulation.
HESSD
10, 11861–11900, 2013Multi-decadal river flows variations in
France
J. Boé and F. Habets
Title Page
Abstract Introduction
Conclusions References
Tables Figures
◭ ◮
◭ ◮
Back Close
Full Screen / Esc
Printer-friendly Version Interactive Discussion
Discussion
P
a
per
|
D
iscussion
P
a
per
|
Discussion
P
a
per
|
Discuss
ion
P
a
per
exactly in phase. The AMV tends to lead SLPI. It is confirmed by Fig. 9a. Maximum correlations between the AMV and SLPI are found when the AMV leads SLPI by 5 or 6 yr. As expected a similar lag-relationship with the AMV is found for spring precipitation (Fig. 8b). It can be seen in Fig. 8 that the lag tends to vary on the period as it seems to be generally larger at the beginning of the 20th century. Obviously, one must keep
5
in mind that when dealing with multi-decadal variations, 130 yr is a very short period to estimate robustly a potential small lag between two low-pass filtered series. One must therefore remain cautious about the interpretation of this lag between AMV and SLPI or its variation. In any case, this lag remains consistent with the idea that the AMV drives SLPI variations (rather than the opposite). From a physical point of view, it is possible
10
that the lag noted is due to the evolution of the exact spatial pattern of SST anomalies in the North Atlantic during the phase of the AMV, and to the sensitivity of SLP to the precise SST pattern. Further work, based for example on dedicated numerical exper-iments with an atmospheric model forced by different SST patterns would be needed to demonstrate unambiguously that the AMV is the driver of SLPI multi-decadal
fluctu-15
ations and to better understand the physical mechanisms responsible for the potential lag.
Given the well-understood link between precipitation and river flows (Fig. 6a) and as multi-decadal precipitation variations are driven by SLPI, multi-decadal variations in SLPI generally explain a large part of multi-decadal variations in spring river flows
20
(Fig. 10b). Large anti-correlations with the annual mean are also generally noted. Some significant correlations are also seen between SLPI (in spring) and river flows in summer or even in autumn. They are not straightforward to explain. Obviously, no direct causal relationship between atmospheric circulation in spring and river flows in summer is possible. The link between SLPI and summer flows might just be
coinciden-25
HESSD
10, 11861–11900, 2013Multi-decadal river flows variations in
France
J. Boé and F. Habets
Title Page
Abstract Introduction
Conclusions References
Tables Figures
◭ ◮
◭ ◮
Back Close
Full Screen / Esc
Printer-friendly Version Interactive Discussion
Discussion
P
a
per
|
D
iscussion
P
a
per
|
Discussion
P
a
per
|
Discuss
ion
P
a
per
5 Summer variations: hydro-meteorological simulations
The analyses described in the previous sections allow to understand the multi-decadal variations seen in spring river flows and to a certain extent in annual means. However, no explanation for multi-decadal variations in other seasons has emerged. Figure 4 shows that multi-decadal fluctuations, although less important than in spring (Fig. 3a),
5
also exist for many gauging stations in summer for example. Those variations are puz-zling as they are not directly associated with significant climate (i.e. precipitation and temperature) variations. In particular, except in south-eastern France, decades with below normal river flows are characterized by non-significant and moreover generally larger precipitation in summer (Fig. 4). If those variations are not directly caused by
10
climate anomalies, they might be related to hydrological processes.
Negative precipitation anomalies associated with positive SLPI in spring are ex-pected to lead to drier soils. Moreover, as explained previously, a modulation of spring evapotranspiration could also be envisaged given the decadal temperature variations noted in Fig. 4. Positive SLPI anomalies would be associated with increased
evap-15
otranspiration in spring and therefore a decrease in soil moisture. The negative soil moisture anomalies associated with the variations in precipitation and evapotranspira-tion in spring might then persist until summer, and in turn impact river flows. Indeed, over drier soils, a smaller fraction of precipitation results in runoffand more water is stored in the soil or is lost as evapotranspiration in the end. An impact of spring
precip-20
itation and evapotranspiration on summer flows through a modulation of aquifer levels could also theoretically be possible. However, deep aquifers are not expected to play an important role on river flows for many of the stations analyzed here (BRGM, 2006). In this section, we focus on the possible bridge between spring climate variations and summer flows through a modulation of soil moisture. To study those mechanisms,
25
HESSD
10, 11861–11900, 2013Multi-decadal river flows variations in
France
J. Boé and F. Habets
Title Page
Abstract Introduction
Conclusions References
Tables Figures
◭ ◮
◭ ◮
Back Close
Full Screen / Esc
Printer-friendly Version Interactive Discussion
Discussion
P
a
per
|
D
iscussion
P
a
per
|
Discussion
P
a
per
|
Discuss
ion
P
a
per
not exist, and therefore one has to use hydrological modelling in that context. Here, the SIM system described in Sect. 2 is used.
The availability of the meteorological forcing limits the SIM hydrological simulation over France to the 1961–2012 period (and therefore limits the analyses to 1970–2003 when low-pass filtered series are involved). This is obviously a very short period to
5
study low-frequency variability. On such a short period it is difficult to disentangle the impact of internal multi-decadal variations from the one of potential long-term trend associated with increase in greenhouse gases (GHG) concentration. Also, for such a short sample of time, it is difficult to reach significance levels for statistical tests involving low-pass filtered series. The objective of this section therefore remains
mod-10
est: we want to evaluate the general plausibility of the mechanism previously described rather than demonstrate unambiguously its role. Note that as shown in Fig. 8, the pe-riod 1961–2012 mostly corresponds to a negative phase of the AMV, starting in the 1960s and ending in the 1990s. On this period, SLPI follows a very similar temporal pattern.
15
First, spring, summer and annual simulated river flows by SIM are compared to observations, at the interannual level (1961–2012 period) and after low-pass filtering (1970–2003 period), to assess the ability of SIM to capture observed river flows vari-ations (Fig. 11). For the vast majority of the stvari-ations studied here, the model captures the interannual variability in river flows well. Correlations lower than 0.70 are seldom
20
found. Regarding low-frequency variations, the model also performs well, except at a few stations, especially in summer. It is not clear whether deficiencies in the hydro-logical model, direct anthropogenic influences on river flows or some measurement issues, explain those poor correlations. Note that as SIM does not take into account direct human influence on river flows (dams, pumping etc.) the fact that simulated river
25
HESSD
10, 11861–11900, 2013Multi-decadal river flows variations in
France
J. Boé and F. Habets
Title Page
Abstract Introduction
Conclusions References
Tables Figures
◭ ◮
◭ ◮
Back Close
Full Screen / Esc
Printer-friendly Version Interactive Discussion
Discussion
P
a
per
|
D
iscussion
P
a
per
|
Discussion
P
a
per
|
Discuss
ion
P
a
per
analysis suggests that the evolution of the other components of the continental water cycle are very likely also well simulated by SIM for most of the stations.
The central element of the hypothesis tested in this section is that soil moisture at the end of spring can impact river flows in summer through a modification of the part of precipitation that contributes to runoff. Figure 12a shows the link between the soil
5
wetness index (SWI, the difference between the volumetric water content of the soil column and the wilting point divided by the difference between the field capacity and the wilting point) at the end of spring and the runoffto precipitation ratio simulated by SIM in summer for all the stations examined in this section, at the interannual and multi-decadal time-scales. A clear non linear relation exists. Dry soils in spring are associated
10
with very small runoff to precipitation ratio in summer, while for SWI at the end of spring close to one, most of precipitation is transformed into runoff. To confirm the link between the SWI at the end of spring and the runoffto precipitation ratio in summer for each individual stations, the rank correlations at the interannual level between those two quantities are shown in Fig. 12b. The impact of detrending is very limited, pointing
15
towards the robustness of the relationship at the interannual level.
Now that it is clear that the basic mechanism is effective at the interannual level, multi-decadal variations in soil moisture at the end of spring are investigated. First, the link between SLPI and spring evapotranspiration and soil moisture at the end of spring are studied. As the objective here is to study the relationships between variables at
20
multi-decadal time-scales, it is necessary to remove the potential effect of long-term anthropogenic climate change as done previously by detrending the data for the long observed series studied. However, as the trends in simulated variables are estimated on a short period, they may not only capture the effect of long-term anthropogenic cli-mate change but also the potential impact of internal multi-decadal variations that we
25
com-HESSD
10, 11861–11900, 2013Multi-decadal river flows variations in
France
J. Boé and F. Habets
Title Page
Abstract Introduction
Conclusions References
Tables Figures
◭ ◮
◭ ◮
Back Close
Full Screen / Esc
Printer-friendly Version Interactive Discussion
Discussion
P
a
per
|
D
iscussion
P
a
per
|
Discussion
P
a
per
|
Discuss
ion
P
a
per
mon trends. As none of the approach is perfectly appropriate, in the following, both detrended and non detrended simulated hydrological variables are examined in order to assess the impact of this methodological issue.
As previously hypothesized, positive SLPI is generally associated with larger evapo-transpiration in spring. Because of smaller precipitation and higher evapoevapo-transpiration,
5
lower level of soil moisture at the end of the spring are therefore also associated with positive SLPI (Fig. 13). Although detrending simulated data does have an impact and results in smaller absolute correlation, especially for soil moisture, the general picture remains the same. It is also verified that there is a strong relationship between evapo-transpiration in spring and soil moisture at the end of the spring (Fig. 14). This is true
10
whether the variables are detrended or not before computing the correlations.
It is now tested whether soil moisture at the end of spring may have a non negligible impact on summer flows at the multidecadal time-scale. Large positive correlations are seen for most stations between low-pass filtered SWI at the end of spring and river flows in summer (Fig. 14). However, detrending the data has a large impact on the
15
analysis for most of the stations in the Massif Central, while other stations maintain high correlations even after detrending. It is the case for the two stations of the Loire (the two northern stations in western France) and in south-western France. Those are also stations where large decadal variations in summer flows are observed (Fig. 4).
The results described in this section suggest that the AMV, through a modulation
20
of SLPI, may also affect evapotranspiration over France in spring. Increased evapo-transpiration and decreased precipitation lead to soil moisture depletion. Negative soil-moisture anomalies in spring lead to drier soils in summer with a potential influence on river flows in summer. This is a physically plausible mechanism, consistent with the decadal variations simulated at several stations in France in summer. For other
sta-25
tions, the fact that the link between the SWI at the end of spring and summer flows is very dependent on the presence or not of trends does not allow to conclude.
cen-HESSD
10, 11861–11900, 2013Multi-decadal river flows variations in
France
J. Boé and F. Habets
Title Page
Abstract Introduction
Conclusions References
Tables Figures
◭ ◮
◭ ◮
Back Close
Full Screen / Esc
Printer-friendly Version Interactive Discussion
Discussion
P
a
per
|
D
iscussion
P
a
per
|
Discussion
P
a
per
|
Discuss
ion
P
a
per
tury over some regions (Douville et al., 2012). GHG could be associated with positive evapotranspiration trends in spring, while dimming over Europe due to anthropogenic aerosols from the 1950s to the 1980s and then brightening (Wild, 2012), which is basi-cally our period of interest in this section, could result in decadal fluctuations in evap-otranspiration that would be somewhat in phase with SLPI and the AMV. The results
5
described in this section should therefore be taken with great caution. Longer hydrolog-ical simulations on the entire 20th century would help to reach stronger conclusions. It would allow to better separate multi-decadal variations from anthropogenic trends and not to only rely on a short period potentially affected by external forcing at decadal time-scales.
10
6 Conclusions
Multi-decadal variability in river flows over France on the historical period has been investigated. Strong multi-decadal variations in observed river flows have been noted. Those variations are generally clearly more important in spring, and have been shown to be associated with multi-decadal variations in precipitation themselves driven by
15
large-scale circulation. Those multi-decadal variations in large scale circulation can likely be interpreted as an atmospheric response to the SST anomalies associated with the AMV.
Considering those results in the context of current literature, it is somewhat sur-prising that such strong multi-decadal hydroclimatic variations over France, and
es-20
pecially regarding river flows, have received little attention so far. The amplitude of multi-decadal variations is very season-dependent, and often much larger in spring, especially for precipitation and temperature. Studies have often focused preferentially on winter and summer, with a major exception being Sutton and Dong (2012) who already described such multi-decadal variations in precipitation and temperature over
25
de-HESSD
10, 11861–11900, 2013Multi-decadal river flows variations in
France
J. Boé and F. Habets
Title Page
Abstract Introduction
Conclusions References
Tables Figures
◭ ◮
◭ ◮
Back Close
Full Screen / Esc
Printer-friendly Version Interactive Discussion
Discussion
P
a
per
|
D
iscussion
P
a
per
|
Discussion
P
a
per
|
Discuss
ion
P
a
per
scribed before to the best of our knowledge. The links at the inter-annual time scale between what is called in those studies the AMO (but what is probably best called the North Atlantic SST (NASST) index as those studies don’t deal with multi-decadal variations) and river flows in France have been studied by Oubeidillah et al. (2012) and Giuntoli et al. (2013). Oubeidillah et al. (2012) report no significant relationships
5
between NASST and river flows in the Adour-Garonne basin, except for few gaug-ing stations. Giuntoli et al. (2013) show significant relationships between hydrological drought severity at some gauging stations and the NASST index over France, but with a distinct north-south pattern (positive correlation in the north, negative in the south). Those results are however not contradictory with the results presented here, that
sug-10
gest a major contribution of the AMV in the multi-decadal variations of French river flows, because these studies deal with interannual variability rather than multi-decadal variability, on a shorter period, and do not focus on the same seasons and/or aspect of river flows.
Although less important and less widespread than in spring, noticeable multi-decadal
15
variations have also been noted in summer and winter for many stations. It has been suggested that the summer variations could be associated with climate variations in spring through soil moisture memory: smaller precipitation and larger evapotranspira-tion in spring would result in drier soils in summer which would then lead to smaller river flows in summer. Those results are however based on an hydrological simulation,
20
short in the context of multi-decadal variability, and are therefore subject to caution. Note also that locally, a modulation of snowmelt and/or of the solid to liquid precipita-tion ratio by the AMV could potentially exist and impact flows of nival rivers. Although such processes are taken into account in the hydrological modeling, this mechanism has not been investigated in our study.
25
HESSD
10, 11861–11900, 2013Multi-decadal river flows variations in
France
J. Boé and F. Habets
Title Page
Abstract Introduction
Conclusions References
Tables Figures
◭ ◮
◭ ◮
Back Close
Full Screen / Esc
Printer-friendly Version Interactive Discussion
Discussion
P
a
per
|
D
iscussion
P
a
per
|
Discussion
P
a
per
|
Discuss
ion
P
a
per
stations in this study as the impact of deep aquifers on flows is very small for many sta-tions investigated here. The variasta-tions noted in winter therefore remain to be explained. Some important caveats apply to our study. River flows data used are not homoge-nized and we choose to use all available stations with long series to have the largest possible data-set, even if some of them are known to be influenced by direct
anthro-5
pogenic effects, as those influences do not necessarily affect their decadal variations. The large-scale and very consistent signal that appears over France, especially in spring, suggests that those multi-decadal river flows variations are generally robust. If direct anthropogenic influences or measurement artifacts can locally artificially gen-erate low-frequency variations in river flows, it is indeed highly unlikely for those
arti-10
ficial influences to be in phase over entire France. Moreover, it has been shown that multi-decadal variations in spring river flows are strongly associated with multi-decadal variations in precipitation (and temperature). High confidence can be attached to the existence of such multi-decadal variations in precipitation. They are very consistently seen in homogenized and unhomogenized precipitation data, and independently in
15
precipitation from the 20CR reanalysis that does not assimilate precipitation observa-tions. The consistency between simulated and observed river flows during the period for which the hydrological simulation exists is also an element that gives confidence in the reality of the variations seen in river flows on this period, as direct anthropogenic effects are not included in the model.
20
Long hydrological simulations on the whole 20th and early 21st centuries would be really useful for the same reason. Such simulations would also help to better charac-terize the multi-decadal variations in other components of the continental hydrological cycle (soil moisture, evapotranspiration) and would be very useful to better understand the mechanisms at the origin of the decadal variations, especially in summer and
win-25
ter. Efforts to reconstruct the meteorological forcing on a long period to do such hydro-logical simulation are necessary in that context.
HESSD
10, 11861–11900, 2013Multi-decadal river flows variations in
France
J. Boé and F. Habets
Title Page
Abstract Introduction
Conclusions References
Tables Figures
◭ ◮
◭ ◮
Back Close
Full Screen / Esc
Printer-friendly Version Interactive Discussion
Discussion
P
a
per
|
D
iscussion
P
a
per
|
Discussion
P
a
per
|
Discuss
ion
P
a
per
sampling, trend analyses often have to rely on relatively short time periods. Strong multi-decadal variations can seriously impact such short-term trends as noted by Han-naford et al. (2013) and Giuntoli et al. (2013), and one has therefore to remain careful when trying to attribute short-term trends.
From a more applied perspective, it is clear that large multi-decadal variations in river
5
flows may also have some practical implications, for example regarding hydropower production.
To fully grasp the importance of those multi-decadal variations in river flows, it is interesting to put them into the climate change context. Boé et al. (2009) and Chau-veau et al. (2013) give an estimate of the multi-model climate change signal projected
10
in French river flows from an ensemble of CMIP3 models. At the middle of the 21st century (2046–2065 average), the ensemble mean change (which is generally seen as the “best estimate” of the climate change signal) over France is generally of the order of−15 to−30 % in spring, and−25 to−35 % for yearly average. Figure 4 in this study therefore suggests that decadal differences might be as large or even greater
15
than the climate change signal in the middle of the 21st century in spring, and often not far from what is simulated at the annual level in the climate change context. If one supposes that historical multi-decadal variations have mainly an internal origin, internal low-frequency variability is therefore expected to be a very important actor in shaping the future evolution of river flows in France during the coming decades. It could
poten-20
tially temporarily reverse the long-term effect of global warming or strongly enhance the climate change signal, depending of its phasing. Note that as said in the introduction, a debate currently exists about the nature of the AMV. If the AMV is not mainly a natural mode of variability there is no reason to expect it to continue in the future climate in the absence of adequate external forcing. The mainstream view is still that the AMV is
25
largely an internal mode of variability.
HESSD
10, 11861–11900, 2013Multi-decadal river flows variations in
France
J. Boé and F. Habets
Title Page
Abstract Introduction
Conclusions References
Tables Figures
◭ ◮
◭ ◮
Back Close
Full Screen / Esc
Printer-friendly Version Interactive Discussion
Discussion
P
a
per
|
D
iscussion
P
a
per
|
Discussion
P
a
per
|
Discuss
ion
P
a
per
in the perturbed climate as on the historical period (the amplitude of low-frequency vari-ations is not necessarily independent of the mean climate state, and additionally, 150 yr at most is a very short period to estimate robustly the amplitude of multi-decadal vari-ations) one has to rely on multiple members of climate projections to estimate those uncertainties. Whether climate models are able or not to capture realistically the
mag-5
nitude of low-frequency variations in the continental hydroclimate (or in the climate variables necessary to statistically or dynamically downscale climate models to force hydrological models) remains to be demonstrated and will be the object of future work. Finally, because the multi-decadal variations in French river flows are likely due to internal climate variability, and especially since they are related to the AMV, one could
10
hope to try to predict those variations thanks to decadal climate predictions (Goddard et al., 2013). However, the skill of current decadal predictions regarding continental variables such as precipitation and temperature is generally limited even for small lead times, but more work is needed to better characterize the potential decadal predictabil-ity for river flows.
15
Acknowledgements. This work was supported by the French National Research Agency (ANR) in the framework of its JCJC program (ECHO, decision no ANR 2011 JS56 014 01). The authors thank Laurent Terray, Christophe Cassou and Yohan Ruprich-Robert for useful discussions about this work. The authors also acknowledge Météo France (Direction de la climatologie) for providing the homogenized precipitation and temperature data-sets
20
and Eric Martin for providing the SAFRAN-ISA-MODCOU data. Support for the Twentieth
Century Reanalysis Project dataset is provided by the US Department of Energy, Office of
Science Innovative and Novel Computational Impact on Theory and Experiment (DOE INCITE)
program, and Office of Biological and Environmental Research (BER), and by the National
Oceanic and Atmospheric Administration Climate Program Office. Finally, the authors are
25
grateful to Benjamin Graff (Compagnie Nationale du Rhône), Pierre Boulestreau (Société
Hydro-Electrique du Midi) and Hugues Haeffner (GDF SUEZ) for the initial scientific question
HESSD
10, 11861–11900, 2013Multi-decadal river flows variations in
France
J. Boé and F. Habets
Title Page
Abstract Introduction
Conclusions References
Tables Figures
◭ ◮
◭ ◮
Back Close
Full Screen / Esc
Printer-friendly Version Interactive Discussion
Discussion
P
a
per
|
D
iscussion
P
a
per
|
Discussion
P
a
per
|
Discuss
ion
P
a
per
The publication of this article is financed by CNRS-INSU.
References
Boé, J., Terray, L., Martin, E., and Habets, F.: Projected changes in components of the hydro-logical cycle in French river basins during the 21st century, Water Resour. Res., 45, W08426,
5
doi:10.1029/2008WR007437, 2009.
Booth, B. B. B., Dunstone, N. J., Halloran, P. R., Andrews, T., and Bellouin, N.: Aerosols im-plicated as a prime driver of twentieth-century North Atlantic climate variability, Nature, 484, 228–232, 2012.
BRGM: Aquifères et eaux souterraines de France, édition BRGM, ref: STC003, Orléans,
10
France, 2006.
Chauveau, M., Chazot, S., Perrin, C., Bourgin, P.-Y., Sauquet, E., Vidal, J.-P., Rouchy, N., Mar-tin, E., David, J., Norotte, T., Maugis, P., and de Lacaze, X.: Quels impacts des changements climatiques sur les eaux de surface en France à l’horizon 2070?, La Houille Blanche, in press.
15
Compo, G. P., Whitaker, J. S., Sardeshmukh, P. D., Matsui, N., Allan, R. J., Yin, X., Gleason, B. E., Vose, R. S., Rutledge, G., Bessemoulin, P., Brönnimann, S., Brunet, M., Crouthamel, R. I., Grant, A. N., Groisman, P. Y., Jones, P. D., Kruk, M., Kruger, A. C., Marshall, G. J., Maugeri, M., Mok, H. Y., Nordli, Ø., Ross, T. F., Trigo, R. M., Wang, X. L., Woodruff, S. D., and Worley, S. J.: The twentieth century reanalysis project, Q. J. Roy. Meteor. Soc., 137,
20
1–28, 2011.
Delworth, T. L. and Mann, M. E.: Observed and simulated multi-decadal variability in the North-ern Hemisphere, Clim. Dynam., 16, 661–676, 2000.
Deser, C., Phillips, A. S., Bourdette, V., and Teng, H.: Uncertainty in climate change projections: the role of internal variability, Clim. Dynam., 38, 527–546, 2010.
HESSD
10, 11861–11900, 2013Multi-decadal river flows variations in
France
J. Boé and F. Habets
Title Page
Abstract Introduction
Conclusions References
Tables Figures
◭ ◮
◭ ◮
Back Close
Full Screen / Esc
Printer-friendly Version Interactive Discussion
Discussion
P
a
per
|
D
iscussion
P
a
per
|
Discussion
P
a
per
|
Discuss
ion
P
a
per
Deser, C., Knutti, R., Solomon, S., and Phillips, A. S.: Communication of the role of natural variability in future North American climate, Nat. Clim. Change, 2, 775–779, 2012.
Douville, H., Decharme, B., Ribes, A., Alkama, R., and Sheffield, J.: Anthropogenic influence
on multi-decadal changes in reconstructed global evapotranspiration, Nat. Clim. Change, 3, 59–62, 2012.
5
Durand, Y., Brun, E., Merindol, L., Guyomarc’h, G., Lesaffre, B., and Martin, E.: A
meteoro-logical estimation of relevant parameters for snow schemes used with atmospheric models, Ann. Glaciol., 18, 65–71, 1993.
Ebisuzaki, W.: A method to estimate the statistical significance of a correlation when the data are serially correlated, J. Climate, 10, 2147–2153, 1997.
10
Enfield, D. B., Mestas-Nunez, A. M., and Trimble, P. J.: The Atlantic multidecadal oscillation and its relation to rainfall and river flows in the continental US, Geophys. Res. Lett., 28, 2077–2080, 2001.
Ghil, M., Allen, R. M., Dettinger, M. D., Ide, K., Kondrashov, D., Mann, M. E., Robertson, A., Saunders, A., Tian, Y., Varadi, F., and Yiou, P.: Advanced spectral methods for climatic time
15
series, Rev. Geophys., 40, 3.1–3.41, 2002.
Giuntoli, I., Renard, B., Vidal, J.-P., and Bard, A.: Low flows in France and their relationship to large-scale climate indices, 482, 105–118, 2013.
Goddard, L. Kumar, A., Solomon, A., Smith, D., Boer, G., Gonzalez, P., Kharin, V., Merryfield, W., Deser, C., Mason, S. J., Kirtman B. P., Msadek, R., Sutton, R., Hawkins, E., Fricker,
20
T., Hegerl, G., Ferro, C. A. T., Stephenson, D. B., Meehl, G. A., Stockdale, T., Burgman, R., Greene A. M., Kushnir, Y., Newman, M., Carton, J., Fukumori, I., and Delworth, T.: A verification framework for interannnual-to-decadal prediction experiments, Clim. Dynam., 40, 245–272, 2013.
Gray, S. T., Graumlich, L. J., Betancourt, J. L., and Pederson, G. T.: A tree-ring based
recon-25
struction of the Atlantic Multidecadal Oscillation since 1567 A.D., Geophys. Res. Lett., 31, L12205, doi:10.1029/2004GL019932, 2004.
Habets, F., Boone, A., Champeaux, J.-L., Etchevers, P., Franchisteguy, L., Leblois, E., Ledoux, E., Le Moigne, P., Martin, E., Morel, S., Noilhan, J., Quintana Segui, P., Rousset-Regimbeau, F., and Viennot, P.: The SAFRAN-ISBA-MODCOU hydrometeorological model applied over
30
HESSD
10, 11861–11900, 2013Multi-decadal river flows variations in
France
J. Boé and F. Habets
Title Page
Abstract Introduction
Conclusions References
Tables Figures
◭ ◮
◭ ◮
Back Close
Full Screen / Esc
Printer-friendly Version Interactive Discussion
Discussion
P
a
per
|
D
iscussion
P
a
per
|
Discussion
P
a
per
|
Discuss
ion
P
a
per
Hannaford, J., Buys, G., Stahl, K., and Tallaksen, L. M.: The influence of decadal-scale variabil-ity on trends in long European streamflow records, Hydrol. Earth Syst. Sci., 17, 2717–2733, doi:10.5194/hess-17-2717-2013, 2013.
Hawkins, E. and Sutton, R.: The potential to narrow uncertainty in regional climate prediction, B. Am. Meteorol. Soc., 90, 1095–1107, 2009.
5
Kavvada, A., Ruiz-Barradas, A., and Nigam, S.: AMO’s structure and climate footprint in obser-vations and IPCC AR5 climate simulations, Clim. Dynam., doi:10.1007/s00382-013-1712-1, in press, 2013.
Kennedy, J. J., Rayner, N. A., Smith, R. O., Saunby, M., and Parker, D. E.: Reassessing biases and other uncertainties in sea-surface temperature observations since 1850 part 1:
mea-10
surement and sampling errors, J. Geophys. Res., 116, D14103, doi:10.1029/2010JD015218, 2011a.
Kennedy, J. J., Rayner, N. A., Smith, R. O., Saunby, M., and Parker, D. E.: Reassessing biases and other uncertainties in sea-surface temperature observations since 1850 part 2: biases and homogenisation, J. Geophys. Res., 116, D14104, doi:10.1029/2010JD015220, 2011b.
15
Kerr, R. A.: A North Atlantic climate pacemaker for the centuries, Science, 288, 1984–1985, 2000.
Knight, J. R., Allan, R. J., Folland, C. K., Vellinga, M., and Mann, M. E.: A signature of persistent natural thermohaline circulation cycles in observed climate, Geophys. Res. Lett., 32, L20708, doi:10.1029/2005GL024233, 2005.
20
Knight, J. R., Folland, C. K., and Scaife, A.: Climate impacts of the Atlantic multidecadal oscil-lation, Geophys. Res. Lett., 33, L17706, doi:10.1029/2006GL026242, 2006.
Krueger, O., Schenk, F., Feser, F., and Weisse, R.: Inconsistencies between long-term trends in storminess derived from the 20CR reanalysis and observations, J. Climate, 26, 868–874, 2013.
25
Ledoux, E., Girard, G., and Villeneuve, J. P.: Proposition d’un modèle couplé pour la simula-tion conjointe des écoulements de surface et des écoulements souterrains sur un bassin hydrologique, La Houille Blanche, 1, 101–110, 1984.
Otterå, O. H., Bentsen, M., Drange, H., and Suo, L.: External forcing as a metronome for Atlantic multidecadal variability, Nat. Geosci., 3, 688–694, 2010.
30
HESSD
10, 11861–11900, 2013Multi-decadal river flows variations in
France
J. Boé and F. Habets
Title Page
Abstract Introduction
Conclusions References
Tables Figures
◭ ◮
◭ ◮
Back Close
Full Screen / Esc
Printer-friendly Version Interactive Discussion
Discussion
P
a
per
|
D
iscussion
P
a
per
|
Discussion
P
a
per
|
Discuss
ion
P
a
per
Quintana Segui, P., Le Moigne, P., Durand, Y., Martin, E., Habets, F., Baillon, M., Franchisteguy, L., Morel, S., and Noilhan, J.: Analysis of near-surface atmospheric variables: validation of the SAFRAN analysis over France, J. Appl. Meteorol. Climatol., 47, 92–107, 2008.
Mann, M. E. and Lees, J. M.: Robust estimation of background noise and signal detection in climatic time series, Clim. Change, 33, 409–445, 1996.
5
Moisselin, J. M., Schneider, M., Canellas, C., and Mestre, O.: Changements climatiques en France au XXeme siecle. Etude des longues series de donnees homogeneisees francaises de precipitations et temperatures, Meteorol., 38, 45–56, 2002.
Noilhan, J. and Planton, S.: A simple parametrization of land surface processes for meteoro-logical models, Mon. Weather Rev., 117, 536–549, 1989.
10
Rudolf, B. and Schneider, U.: Calculation of gridded precipitation data for the global land-surface using in-situ gauge observations, in: Proceedings of the 2nd Workshop of the In-ternational Precipitation Working Group IPWG, Monterey, October 2004, EUMETSAT, ISBN 92-9110-070-6, ISSN 1727-432X, pp. 231–247, 2005.
Schlesinger, M. E. and Ramankutty, N.: An oscillation in the global climate system of period
15
65–70 years, Nature, 367, 723–726, 1994.
Sutton, R. T. and Dong, B.: Atlantic Ocean influence on a shift in European climate in the 1990s, Nat. Geosci., 5, 788–792, 2012.
Sutton, R. T. and Hodson, D. L. R.: Atlantic Ocean forcing of North American and European summer climate, Science, 309, 115–118, 2005.
20
Terray, L. and Boé, J.: Quantifying 21st-century France climate change and related uncertain-ties, C. R. Geosci., 345, 136–149, 2013.
Trenberth, K. E. and Shea, D. J.: Atlantic hurricanes and natural variability in 2005, Geophys. Res. Lett., 33, L12704, doi:10.1029/2006GL026894, 2006.
Vidal, J.-P., Martin, E., Franchistéguy, L., Baillon, M., and Soubeyroux, J.-M.: A 50-year
high-25
resolution atmospheric reanalysis over France with the Safran system, Inter. J. Climate, 30, 1627–1644, 2010.
HESSD
10, 11861–11900, 2013Multi-decadal river flows variations in
France
J. Boé and F. Habets
Title Page
Abstract Introduction
Conclusions References
Tables Figures
◭ ◮
◭ ◮
Back Close
Full Screen / Esc
Printer-friendly Version Interactive Discussion
Discussion
P
a
per
|
D
iscussion
P
a
per
|
Discussion
P
a
per
|
Discuss
ion
P
a
per
Fig. 1.Location of the gauging stations whose data are analyzed in this study. The length of
HESSD
10, 11861–11900, 2013Multi-decadal river flows variations in
France
J. Boé and F. Habets
Title Page
Abstract Introduction
Conclusions References
Tables Figures
◭ ◮
◭ ◮
Back Close
Full Screen / Esc
Printer-friendly Version Interactive Discussion
Discussion
P
a
per
|
D
iscussion
P
a
per
|
Discussion
P
a
per
|
Discuss
ion
P
a
per
1920 1940 1960 1980 2000
−2 −1 0 1
2 (a)
1920 1940 1960 1980 2000
−2 −1 0 1 2
no units
Spring Year
(b)
0.0 0.1 0.2 0.3 0.4
Frequency (cycles/year) 1
10 100 1000
MTM power
Spring Year
Fig. 2. (a)Standardized river flows of the Gave d’Ossau at Oloron-Sainte-Marie
(Oloron-Ste-Croix). Bars: annual means. Thick lines: low-pass filtered spring and annual series.(b)