HESSD
7, 8947–8986, 2010Effect of soil moisture variability
on the runoff
response
J. Minet et al.
Title Page
Abstract Introduction
Conclusions References
Tables Figures
◭ ◮
◭ ◮
Back Close
Full Screen / Esc
Printer-friendly Version
Interactive Discussion
Discussion
P
a
per
|
Dis
cussion
P
a
per
|
Discussion
P
a
per
|
Discussio
n
P
a
per
Hydrol. Earth Syst. Sci. Discuss., 7, 8947–8986, 2010 www.hydrol-earth-syst-sci-discuss.net/7/8947/2010/ doi:10.5194/hessd-7-8947-2010
© Author(s) 2010. CC Attribution 3.0 License.
Hydrology and Earth System Sciences Discussions
This discussion paper is/has been under review for the journal Hydrology and Earth System Sciences (HESS). Please refer to the corresponding final paper in HESS if available.
E
ff
ect of GPR-derived within-field soil
moisture variability on the runo
ff
response using a distributed hydrologic
model
J. Minet1, E. Laloy2, S. Lambot1,3, and M. Vanclooster1
1
Earth and Life Institute, Universit ´e catholique de Louvain, Croix du Sud 2 BP 2, 1348 Louvain-la-Neuve, Belgium
2
Department of Civil and Environmental Engineering, The Environment Institute, University of California, Irvine, CA 92697-2175, USA
3
Agrosphere (ICG-4), Institute of Chemistry and Dynamics of the Geosphere, Forschungszentrum J ¨ulich GmbH, 52425 J ¨ulich, Germany
Received: 27 October 2010 – Accepted: 10 November 2010 – Published: 17 November 2010
Correspondence to: J. Minet ([email protected])
HESSD
7, 8947–8986, 2010Effect of soil moisture variability
on the runoff
response
J. Minet et al.
Title Page
Abstract Introduction
Conclusions References
Tables Figures
◭ ◮
◭ ◮
Back Close
Full Screen / Esc
Printer-friendly Version
Interactive Discussion
Discussion
P
a
per
|
Dis
cussion
P
a
per
|
Discussion
P
a
per
|
Discussio
n
P
a
per
|
Abstract
The importance of the spatial variability of the antecedent soil moisture conditions on the runoffresponse is widely acknowledged in hillslope hydrology. Using a distributed hydrologic model, this paper aims at investigating the effects of soil moisture spatial variability on the runoffin various field conditions and at finding the soil moisture
sce-5
nario that behaves the most closely as the measured soil moisture pattern in term of runoffhydrograph. Soil moisture was surveyed in ten different field campaigns using a proximal ground penetrating radar (GPR) that allowed to perform high-resolution (∼m)
mapping at the field scale (several ha). Based on these soil moisture measurements, seven scenarios of antecedent soil moisture were used to feed hydrological
simula-10
tions and the resulting hydrographs were compared. The novelty of this work is to benefit from high-resolution soil moisture measurements using an advanced GPR in various soil moisture conditions. Accounting for the spatial variability of soil moisture resulted in a larger discharge than using a spatially constant soil moisture. The ranges of possible hydrographs were delineated by the extreme scenarios where soil moisture
15
was directly and inversely arranged according to the topographic wetness index (TWI). These behaviours could be explained in terms of runoffcontributing areas, with respect to their sizes and their relative locations within the field. The most efficient scenario for soil moisture appeared to be when soil moisture is directly arranged according to the TWI. This was related to the correlation of the measured soil moisture and the TWI.
20
These observations generalised some of the statements pointed out in previous stud-ies. Similar findings are thus expected under similar soil and rainfall forcing conditions.
1 Introduction
Antecedent soil moisture conditions prior to a rainfall event is a key factor in hydrological processes as it mainly governs the generation of runoffdue to its effect on infiltration
25
HESSD
7, 8947–8986, 2010Effect of soil moisture variability
on the runoff
response
J. Minet et al.
Title Page
Abstract Introduction
Conclusions References
Tables Figures
◭ ◮
◭ ◮
Back Close
Full Screen / Esc
Printer-friendly Version
Interactive Discussion
Discussion
P
a
per
|
Dis
cussion
P
a
per
|
Discussion
P
a
per
|
Discussio
n
P
a
per
sensitive to the description of antecedent soil moisture conditions. The response of the hydrologic models to initial soil moisture is moreover often highly non-linear and shows a threshold behaviour.
The effect of the antecedent soil moisture spatial variability on the hydrologic re-sponse at the field scale has been widely addressed in numerous studies through
5
hydrologic modelling (Merz and Plate, 1997; Merz and Bardossy, 1998; Bronstert and Bardossy, 1999; Castillo et al., 2003; Zehe et al., 2005). In particular, Merz and Plate (1997); Merz and Bardossy (1998); Bronstert and Bardossy (1999) showed that ac-counting for the spatial variability of antecedent soil moisture yields a larger discharge compared to assuming uniform soil moisture conditions. Regarding the type of
vari-10
ability, Merz and Plate (1997); Merz and Bardossy (1998); Zehe et al. (2005) observed that a structured soil moisture pattern results in a larger discharge than a stochastic random variability. In contrast to this, Bronstert and Bardossy (1999) observed the largest discharges with a random soil moisture pattern. Bronstert and Bardossy (1999) also showed that the introduction of topographic data in the modelling of soil
mois-15
ture was the best strategy to obtain a runoff response close to the measured outlet response. The importance of the spatial variability of soil moisture for hydrologic mod-elling has also received a specific attention in data assimilation studies (Houser et al., 1998; Pauwels et al., 2001; Crow and Ryu, 2009; Brocca et al., 2010). The large effect of the soil moisture variability on the runoff response observed in these studies was
20
attributed to the nature of the runoffgeneration, that is mainly infiltration excess over-land flow. The location of the contributing areas, which are directly related to the soil moisture state, modulates the hydrologic response as generated runoffcan re-infiltrate on its way downhill to the catchment outlet.
The way the spatial variability of soil moisture impacts on the runoff is moreover
25
HESSD
7, 8947–8986, 2010Effect of soil moisture variability
on the runoff
response
J. Minet et al.
Title Page
Abstract Introduction
Conclusions References
Tables Figures
◭ ◮
◭ ◮
Back Close
Full Screen / Esc
Printer-friendly Version
Interactive Discussion
Discussion
P
a
per
|
Dis
cussion
P
a
per
|
Discussion
P
a
per
|
Discussio
n
P
a
per
|
be observed only under specific rainfall forcing. In that respect, in a semi-arid catch-ment, Castillo et al. (2003) noticed that the runoffresponse is insensitive to antecedent soil moisture conditions for high intensity rainfalls or for poorly permeable soils. Hence, in some conditions, assuming a constant mean soil moisture may be sufficient to cor-rectly model the rainfall-runoffresponse, particularly if extreme events are considered
5
(e.g., in flood risks applications).
The scale aggregation of soil moisture data as well as other inputs (e.g., digital eleva-tion model) can also highly alter the accuracy of the response of the hydrologic model. Using information theory, Kuo et al. (1999) noticed that the deviations in the simulated runoffincrease proportionally with the grid size of a distributed hydrologic model,
espe-10
cially for steep topography and in wet conditions. Finally, the high sensitivity of runoff response to the antecedent soil moisture moreover implies that the uncertainty in soil moisture characterization exerts a large effect on the predictability of hydrologic mod-els, similarly to the effect of soil moisture variability (Zehe and Bl ¨oschl, 2004). Still, the effect of the variability of soil moisture on the runoffresponse has to be investigated for
15
various conditions of catchment attributes, soil moisture patterns and rainfall forcing. In a near future, the availability of in-situ measurements of soil moisture for hydrologic applications is expected to largely increase through the development of soil moisture dedicated remote sensing platforms (Wagner et al., 2007), soil moisture electrical sen-sors and their implementation in sensor networks (Vereecken et al., 2008; Robinson
20
et al., 2008) and non-invasive sensors such as ground penetrating radar (GPR) (Huis-man et al., 2003; Lambot et al., 2008a). In that respect, GPR has shown great potential-ities to accurately characterise the soil moisture at the field scale with a high resolution (Serbin and Or, 2005; Weiherm ¨uller et al., 2007; Lambot et al., 2008b; Minet et al., 2010b). However, the scale gap between large-scale remote sensing and
ground-25
HESSD
7, 8947–8986, 2010Effect of soil moisture variability
on the runoff
response
J. Minet et al.
Title Page
Abstract Introduction
Conclusions References
Tables Figures
◭ ◮
◭ ◮
Back Close
Full Screen / Esc
Printer-friendly Version
Interactive Discussion
Discussion
P
a
per
|
Dis
cussion
P
a
per
|
Discussion
P
a
per
|
Discussio
n
P
a
per
The purposes of this paper are: (1) to investigate the effect of different scenarios of antecedent soil moisture organisation on the runoffin a distributed hydrologic model at the field scale and; (2) to find the soil moisture scenario that behaves the most closely as the measured soil moisture pattern in term of hydrologic response. High resolution soil moisture data were acquired in 10 agricultural fields using a proximal GPR (Lambot
5
et al., 2004, 2006b; Minet et al., 2010b; Jadoon et al., 2010). Seven scenarios of soil moisture maps, including the measured data, are considered in order to determine which degree of description of soil moisture variability is necessary to get a correct estimation of the runoff. The scenarios are compared based on the difference between their simulated hydrographs and their performance are evaluated with respect to the
10
simulated hydrograph using the measured soil moisture pattern.
As pointed out by Western et al. (1999), large datasets of high-resolution soil mois-ture are required to readily assess the effect of antecedent soil moisture conditions, rather than relying on a few point values that may not capture the real soil moisture patterns. The GPR system we used meets this requirement owing to the proximity
15
of its support scale to the resolution of acquisition, which is around 1 m. Similarly to radar remote sensing platforms, proximal sensing of soil moisture using GPR permits to acquire the continuous soil moisture pattern, moreover at a much finer scale. The main novelties of this work compared to the previous studies are: (1) to benefit from a very high resolution (∼m) soil moisture mapping technique at the field scale (sev-20
HESSD
7, 8947–8986, 2010Effect of soil moisture variability
on the runoff
response
J. Minet et al.
Title Page
Abstract Introduction
Conclusions References
Tables Figures
◭ ◮
◭ ◮
Back Close
Full Screen / Esc
Printer-friendly Version
Interactive Discussion
Discussion
P
a
per
|
Dis
cussion
P
a
per
|
Discussion
P
a
per
|
Discussio
n
P
a
per
|
2 Materials and methods
2.1 Sensing of soil moisture by GPR
2.1.1 GPR setup
In this paper, soil moisture was measured by a proximal GPR system using a large frequency bandwidth. Following Lambot et al. (2004, 2006b), the GPR system we used
5
is set up with a vector network analyzer (VNA) (ZVL, Rohde and Schwarz, M ¨unich, Germany) connected to an ultra wideband monostatic horn antenna (BBHA 9120 F, Schwarzbeck Mess-Elektronik, Sch ¨onau, Germany) situated offthe ground. According to the operating bandwidth of the antenna, the VNA emulates a stepped-frequency electromagnetic wave from 200 to 2000 MHz. The monostatic GPR antenna transmits
10
the electromagnetic wave towards the ground surface and receives the returned wave which is recorded by the VNA.
2.1.2 GPR data inversion for soil moisture retrieval
For non-magnetic soils, the GPR wave propagation is governed by the soil dielectric permittivityεand electrical conductivityσ. As the dielectric permittivity of water (εw≈
15
80) is much larger than the one of the soil particles (εs≈5) and air (εa=1), GPR measurements are mainly influenced by the soil water content.
Soil moisture was derived from the raw measured GPR data using inversion of the GPR data. First, antenna effect and the soil-antenna interactions were removed from the raw GPR measured data using three frequency-dependent antenna transfer
func-20
tions (Lambot et al., 2004). GPR data were then transformed from the frequency to the time domain using an inverse Fourier transform. In order to obtain the surface soil dielectric permittivity, the time domain signal was selected on a time window containing the surface reflection only (Lambot et al., 2006b). The soil dielectric permittivityεwas then retrieved by inverting the GPR data using an electromagnetic model simulating
HESSD
7, 8947–8986, 2010Effect of soil moisture variability
on the runoff
response
J. Minet et al.
Title Page
Abstract Introduction
Conclusions References
Tables Figures
◭ ◮
◭ ◮
Back Close
Full Screen / Esc
Printer-friendly Version
Interactive Discussion
Discussion
P
a
per
|
Dis
cussion
P
a
per
|
Discussion
P
a
per
|
Discussio
n
P
a
per
the propagation of the wave into the soil. The electromagnetic model is an exact solu-tion of the 3-D Maxwell’s equasolu-tion for electromagnetic wave propagasolu-tion in the air-soil system, considered as a layered medium.
In order to avoid noise in the GPR data that arises at high frequencies because of soil roughness, the inversions were led in the limited frequency range from 200 to 800 MHz.
5
Soil roughness starts to affect the GPR data only for roughness heights larger than one eighth the radar wavelength (Lambot et al., 2006a), that is, for a permittivity of 9 and the central frequency of 500 MHz, 8 cm. Optimization was performed using a local search algorithm, that was, the Levenberg-Marquardt algorithm. Two parameters were optimized in the inversion, that were, the surface soil dielectric permittivityεand the
10
GPR antenna height above the ground. In this paper, the soil electrical conductivityσ was not optimized but was directly derived from the soil moistureθusing a laboratory-calibrated relationship following the model of Rhoades et al. (1976):
σ=(aθ2+bθ)σw+σs (1)
where the parameters are set toa=1.85,b=3.85×10⁻²,σw=0.075 Sm− 1
and σs=
15
5.89×10⁻⁴Sm−1.
After GPR inversion, the optimized surface soil dielectric permittivityεwas translated into surface soil moisture θ using the Topp’s petrophysical relationship (Topp et al., 1980):
θ=−5.3×10⁻²+2.92×10⁻²ε−5.5×10⁻⁴ε2+4.3×10⁻⁶ε3 (2) 20
2.1.3 GPR acquisition in agricultural fields
For field acquisition, the GPR system was mounted on a four-wheel motorcycle with a differential global positioning system (DGPS) (Leica GPS1200, Leica Geosystems) and a PC (Minet et al., 2010b). The PC automatically integrated the DGPS position, controlled the VNA for launching the GPR measurement and saved the measured GPR
25
HESSD
7, 8947–8986, 2010Effect of soil moisture variability
on the runoff
response
J. Minet et al.
Title Page
Abstract Introduction
Conclusions References
Tables Figures
◭ ◮
◭ ◮
Back Close
Full Screen / Esc
Printer-friendly Version
Interactive Discussion
Discussion
P
a
per
|
Dis
cussion
P
a
per
|
Discussion
P
a
per
|
Discussio
n
P
a
per
|
regular distance spacing of two meters in the same track, according to the DGPS position, which is known with a precision of about 3 cm. The motorcycle has driven along parallel tracks with a distance spacing of 5 to 15 m between the tracks. More than 1000 points were measured per hour, with a driving speed of about 5 km/h. The antenna footprint where the soil moisture is measured has a diameter of about 1.5 m.
5
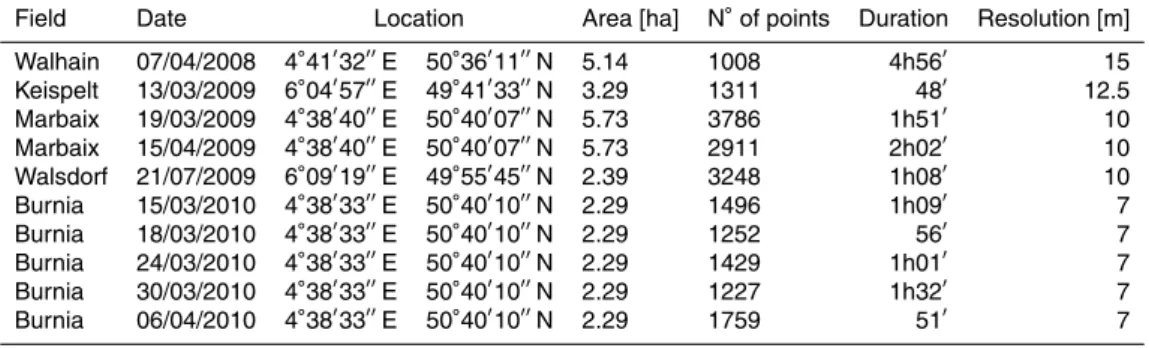
In this paper, we used 10 GPR acquisitions performed in 5 different agricultural fields in Belgium and Luxemburg with different soil moisture conditions. Table 1 summarizes the 10 GPR acquisitions and shows the area, the number of measurement points and the duration of the acquisition for each field campaign. Time-lapse measurements were performed in two fields only, i.e., in Marbaix and Burnia, in spring 2009 and 2010,
10
respectively.
For each field, the largest watershed was chosen, so that there is just one outlet whose the contributive area encompasses the part of the field which is considered. Considering that the fields are hydrologically isolated from the neighboured plots, each field can be seen as a single catchment. All the acquisition were performed on bare or
15
nearly-bare soils with vegetation height less than 10 cm and a soil roughness less than 5 cm, thus avoiding scattering problems in the measured GPR data. The GPR-derived soil moisture reflects the surface soil moisture with a depth of investigation of about 5 to 10 cm. It is assumed that this surface soil moisture reliably reflects the soil moisture of the hydrological active soil layer or, at least, its spatial variability.
20
The GPR method for soil moisture retrieval was widely validated in laboratory con-ditions (Lambot et al., 2004, 2006b; Minet et al., 2010a) under specific critical cases, i.e., high soil electrical conductivity and soil layering. The method was applied to field conditions (Weiherm ¨uller et al., 2007; Lambot et al., 2008b; Jadoon et al., 2010; Minet et al., 2010b). Using the same GPR setup in field conditions along a transect, Jadoon
25
HESSD
7, 8947–8986, 2010Effect of soil moisture variability
on the runoff
response
J. Minet et al.
Title Page
Abstract Introduction
Conclusions References
Tables Figures
◭ ◮
◭ ◮
Back Close
Full Screen / Esc
Printer-friendly Version
Interactive Discussion
Discussion
P
a
per
|
Dis
cussion
P
a
per
|
Discussion
P
a
per
|
Discussio
n
P
a
per
2.2 Modelling of antecedent soil moisture maps
Soil moisture spatial variability can be analysed in terms of stochastic or deterministic variability (Bl ¨oschl and Sivapalan, 1995). The stochastic variability (or random, non-structured variability) of soil moisture entails that soil moisture cannot be a completely deterministic variable based on local attributes but rather a variable with global
sta-5
tistical properties that can be determined. On the other hand, soil moisture can be viewed as a spatially deterministic (or structured) variable that is uniquely determined by local conditions, mainly topography, soil properties, and vegetation cover. Between these two extremes, hydrological systems exhibit soil moisture conditions that can be modeled from pure random variability to highly structured soil moisture patterns, with
10
intermediate degree of organisation, where soil moisture can be captured using vari-ograms or connectivity functions (Western et al., 1999). The introduction of auxiliary spatial data (e.g., topography) to simulate soil moisture defines however the limit be-tween stochastic and deterministic variability. In addition, it is worth mentioning that a stochastic soil moisture description implies several random realizations while a
deter-15
ministic soil moisture pattern is usually an unique realization.
In order to assess the effect of different antecedent soil moisture conditions in the hy-drologic modelling, 7 different types of antecedent soil moisture maps were constructed (see further explanations in this section below):
1. True: GPR-derived measured values,θ=θGPR
20
2. Constant: θ=θmean=constant
3. TWI: True values sorted according to the topographic wetness index
4. TWIinv: True values inversely sorted according to the topographic wetness index 5. Random: Randomly permuted values
6. Variogram: Spatially coherent values using a variogram
HESSD
7, 8947–8986, 2010Effect of soil moisture variability
on the runoff
response
J. Minet et al.
Title Page
Abstract Introduction
Conclusions References
Tables Figures
◭ ◮
◭ ◮
Back Close
Full Screen / Esc
Printer-friendly Version
Interactive Discussion
Discussion
P
a
per
|
Dis
cussion
P
a
per
|
Discussion
P
a
per
|
Discussio
n
P
a
per
|
7. Connected: Spatially coherent and connected values
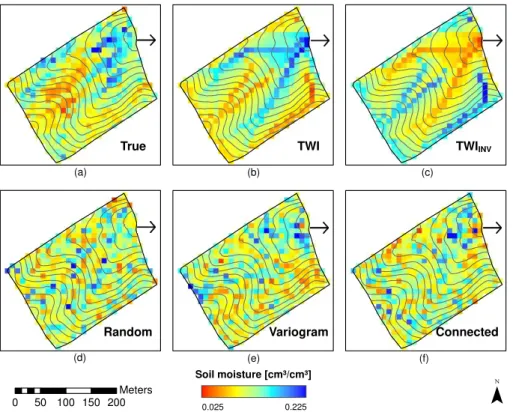
The scenarios 2 to 4 are the deterministic scenarios, i.e., they consist of an unique realization, while the scenarios 5 to 7 are the stochastic scenarios, for which 1000 realizations were performed. These soil moisture scenarios are all based on the GPR-derived soil moisture that was measured during the field acquisitions. Figure 1 presents
5
all the soil moisture scenarios (except theconstant) for the field of Marbaix with soil moisture data measured on the 15 April 2009 only.
The soil moisture values measured by the GPR were not regularly spaced in the field, but rather followed the acquisition tracks (see Fig. 2). The hydrologic model however requires as an input perfectly grid-shaped antecedent soil moisture maps.
10
Therefore, the measured values must be rasterised. The first scenario (true, Fig. 1a), that is based on the real locations of GPR measured values, was thus made by filling a regular grid with the average of the measured values that fell into each pixel of the grid. The resolutions of the grids (see Table 1, last column) were set as the maximal resolution that avoids empty pixel in the grid.
15
For the second scenario (constant), soil moisture values were set as constant over space and equal to the mean of the measured values from the first map. This map is not presented in Fig. 1.
In the third scenario (TWI scenario, Fig. 1b), true values were sorted according to the topographic wetness index (TWI), as defined by Beven and Kirkby (1979):
20
TWI=ln
a tan(β)
(3)
whereais the raster of the flow accumulation andβis the raster of the slope expressed in %. We used a single direction algorithm to compute the flow accumulation raster. The TWI was preliminary computed over the fields using a digital elevation model of same resolution. Then, moisture and TWI values were ranked and moisture values
25
HESSD
7, 8947–8986, 2010Effect of soil moisture variability
on the runoff
response
J. Minet et al.
Title Page
Abstract Introduction
Conclusions References
Tables Figures
◭ ◮
◭ ◮
Back Close
Full Screen / Esc
Printer-friendly Version
Interactive Discussion
Discussion
P
a
per
|
Dis
cussion
P
a
per
|
Discussion
P
a
per
|
Discussio
n
P
a
per
TWI values were inversely ranked, so that the pixels with the highest TWI values re-ceived the lowest soil moisture values.
The TWI was chosen for modelling structured soil moisture pattern among other to-pographic indices because of its well-known high predictive power for small catchments in relatively wet conditions. For larger catchment scale (>10 km), potential radiative
in-5
dices, soil type and land cover may better explain soil moisture patterns (Western et al., 1999). For drier climatic conditions, when evapotranspiration exceed precipitation, lo-cal controls as potential radiative indices have shown better correlations with observed soil moisture (Grayson et al., 1997). Some reviews about the predictive power of the TWI for soil moisture can be found in Western et al. (1999) and Sørensen et al. (2006).
10
The fifth scenario (random, Fig. 1d) was made by randomly permuting the measured values over space. As the random process can lead to different maps, 1000 realizations of this scenario were repeated, as well as for the two following scenarios (stochastic variability scenarios).
The sixth scenario (variogram, Fig. 1e) was made by simulating soil moisture
pat-15
terns using a variogram that was computed from the measured data. True values were then ranked and attributed to the pixels where the simulated values were in the same rank. This ranking procedure permitted therefore to preserve exactly the same distri-bution of values as in thetrue,random, TWI and TWIinvscenarios.
The seventh scenario (connected, Fig. 1f) is characterised by connected patterns
20
of high soil moisture values. It was made following the method of Zinn and Harvey (2003) that was used here to produce a highly connected pattern of a given variable. First, spatially coherent values of a zero-centered normal distribution were simulated over the field extent using a variogram. Second, the absolute value of the simulated values were taken, so that the locations where the values were close to zero (i.e., now
25
HESSD
7, 8947–8986, 2010Effect of soil moisture variability
on the runoff
response
J. Minet et al.
Title Page
Abstract Introduction
Conclusions References
Tables Figures
◭ ◮
◭ ◮
Back Close
Full Screen / Esc
Printer-friendly Version
Interactive Discussion
Discussion
P
a
per
|
Dis
cussion
P
a
per
|
Discussion
P
a
per
|
Discussio
n
P
a
per
|
values were attributed to the pixels where the simulated values were in the same rank, so that the connected paths (i.e., the lowest simulated values) received the highest soil moisture values.
It is worth noting that all scenarios have the same mean as the true scenario, and that all the scenarios, except the constant one, show exactly the same distribution
5
as thetrue scenario, owing to the ranking procedure. This allowed to truly compare the modelling discharge, given the fact that the different modeled soil moisture maps kept the same statistical properties. The true, variogram and connected maps have moreover the same geostatistical properties. Actually, therandom scenario can yield exactly the same antecedent soil moisture maps which were realised with the true,
10
TWI, TWIinv,variogramandconnectedscenarios, as the same values were merely re-arranged according to different schemes. But the probability that therandomscenario yields a particular realization is drastically low, i.e., equals to n1!, wherenis the number of pixels.
For larger catchments than the ones dealt with in this paper, the real complete
dis-15
tribution of soil moisture may be unknown at a high resolution at the field scale. Nev-ertheless, a coarse-scale mean soil moisture can be measured by remote sensing and its fine-scale statistical properties (e.g., standard deviation, correlation length) can be found in the literature. In that respect, several authors have studied the empirical re-lationship between the mean soil moisture and its corresponding standard deviation
20
for different extent scale, as in, e.g., Western et al. (2003); Vereecken et al. (2007); Famiglietti et al. (2008). Geostastistical behaviour of soil moisture at the field scale can also be found in Western et al. (1998), among others. Therefore, even without high-resolution soil moisture data, similar scenarios of high-high-resolution soil moisture maps as in this paper could be constructed using solely a mean soil moisture, topography data
25
HESSD
7, 8947–8986, 2010Effect of soil moisture variability
on the runoff
response
J. Minet et al.
Title Page
Abstract Introduction
Conclusions References
Tables Figures
◭ ◮
◭ ◮
Back Close
Full Screen / Esc
Printer-friendly Version
Interactive Discussion
Discussion
P
a
per
|
Dis
cussion
P
a
per
|
Discussion
P
a
per
|
Discussio
n
P
a
per
2.3 Hydrologic model
In this work, we used the hydrological component of the continuous runoffand erosion CREDHYS model (see Laloy and Bielders, 2008, 2009, for a comprehensive model de-scription). This model can be used at the rainfall event scale to simulate high-frequency variability in rainfall-runoff processes. Short time steps are then required to properly
5
capture soil physical dynamics. Consequently, the model requires one minute time step rainfall data as input. The model is spatially distributed and the flow path must be derived from topography through a flow accumulation grid. A model parameterization corresponding to a typical crusted bare loamy soil (see Laloy and Bielders, 2008; Laloy et al., 2010) was selected for the simulations. The same parameterization was used
10
for all the field campaigns, except for the soil saturated conductivity that was set to 25 mm/h for Burnia and to 20 mm/h for the other fields. This parameter, which is the most sensitive for runoffproduction, was the only parameter that was adapted such that the generated runoffat the outlet could be observed for all the fields. Due to the ab-sence of measured discharge, the hydrologic model could not be specifically calibrated
15
for each of the fields. The same rainfall forcing was also used and is corresponding to a short and moderately intensive event recorded in Belgium.
3 Results
3.1 Soil moisture data measured by GPR acquisition
3.1.1 Surface soil moisture maps
20
HESSD
7, 8947–8986, 2010Effect of soil moisture variability
on the runoff
response
J. Minet et al.
Title Page
Abstract Introduction
Conclusions References
Tables Figures
◭ ◮
◭ ◮
Back Close
Full Screen / Esc
Printer-friendly Version
Interactive Discussion
Discussion
P
a
per
|
Dis
cussion
P
a
per
|
Discussion
P
a
per
|
Discussio
n
P
a
per
|
all the variograms. These variograms were then used to simulate non-conditioned spatially coherent values for thevariogramandconnected scenarios.
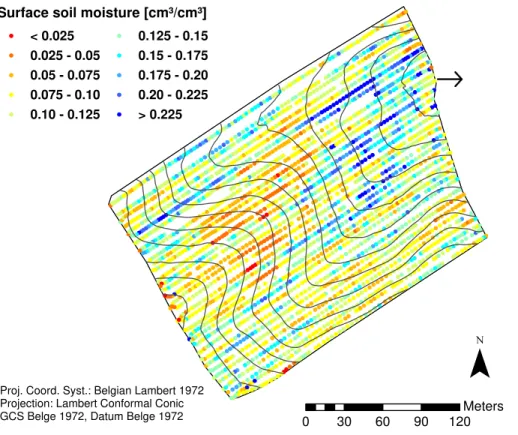
As an example, Fig. 2 shows the map of surface soil moisture measured by GPR in Marbaix on the 15 April 2009. It is worth noting that the point-symbols appear around two times larger on the map compared to the real GPR antenna footprint size. The
5
mean and standard deviation of soil moisture are found to be equal to 0.115 and 0.047, respectively. Soil moisture conditions were therefore clearly dry for this GPR acquisi-tion, with a corresponding smaller variability compared to the other fields investigated in this paper (see Table 2).
Soil moisture values appeared globally spatially coherent, although some nugget
10
effect can be observed between neighbouring points. In particular, we can observe a line effect with a high spatial coherence for points along the same acquisition line (i.e., the acquisition tracks), whereas there are some abrupt changes when moving to adjacent lines. This line effect, already observed in a previous study with the same acquisition system (Minet et al., 2010b), could be explained by the influence of the soil
15
ploughing which was performed in the same direction as the GPR acquisition. At a larger scale however, soil moisture patterns were mainly related to the topography, that is, hilltops were drier than the thalwegs. The wettest points appeared in the bottom of the thalwegs and near the outlet.
Figure 3 shows the variogram of the soil moisture values computed for the field
20
campaign in Marbaix on the 15 April 2009. A good spatial coherence was observed with a regular increase of the soil moisture variance with increasing distance classes until the range that was found to be 67 m. The nugget effect was important and equaled to 71% of the total variance (Table 2). This high nugget effect, reflecting the line effect explained above, may originate from GPR measurement errors and from the
small-25
scale variability due to microtopography forcing and soil surface conditions.
HESSD
7, 8947–8986, 2010Effect of soil moisture variability
on the runoff
response
J. Minet et al.
Title Page
Abstract Introduction
Conclusions References
Tables Figures
◭ ◮
◭ ◮
Back Close
Full Screen / Esc
Printer-friendly Version
Interactive Discussion
Discussion
P
a
per
|
Dis
cussion
P
a
per
|
Discussion
P
a
per
|
Discussio
n
P
a
per
clear trend between the mean soil moisture and the importance of the nugget effect (Table 2). This may originate from the different field conditions in terms of soil type and topography that were encountered in this study.
3.1.2 Relation between TWI and measured soil moisture
The Pearson’s coefficients of correlation between the TWI and the measured soil
mois-5
ture from thetrue maps were computed (rTWI,θ, Table 2, last column) and was equal to 0.385 for Marbaix, 15 April 2009. For the other field campaigns, the correlation between the TWI and soil moisture was always lower and even negative, as for, e.g., Walsdorf. In this study, the TWI appeared to be therefore a poor predictor of the soil moisture spatial distribution. However, a close examination of Fig. 1a and b reveals that
10
this correlation may increase at a larger scale, as the overall patterns of soil moisture in thetrueand the TWI maps may appear more similar when aggregating some pixels. In that respect, several studies has shown that the explaining power of the TWI for soil moisture increases with the scale aggregation (Sørensen et al., 2006) or by compar-ing grid cells accountcompar-ing for an uncertainty in the location of the cells (G ¨untner et al.,
15
2004). Meanwhile, the use of multidirectional flow accumulation algorithms could also improve the computation of the TWI and its correlation with measured soil moisture (Quinn et al., 1995; Tarboton, 1997; Seibert and McGlynn, 2007).
3.2 Effect of antecedent soil moisture on hydrographs
3.2.1 Hydrographs simulated with the deterministic soil moisture maps
20
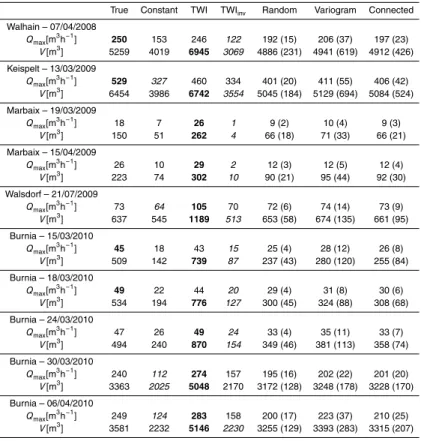
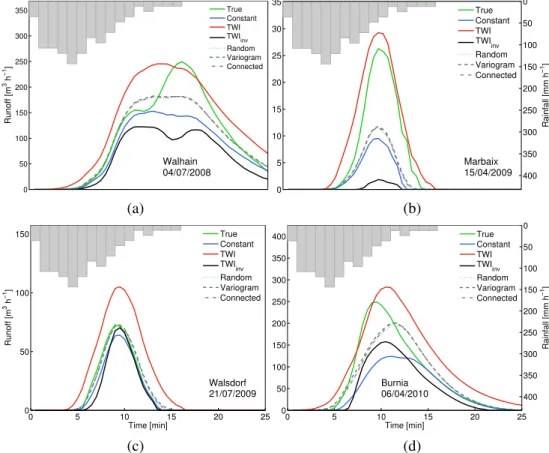
Simulations with the hydrologic model were conducted for the 10 field campaigns using the 7 different scenarios of the antecedent soil moisture maps. Table 3 presents the maximum runoffpeaks and total runoffvolumes resulting from the hydrologic simula-tions. Figure 4 shows the hydrographs for 4 field campaigns only, that are, Walhain – 7 April 2008 (a), Marbaix – 15 April 2009 (b), Walsdorf – 21 July 2009 (c) and
HESSD
7, 8947–8986, 2010Effect of soil moisture variability
on the runoff
response
J. Minet et al.
Title Page
Abstract Introduction
Conclusions References
Tables Figures
◭ ◮
◭ ◮
Back Close
Full Screen / Esc
Printer-friendly Version
Interactive Discussion
Discussion
P
a
per
|
Dis
cussion
P
a
per
|
Discussion
P
a
per
|
Discussio
n
P
a
per
|
Burnia – 06 April 2010 (d). For stochastic soil moisture scenarios, i.e.,random, sim-ulated,connected, the average hydrographs of the 1000 realizations are depicted.
The constant scenario, where the soil moisture uniformly equals the mean value, showed a lower discharge peak and volume compared to all the other scenarios, ex-cept the TWIinv. Merz and Plate (1997); Merz and Bardossy (1998); Bronstert and
5
Bardossy (1999) already observed that constant soil moisture conditions result in the lowest discharge compared to spatially-variable soil moisture.
The hydrographs simulated with the TWI and TWIinvscenarios completely delineated the range of variation of the other hydrographs for Marbaix – 15 April 2009 (Fig. 4b) as well as for Marbaix – 19 March 2009 and for the first 3 dates in Burnia. For the
10
other field campaigns, although some scenarios (e.g., thetrue) can exceed this range, the hydrographs from the two soil moisture maps based on the topographic wetness index generally gave the range of variation for the other hydrographs. In terms of runoff volume, the TWI scenario always resulted in the largest discharge, as it was observed by Merz and Bardossy (1998) for one field. The TWIinvscenario resulted in the lowest 15
runoffin 9 out of 10 field campaigns in terms of runoffvolume.
As mean soil moisture increases, the range of variation of the hydrographs between the two extreme scenarios (TWI and TWIinv) tends however to diminish. Figure 5 shows
the relative difference between runoffvolume from the TWI and TWIinv scenarios as a
function of the mean soil moisture in the field. There was a very good relation between
20
these two variables considering the Belgian fields (Burnia, Marbaix, Walhain) only, with a coefficient of correlation of−0.920, compared to a coefficient of correlation of−0.729
for all the fields. The range of variation of the hydrographs, i.e., the sensitivity of the runoffresponse to the soil moisture spatial variability, appeared thus to be minimised in wet conditions.
25
HESSD
7, 8947–8986, 2010Effect of soil moisture variability
on the runoff
response
J. Minet et al.
Title Page
Abstract Introduction
Conclusions References
Tables Figures
◭ ◮
◭ ◮
Back Close
Full Screen / Esc
Printer-friendly Version
Interactive Discussion
Discussion
P
a
per
|
Dis
cussion
P
a
per
|
Discussion
P
a
per
|
Discussio
n
P
a
per
is highlighted by the negative correlation between the TWI and soil moisture (Table 2, last column). A part of the runoff which was generated in the wettest part may then have re-infiltrated before reaching the outlet. For Walsdorf, the soil moisture pattern may be better explained by the soil type or by radiative indices, as it was the only field campaign that was conducted in summer.
5
3.2.2 Hydrographs simulated with the stochastic soil moisture maps
Figure 6 shows the 1000 hydrographs from therandomscenario for the field campaign in Marbaix, 15 April 2009. The hydrographs from the four first soil moisture scenarios are also plotted, as well as the averagerandom hydrograph. The 1000 random hy-drographs cover a wide range of values but the peak discharge is always lower than
10
thetrue and TWI scenarios hydrographs, denoting the particular arrangements of soil moisture patterns in these scenarios that produced a high discharge, although random simulation could theoretically provide the same soil moisture map as the ones from thetrue or TWI scenarios. Because of the non-linearity of the hydrologic model, one can also notice that the averagerandom hydrograph is different from theconstant
hy-15
drograph, although the averagerandom antecedent soil moisture map is theoretically equal to theconstantone.
It is worth noticing that a particular realization of therandom scenario can result in a hydrograph drastically different from another realization. Other fields than Marbaix, 15 April 2009 showed averagerandomhydrographs that were better approaching the
20
trueone, but there were still a large variability between the realizations.
Figure 7 shows the 1000 hydrographs from thevariogramscenario for the field cam-paign in Marbaix, 15 April 2009. The hydrographs cover a very wide range of values, even overlapping the range delineated by the hydrographs from the TWI and TWIinv
scenarios. The variogram scenario based antecedent soil moisture map giving the
25
HESSD
7, 8947–8986, 2010Effect of soil moisture variability
on the runoff
response
J. Minet et al.
Title Page
Abstract Introduction
Conclusions References
Tables Figures
◭ ◮
◭ ◮
Back Close
Full Screen / Esc
Printer-friendly Version
Interactive Discussion
Discussion
P
a
per
|
Dis
cussion
P
a
per
|
Discussion
P
a
per
|
Discussio
n
P
a
per
|
that, for all the 10 fields, the highestvariogramscenario based hydrograph showed the largest discharge peak and volume compared to the highestrandomhydrograph.
Figure 8 shows the 1000 hydrographs from theconnectedscenario for the field cam-paign in Marbaix, 15 April 2009. The hydrographs cover a wide range of values, in an intermediate position between the random and the variogram coverage. The largest
5
connectivity in theconnected scenario did not result in very high modeled discharge, as thetrueand TWI scenarios still yielded the highest discharge peaks.
3.3 Evaluation of the soil moisture modelling scenarios
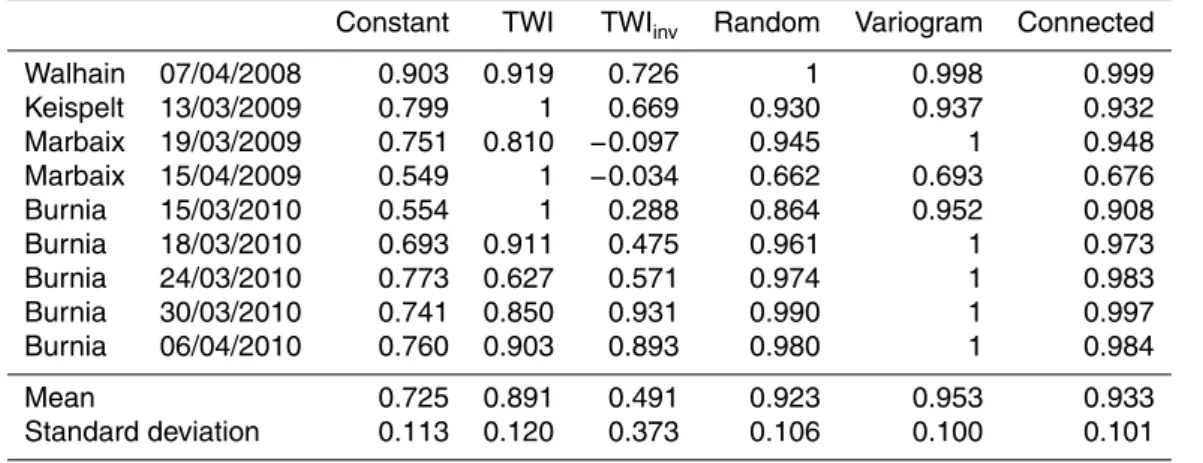
Table 4 shows normalised Nash-Sutcliffe efficiency coefficient of the comparison be-tween the different scenarios of antecedent soil moisture maps and thetruescenario,
10
for the 10 field campaigns. The hydrograph modeled with thetrue soil moisture map is assumed to be the reference hydrograph, as no measured discharges were avail-able. The Nash-Sutcliffe coefficients were normalised by dividing each coefficient by the maximal coefficient observed for each field campaign. A value of 1 means that the scenario was the best approaching thetruescenario for that field campaign. This
nor-15
malisation was set such that the average and standard deviation for each soil moisture scenario can be computed for comparing the 10 field campaigns.
The stochastic scenarios of soil moisture, i.e., therandom,variogramandconnected
scenarios equally performed between them (with a statistical confidence of 95 %) and gave on average higher Nash-Sutcliffe coefficients than the deterministic scenarios,
20
especially for thevariogram scenario. The TWI scenario performed the best for the deterministic scenarios. Neglecting the field campaign of Walsdorf, the averages of the normalised Nash coefficients of the TWI and the constant scenarios appeared significantly different, with a p-value of 0.0082. Although the constant scenario per-formed better than the TWI one in two field campaigns, i.e., Waldorf and Burnia –
25
HESSD
7, 8947–8986, 2010Effect of soil moisture variability
on the runoff
response
J. Minet et al.
Title Page
Abstract Introduction
Conclusions References
Tables Figures
◭ ◮
◭ ◮
Back Close
Full Screen / Esc
Printer-friendly Version
Interactive Discussion
Discussion
P
a
per
|
Dis
cussion
P
a
per
|
Discussion
P
a
per
|
Discussio
n
P
a
per
Figure 9 presents the Nash-Sutcliffe coefficients of the TWI scenario with respect to the true, as a function of the correlation between measured soil moisture and the TWI. The performance of the TWI scenario in approaching thetrue hydrograph (i.e., NashTWI) appeared to be related to the explaining power of the TWI for soil moisture (i.e.,rTWI,θ), with a coefficient of correlation of 0.581 between these two variables. This
5
correlation increased if we consider only field campaigns performed on the same field, e.g., the correlation rose to 0.898 when field acquisitions in Burnia only were consid-ered. The bad performance of the TWI scenario in approaching thetrue scenario for Walsdorf pointed out above can be related to its negative correlation between the TWI and measured soil moisture. Similarly, the proximity of thetrue and TWI scenarios
hy-10
drographs for Marbaix – 15 April 2009 (Fig. 4b) can be related to the largest correlation between the TWI and soil moisture that was observed for this campaign.
4 Discussions
Hydrological simulations showed a large variability of runoffresponses using different organisations of soil moisture pattern. This effect can be explained by the threshold
15
behaviour of the hydrologic model with respect to the antecedent soil moisture. At a certain soil moisture threshold, runoff is generated by infiltration excess overland flow. Introducing a spatial variability of soil moisture creates zones where the initial soil moisture is close or over this threshold and which rapidly become runoff contributing areas. The spatial location of the runoff production in the contributing areas is thus
20
controlled by the antecedent soil moisture pattern (Noto et al., 2008).
Compared to spatially constant conditions (constant scenario), spatially variable an-tecedent soil moisture patterns thus resulted in larger discharges because of the con-tributing areas that started generating runofffaster than other zones. The TWI sce-nario gave the largest discharge due to the locations of the contributing areas (i.e., the
25
HESSD
7, 8947–8986, 2010Effect of soil moisture variability
on the runoff
response
J. Minet et al.
Title Page
Abstract Introduction
Conclusions References
Tables Figures
◭ ◮
◭ ◮
Back Close
Full Screen / Esc
Printer-friendly Version
Interactive Discussion
Discussion
P
a
per
|
Dis
cussion
P
a
per
|
Discussion
P
a
per
|
Discussio
n
P
a
per
|
the TWIinvscenario, the contributing areas were far from the outlet and from the runoff
network, so the generated runoffre-infiltrated when propagated to the field outlet. The diminution of the range of hydrographs in wet conditions can be explained by the increasing size of the contributing areas with increasing mean soil moisture. In dry conditions, small contributing areas are located very close and very far from the outlet
5
for the TWI and the TWIinv scenarios, respectively. In wet conditions, the contributing
areas expand and tend to cover the whole field, and as a result, the difference between the two scenarios tends to vanish. At an extreme state of wetness, i.e., for a completely saturated soil, there would be no differences in terms of runoffbetween the two extreme scenarios.
10
The average hydrographs of the stochastic soil moisture scenarios appeared very similar (see Fig. 4). Thevariogramsoil moisture scenario gave merely higher discharge peak and volume compared to theconnectedand therandomsoil moisture scenarios. This was also found in Merz and Bardossy (1998). The small differences between the purely random and the more structured variogram and connected scenarios can be
15
explained by the large nugget effect observed in the measured soil moisture data. This resulted in a poor spatial correlation of the simulated soil moisture in bothvariogram
andconnectedmaps that looked alike therandommap, as it can be observed in Fig. 1. It was shown that a unique realization of the random scenario cannot be used to properly model the soil moisture patterns because of the large variability in the
mod-20
eled discharges. From a practical point of view, therandomscenario may suffer from the large requirement in computing resources, due to the need of several repetitions. This large variability between the realizations with the random scenario was not ob-served in Merz and Plate (1997) and Merz and Bardossy (1998). It seems that the threshold effect of soil moisture on the runoffwas stronger in our study than in these
25
HESSD
7, 8947–8986, 2010Effect of soil moisture variability
on the runoff
response
J. Minet et al.
Title Page
Abstract Introduction
Conclusions References
Tables Figures
◭ ◮
◭ ◮
Back Close
Full Screen / Esc
Printer-friendly Version
Interactive Discussion
Discussion
P
a
per
|
Dis
cussion
P
a
per
|
Discussion
P
a
per
|
Discussio
n
P
a
per
of modeled discharge but to a similar discharge in average, as compared to the ran-domscenario. The large nugget effect observed in the variograms may limit the impact of spatial coherency on predicted flow, as the simulated maps with a variogram were close to the ones made by randomly permuting the soil moisture values. In addition, it is obvious that non-conditional simulations of spatially-coherent soil moisture can yield
5
very small discharge as the simulated soil moisture patterns are not related to the to-pography which is hydrologically determinant. The poor performance of theconnected
scenario in providing extreme hydrographs was also related to the large nugget ef-fect observed for this field campaign, that limited the connectivity in the modeled soil moisture maps.
10
The second objective of this paper was to evaluate which description of the structure of the soil moisture distribution is the most appropriate for hydrologic modelling at the field scale. The averaged hydrograph of the stochastic scenarios of soil moisture (i.e.,
random,variogramandconnected) were the most similar to the hydrographs from the measured soil moisture. Nevertheless, the use of such stochastic scenarios may suffer
15
from the inherent variability in the modeled soil moisture maps, which resulted in a large variability between the particular realizations.
The TWI scenario performed the best for the deterministic scenarios and was found to be a better approach for modelling the soil moisture at a fine scale within a catchment than a spatially-averaged value (constant scenario). Moreover, from an end-user point
20
HESSD
7, 8947–8986, 2010Effect of soil moisture variability
on the runoff
response
J. Minet et al.
Title Page
Abstract Introduction
Conclusions References
Tables Figures
◭ ◮
◭ ◮
Back Close
Full Screen / Esc
Printer-friendly Version
Interactive Discussion
Discussion
P
a
per
|
Dis
cussion
P
a
per
|
Discussion
P
a
per
|
Discussio
n
P
a
per
|
5 Conclusions
We investigated the effect of the antecedent soil moisture variability on the runoff re-sponse using a distributed hydrologic model at the field scale. Ten field acquisitions of soil moisture at a high resolution were obtained using a mobile proximal GPR plat-form. Based on these soil moisture data, seven scenarios of antecedent soil moisture
5
maps were constructed with different spatial organisations. Hydrological simulations were then performed for each field acquisition with the seven antecedent soil moisture variability scenarios.
The high sensitivity of the antecedent soil moisture variability on the runoffresponse was clearly shown for all the field acquisitions. Spatially constant antecedent soil
mois-10
ture conditions (constant scenario) resulted in a lower discharge than scenarios ex-hibiting soil moisture variability, either measured (truescenario) or modeled variability. When soil moisture was arranged according to the TWI (TWI scenario), the runoff vol-ume was the largest for all the field campaigns. At the opposite, when soil moisture was inversely arranged according to the TWI (TWIinv scenario), the runoffvolume was 15
in general the lowest. Stochastic scenarios of antecedent soil moisture (i.e.,random,
variogramandconnected) gave on average similar and intermediate hydrographs, but there was a wide variability between the stochastic realizations. The observed effects of soil moisture variability on the runoff could be explained in terms of contributing areas, with respect to their sizes and their relative locations within the field.
20
The scenarios of modeled antecedent soil moisture maps were evaluated by the Nash-Sutcliffe coefficient of their hydrographs with respect to the truescenario, which was based on measured soil moisture. The average hydrograph from thevariogram
scenario was the best soil moisture modelling scenario. Yet, it is worth noting that a particular realization can perform very badly. The TWI scenario performed the best
25
HESSD
7, 8947–8986, 2010Effect of soil moisture variability
on the runoff
response
J. Minet et al.
Title Page
Abstract Introduction
Conclusions References
Tables Figures
◭ ◮
◭ ◮
Back Close
Full Screen / Esc
Printer-friendly Version
Interactive Discussion
Discussion
P
a
per
|
Dis
cussion
P
a
per
|
Discussion
P
a
per
|
Discussio
n
P
a
per
Although some particular cases were pointed out, the effects of spatial variability of soil moisture on the runoffresponse already analysed in previous studies (Merz and Plate, 1997; Merz and Bardossy, 1998; Bronstert and Bardossy, 1999) were gener-alised for various field and moisture conditions. Organising the soil moisture pattern accordingly to the TWI appeared to be a good method to model soil moisture at the
5
field scale in order to have a correct estimation of the runoff, especially if soil moisture is correlated to the TWI. These findings may be better validated against real discharge measurements or by testing other hydrologic models.
Acknowledgements. The research presented in this paper was funded by the Belgian Science
Policy Office in the frame of the Stereo II programme – project SR/00/100 (HYDRASENS). We
10
thank all the people who participated to the GPR field surveys presented in this paper.
References
Beven, K. J. and Kirkby, M. J.: A physically based, variable contributing area model of basin hydrology, Hydrolological Sciences Bulletin, 24, 43–69, 1979. 8956
Bl ¨oschl, G. and Sivapalan, M.: Scale Issues in Hydrological Modeling – A Review, Hydrol.
15
Process., 9, 251–290, 1995. 8955
Brocca, L., Melone, F., Moramarco, T., Wagner, W., Naeimi, V., Bartalis, Z., and Hasenauer, S.: Improving runoffprediction through the assimilation of the ASCAT soil moisture product, Hydrol. Earth Syst. Sci., 14, 1881–1893, doi:10.5194/hess-14-1881-2010, 2010. 8949 Bronstert, A. and B ´ardossy, A.: The role of spatial variability of soil moisture for modelling
20
surface runoffgeneration at the small catchment scale, Hydrol. Earth Syst. Sci., 3, 505–516, doi:10.5194/hess-3-505-1999, 1999. 8949, 8962, 8969
Castillo, V. M., Gomez-Plaza, A., and Martinez-Mena, M.: The role of antecedent soil water content in the runoff response of semiarid catchments: a simulation approach, J. Hydrol., 284, 114–130, 2003. 8949, 8950
25
HESSD
7, 8947–8986, 2010Effect of soil moisture variability
on the runoff
response
J. Minet et al.
Title Page
Abstract Introduction
Conclusions References
Tables Figures
◭ ◮
◭ ◮
Back Close
Full Screen / Esc
Printer-friendly Version
Interactive Discussion
Discussion
P
a
per
|
Dis
cussion
P
a
per
|
Discussion
P
a
per
|
Discussio
n
P
a
per
|
Crow, W. T., Wood, E. F., and Dubayah, R.: Potential for downscaling soil moisture maps derived from spaceborne imaging radar data, J. Geophys. Res.-Atmos., 105, 2203–2212, 2000. 8950
Famiglietti, J. S., Ryu, D., Berg, A. A., Rodell, M., and Jackson, T. J.: Field obser-vations of soil moisture variability across scales, Water Resour. Res., 44, W01423,
5
doi:10.1029/2006WR005804, 2008. 8958
Grayson, R. B., Western, A. W., Chiew, F. H. S., and Bl ¨oschl, G.: Preferred states in spatial soil moisture patterns: Local and nonlocal controls, Water Resour. Res., 33, 2897–2908, 1997. 8957, 8960
G ¨untner, A., Seibert, J., and Uhlenbrook, S.: Modeling spatial patterns of saturated
10
areas: An evaluation of different terrain indices, Water Resour. Res., 40, W05114, doi:10.1029/2003WR002864, 2004. 8961
Houser, P. R., Shuttleworth, W. J., Famiglietti, J. S., Gupta, H. V., Syed, K. H., and Goodrich, D. C.: Integration of soil moisture remote sensing and hydrologic modeling using data assim-ilation, Water Resour. Res., 34, 3405–3420, 1998. 8949
15
Huisman, J. A., Hubbard, S. S., Redman, J. D., and Annan, A. P.: Measuring soil water content with ground penetrating radar: A review, Vadose Zone Journal, 2, 476–491, 2003. 8950 Jadoon, K. Z., Lambot, S., Scharnagl, B., van der Kruk, J., Slob, E., and Vereecken, H.:
Quanti-fying field-scale surface soil water content from proximal GPR signal inversion in the time do-main, Near Surface Geophysics, 8, 483–491, doi:10.3997/1873-0604.2010036, 2010. 8951,
20
8954
Kuo, W. L., Steenhuis, T. S., McCulloch, C. E., Mohler, C. L., Weinstein, D. A., DeGloria, S. D., and Swaney, D. P.: Effect of grid size on runoffand soil moisture for a variable-source-area hydrology model, Water Resour. Res., 35, 3419–3428, 1999. 8950
Laloy, E. and Bielders, C. L.: Plot scale continuous modelling of runoff in a maize cropping
25
system with dynamic soil, surface properties, J. Hydrol., 349, 455–469, 2008. 8959
Laloy, E. and Bielders, C. L.: Modelling intercrop management impact on runoffand erosion in a continuous maize cropping system: Part I. Model description, global sensitivity analysis and Bayesian estimation of parameter identifiability, European Journal of Soil Science, 60, 1005–1021, 2009. 8959
30
HESSD
7, 8947–8986, 2010Effect of soil moisture variability
on the runoff
response
J. Minet et al.
Title Page
Abstract Introduction
Conclusions References
Tables Figures
◭ ◮
◭ ◮
Back Close
Full Screen / Esc
Printer-friendly Version
Interactive Discussion
Discussion
P
a
per
|
Dis
cussion
P
a
per
|
Discussion
P
a
per
|
Discussio
n
P
a
per
Lambot, S., Slob, E. C., van den Bosch, I., Stockbroeckx, B., and Vanclooster, M.: Modeling of ground-penetrating radar for accurate characterization of subsurface electric properties, IEEE T. Geosci. Remote., 42, 2555–2568, 2004. 8951, 8952, 8954
Lambot, S., Antoine, M., Vanclooster, M., and Slob, E. C.: Effect of soil roughness on the in-version of off-ground monostatic GPR signal for noninvasive quantification of soil properties,
5
Water Resour. Res., 42, W03403, doi:10.1029/2005WR004416, 2006a. 8953
Lambot, S., Weiherm ¨uller, L., Huisman, J. A., Vereecken, H., Vanclooster, M., and Slob, E. C.: Analysis of air-launched ground-penetrating radar techniques to measure the soil surface water content, Water Resour. Res., 42, W11403, doi:10.1029/2006WR005097, 2006b. 8951, 8952, 8954
10
Lambot, S., Binley, A., Slob, E. C., and Hubbard, S.: Ground penetrating radar in hydrogeo-physics, Vadose Zone Journal, 7, 137–139, 2008a. 8950
Lambot, S., Slob, E. C., Chavarro, D., Lubczynski, M., and Vereecken, H.: Measuring soil surface water content in irrigated areas of southern Tunisia using full-waveform inversion of proximal GPR data, Near Surface Geophysics, 6, 403–410, 2008b. 8950, 8954
15
Merz, B. and Bardossy, A.: Effect of spatial variability on the rainfall runoffprocess in a small loess catchment, J. Hydrol., 212, 304–317, 1998. 8949, 8962, 8966, 8969
Merz, B. and Plate, E. J.: An analysis of the effects of spatial variability of soil and soil moisture on runoff, Water Resour. Res., 33, 2909–2922, 1997. 8949, 8962, 8966, 8969
Minet, J., Lambot, S., Slob, E., and Vanclooster, M.: Soil surface water content estimation by
20
full-waveform GPR signal inversion in the presence of thin layers, IEEE T. Geosci. Remote., 48, 1138–1150, 2010a. 8954
Minet, J., Wahyudi, A., Bogaert, P., Vanclooster, M., and Lambot, S.: Mapping shallow soil moisture profiles at the field scale using full-waveform inversion of ground penetrating radar data, Geoderma, accepted, 2010b. 8950, 8951, 8953, 8954, 8960
25
Noto, L. V., Ivanov, V. Y., Bras, R. L., and Vivoni, E. R.: Effects of initialization on response of a fully-distributed hydrologic model, J. Hydrol., 352, 107–125, 2008. 8949, 8965
Pauwels, V. R. N., Hoeben, R., Verhoest, N. E. C., and De Troch, F. P.: The importance of the spatial patterns of remotely sensed soil moisture in the improvement of discharge predictions for small-scale basins through data assimilation, J. Hydrol., 251, 88–102, 2001. 8949
30
HESSD
7, 8947–8986, 2010Effect of soil moisture variability
on the runoff
response
J. Minet et al.
Title Page
Abstract Introduction
Conclusions References
Tables Figures
◭ ◮
◭ ◮
Back Close
Full Screen / Esc
Printer-friendly Version
Interactive Discussion
Discussion
P
a
per
|
Dis
cussion
P
a
per
|
Discussion
P
a
per
|
Discussio
n
P
a
per
|
water content, and surface conductivity on bulk soil electrical conductivity, SOIL Sci. Soc. Am. J., 40, 651–655, 1976. 8953
Robinson, D. A., Campbell, C. S., Hopmans, J. W., Hornbuckle, B. K., Jones, S. B., Knight, R., Ogden, F., Selker, J., and Wendroth, O.: Soil moisture measurement for ecological and hydrological watershed-scale observatories: A review, Vadose Zone J., 7, 358–389, 2008.
5
8950
Seibert, J. and McGlynn, B. L.: A new triangular multiple flow direction algorithm for com-puting upslope areas from gridded digital elevation models, Water Resour. Res., 43, doi:10.1029/2006WR005128, 2007. 8961
Serbin, G. and Or, D.: Ground-penetrating radar measurement of crop and surface water
con-10
tent dynamics, Remote Sens. Enviro., 96, 119–134, 2005. 8950
Sørensen, R., Zinko, U., and Seibert, J.: On the calculation of the topographic wetness index: evaluation of different methods based on field observations, Hydrol. Earth Syst. Sci., 10, 101–112, doi:10.5194/hess-10-101-2006, 2006. 8957, 8961
Tarboton, D. G.: A new method for the determination of flow directions and upslope areas in
15
grid digital elevation models, Water Resour. Res., 33, 309–319, 1997. 8961
Topp, G. C., Davis, J. L., and Annan, A. P.: Electromagnetic Determination of Soil Water Con-tent: Measurements in Coaxial Transmission Lines, Water Resour. Res., 16, 574–582, 1980. 8953
Vereecken, H., Kamai, T., Harter, T., Kasteel, R., Hopmans, J., and Vanderborght, J.: Explaining
20
soil moisture variability as a function of mean soil moisture: a stochastic unsaturated flow perspective, Geophys. Res. Lett., 34, L22402-1-6, doi:10.1029/2007GL031813, 2007. 8958 Vereecken, H., Huisman, J. A., Bogena, H., Vanderborght, J., Vrugt, J. A., and Hopmans, J. W.: On the value of soil moisture measurements in vadose zone hydrology: A review, Water Resour. Res., 44, W00D06, doi:10.1029/2008WR006829, 2008. 8950
25
Wagner, W., Bl ¨oschl, G., Pampaloni, P., Calvet, J. C., Bizzarri, B., Wigneron, J. P., and Kerr, Y.: Operational readiness of microwave remote sensing of soil moisture for hydrologic applica-tions, Nordic Hydrology, 38, 1–20, 2007. 8950
Weiherm ¨uller, L., Huisman, J. A., Lambot, S., Herbst, M., and Vereecken, H.: Mapping the spatial variation of soil water content at the field scale with different ground penetrating radar
30
techniques, J. Hydrol., 340, 205–216, 2007. 8950, 8954
HESSD
7, 8947–8986, 2010Effect of soil moisture variability
on the runoff
response
J. Minet et al.
Title Page
Abstract Introduction
Conclusions References
Tables Figures
◭ ◮
◭ ◮
Back Close
Full Screen / Esc
Printer-friendly Version
Interactive Discussion
Discussion
P
a
per
|
Dis
cussion
P
a
per
|
Discussion
P
a
per
|
Discussio
n
P
a
per
Western, A. W., Bl ¨oschl, G., and Grayson, R. B.: Geostatistical characterisation of soil moisture patterns in the Tarrawarra a catchment, J. Hydrol., 205, 20–37, 1998. 8958
Western, A. W., Grayson, R. B., Bl ¨oschl, G., Willgoose, G. R., and McMahon, T. A.: Observed spatial organization of soil moisture and its relation to terrain indices, Water Resour. Res., 35, 797–810, 1999. 8951, 8955, 8957
5
Zehe, E. and Bl ¨oschl, G.: Predictability of hydrologic response at the plot and catchment scales: Role of initial conditions, Water Resour. Res., 40, W10202, doi:10.1029/2003WR002869, 2004. 8950
Zehe, E., Becker, R., Bardossy, A., and Plate, E.: Uncertainty of simulated catchment runoff re-sponse in the presence of threshold processes: Role of initial soil moisture and precipitation,
10
J. Hydrol., 315, 183–202, 2005. 8949
Zehe, E., Graeff, T., Morgner, M., Bauer, A., and Bronstert, A.: Plot and field scale soil mois-ture dynamics and subsurface wetness control on runoffgeneration in a headwater in the Ore Mountains, Hydrol. Earth Syst. Sci., 14, 873–889, doi:10.5194/hess-14-873-2010, 2010. 8949
15
HESSD
7, 8947–8986, 2010Effect of soil moisture variability
on the runoff
response
J. Minet et al.
Title Page
Abstract Introduction
Conclusions References
Tables Figures
◭ ◮
◭ ◮
Back Close
Full Screen / Esc
Printer-friendly Version
Interactive Discussion
Discussion
P
a
per
|
Dis
cussion
P
a
per
|
Discussion
P
a
per
|
Discussio
n
P
a
per
|
Table 1.Presentation of the 10 GPR acquisitions in agricultural fields.