Article
0103 - 5053 $6.00+0.00*e-mail: [email protected]
Isolation and Quantification of Dialkylmercury Species by Headspace
Solid Phase Microextraction and Gas Chromatography
with Atomic Emission Detection
Ana M. Oliveira
,
aGilmare A. Silva
,
bRonei J. Poppi
band Fabio Augusto*
,baDepartamento de Ciências Naturais e Tecnologia, Universidade Estadual de Santa Cruz,
45662-000 Ilhéus-BA, Brazil
bInstituto de Química, Universidade Estadual de Campinas, CP 6154, 13084-971 Campinas-SP, Brazil
Foi desenvolvida uma metodologia para quantificar compostos dialquilmercúricos usando Microextração em Fase Sólida em Headspace (HS-SPME) e Cromatografia Gasosa com Detecção por Emissão Atômica (GC-AED). Os parâmetros para detecção de Hg foram otimizados usando planejamento fatorial e superfícies de resposta. Experimentos univariados foram empregados para determinar as condições de HS-SPME; as melhores fibras foram 75 Mm de Carboxen / PDMS e 65 Mm de PDMS / DVB. Porém, as primeiras foram descartadas pela extensa degradação térmica dos analitos na dessorção. O procedimento otimizado permite detectar os analitos em amostras aquosas com limite de detecção de 1,7 e 0,2 ng L-1 para dimetil- and dietilmercúrio, respectivamente. As curvas analíticas são lineares nas faixas de 36 a 180 ng L-1 (Me
2Hg) e 38 a 190 ng L -1 (Et
2Hg), com limite de quantificação de 38 ng L-1 (Me
2Hg) e 29 ng L -1 (Et
2Hg) e coeficientes de correlação de 0,998 para Me2Hg e 0,999 para Et2Hg.
A methodology to quantify dialkylmercury compounds using Headspace Solid Phase Micro-extraction (HS-SPME) and Gas Chromatography with Atomic Emission Detection (GC-AED) was developed. The parameters for Hg detection were optimized by factorial design and response surfaces. Univariate experiments were employed to determine the HS-SPME conditions; 75 Mm Carboxen / PDMS and 65 Mm PDMS / DVB were the best fibers. However, the former was exclu-ded from further experiments due to extensive thermal degradation of analytes during desorption. The optimized procedure allowed detection of the analytes from aqueous samples with LOD of 1.7 ng L-1 and 0.2 ng L-1 for dimethyl- and diethylmercury, respectively. The analytical curves are linear in the range from 36 to 180 ng L-1 (Me
2Hg) and 38 to 190 ng L -1 (Et
2Hg), with LOQ of 38 ng L-1 (Me
2Hg) and 29 ng L -1 (Et
2Hg) and correlation coefficients of 0.998 for Me2Hg and 0.999 for Et2Hg.
Keywords: HS-SPME, GC-AED, dimethylmercury, diethylmercury, factorial design
Introduction
Microorganisms can convert Hg+2 into organomercury
compounds such as methylmercury, (CH3)Hg+, and
dimethylmercury, (CH3)2Hg. These species are among the most dangerous environmental contaminants. Concentrations as low as 0.04 Mg L-1 of methylmercury
have been reported to be harmful to some species, and organomercuric species can be up to hundred times more toxic than the inorganic forms.1 Therefore, proper assessment
of environmental mercury contamination demands sensitive and selective analytical methods capable of speciating the
several possible forms of this metal. Although procedures involving selective reduction of the analytes, coupled to detection techniques such as CV-AAS (Cold Vapor - Atomic Absorption Spectrometry), have been employed,2
methodologies involving chromatographic separation of the Hg species by HPLC,3 CE4or, more frequently, GC5
are more usual. Traditionally, the ECD was the detector of choice;6 however, since it is not specific for organomercury
compounds, more recently devices such as the Atomic Emission Detector (AED)7 have been favored. Compared
to the ECD and other spectroscopic chromatographic detectors, AED has a remarkably higher sensitivity for organometallic compounds.8 However, especially for
the GC-AED operational conditions has to be done: e.g., the He plasma support gas has to be simultaneously mixed with oxygen (to eliminate carbon deposits in the discharge tube generated from the fragmentation of organic eluates)9
and hydrogen (to prevent the build-up of refractory metal oxides, causing peak tailing, loss of sensitivity and memory effects).10 The overall procedure for GC-AED optimization
can be complex and time-consuming, considering the number of parameters (helium flow, pressures of the oxygen and hydrogen gases mixed into the plasma and the temperatures of transfer line and the plasma cavity) and the possible interdependence between these parameters (which demand multivariate optimization strategies).
Since some of the target species (especially CH3Hg+)
are ionic, their conversion to volatile non-ionic derivatives is necessary before their separation and detection by GC.5
Also, isolation from the matrix and pre-concentration of the organomercuric compounds and their derivatives is necessary for their determination. Although the derivatization can be performed via Grignard reactions,11
simpler alkylation procedures using sodium tetraethyl-, tetrapropyl- or tetraphenylborate are presently preferred since they can be carried out directly in aqueous matrixes.12
However, conditions such as: nature and concentration of the alkylating agent, solution pH, ionic strength of reaction media, reaction time and temperature13 should
be optimized to achieve quantitative and reliable results. As for the isolation of organomercury compounds and their derivatives from aqueous and biological samples, Solid Phase Microextraction (SPME) can be regarded as one of the best available choices due to its inherent speed and reliability.14,15 Several operational variables
also should be studied for the optimization of SPME procedures – extraction mode, nature of extracting fiber coating and others.16 Some of the variables affecting
the performance of SPME – such as temperature and media ionic strength – also influence the course of the derivatization process. In most of the recent procedures for determination of organomercury species the derivatization and extraction steps are simultaneously optimized and carried out.17 However, considering the
different physico-chemical processes involved in these steps, both direction and magnitude of the operational variable effects, common to both, can be radically different and their execution in parallel can reduce overall method sensitivity and precision. Consequently, separate extraction optimization and derivatization parameters can lead to a expressive improvement on the resulting complete analytical methodology. Therefore, in this work the conditions for headspace extraction by SPME of two neutral organomercury species – dimethyl- (Me2Hg) and
diethylmercury (Et2Hg) – were established by univariate process while their detection by GC-AED was also optimized, employing a multivariate approach.
Experimental
Gas Chromatograph
GC-AED system was a HP-6850 gas chromatograph equipped with a G-2350A Atomic Emission Detector (Agilent Technologies, Wilmington, DE, USA) and fitted with a 25 m r 0.32 mm r 0.17 Mm HP-1 capillary column and a HP-7683 automated injector (Agilent). Helium was used both as carrier (1.8 mL min-1) and plasma support
(make-up) gas; high purity hydrogen and oxygen were also used as plasma doping gases. GC-AED chromatograms were obtained monitoring the 253.65 nm Hg emission line. For the optimization of the AED operation, the oven temperature was programmed from 45 °C to 100 °C at 5 °C min-1. For
these experiments, direct injection (using the automated injector) of 0.2 ML (split ratio of 1:20) of alkylmercury solutions was used, with the injector kept at 260 °C. For the manual SPME analysis, the injector was operated in splitless mode for 5 min, and then purged with helium at 150 mL min-1. During GC-AED optmization studies, the
injector temperature was preliminarly set to 230 °C and the desorption time was 5 min. For the HS-SPME optimization, the injector temperature was varied from 150 °C to 260 °C; 150 °C was selected for the remainder experiments. The oven temperature was programmed as follows: 2 min at 45 °C, then heated at 20 °C min-1 up to 105 °C.
Chemicals and materials
Acetone solutions (6 Mg mL-1) of Me
2Hg and Et2Hg
(Alpha Products, Houston, TX) were used for the AED optimization experiments. Analytical grade NaCl and acetone (Synth Química, Rio de Janeiro, Brazil) were also employed. The SPME fibers: 100 Mm PDMS (P100), 85Mm polyacrylate (PACR), 65 Mm PDMS / DVB (DVB) and 75Mm Carboxen / DVB (CAR) and the holder for manual operation were all purchased from Supelco (Bellefont, PA, USA). Prior to use, the fibers were conditioned according to supplier’s recommendations. All extractions were performed with the samples contained in 16 mL septum-sealed glass vials (Supelco), and under 1200 rpm magnetic agitation.
Optimization of the GC-AED system for mercury detection
pressures of plasma doping oxygen (pO2) and hydrogen (pH2); temperatures of transfer line (TTL) and plasma cavity (TPC) of the GC-AED for mercury detection. Triplicate injections of dialkylmercury standard solutions under varied operational conditions arranged according to a 25
factorial design experiment were carried out. The values for the parameters were: FHe = 130 and 200 mL min-1;p
02 =
30 and 50 psi; pH2 = 10 and 20 psi; TTL and TPC = 230 °C and 280 °C. S/N ratios both for Me2Hg and Et2Hg peaks in all runs were defined as the response, and the effects of the variables were calculated using Matlab 6 (Mathworks Inc., Natick, MA, USA). Additional experiments were carried out to plot a S/N × FHe × pO2 surface response to further assess the optimum values for these two variables.
HS-SPME method for dialkylmercury compounds
Conventional univariate studies were carried out to select the best SPME fiber, the desorption temperature and time, extraction temperature, ionic strength of the extracting media and extraction time. All experiments were performed in triplicate. To select the best fiber for the further experiments, 5 mL of a 6 ng mL-1 solution of
the test compounds contained in 16 mL septum-sealed vials was stirred at ambient temperature for 5 min for sample/headspace equilibration. After the pre-equilibration a SPME fiber was exposed to the vial headspace for 10 min, and the extracted analytes were immediately desorbed and analyzed by GC-AED. The effect of the desorption temperature was assessed for DVB and CAR fibers using the same procedure, but with injector temperatures ranging from 150 °C to 260 °C. To study the effect of sample temperature, extractions of the test solution with DVB fiber and temperatures of 25 °C, 45 °C and 60 °C were carried out. The effect of the extracting media ionic strength was assessed using extractions with DVB fibers under the same conditions, but using as solvent for the test samples NaCl solutions with concentrations up to 36% m/v. Finally, the
extraction profiles for Me2Hg and Et2Hg were evaluated with DVB extractions of test samples containing 9% NaCl over the time range between 3 min and 45 min.
Sensitivity, precision and limits of detection and quantitation for Me2Hg and Et2Hg were calculated with analytical curves estimated using extractions of test samples with concentrations ranging from 36 ng L-1 to 180 ng L-1
(Me2Hg) and 38 ng L-1 to 190 ng L-1 (Et
2Hg) under the
optimized GC-AED and HS-SPME conditions (GC-AED:
FHe = 154 psi mL min-1;p
02 = 24 psi; pH2 = 10 psi; TTL and TPC = 230 °C; HS-SPME: 15 min extraction with DVB fiber at 25 °C and injector temperature of 150 °C).
Results and Discussion
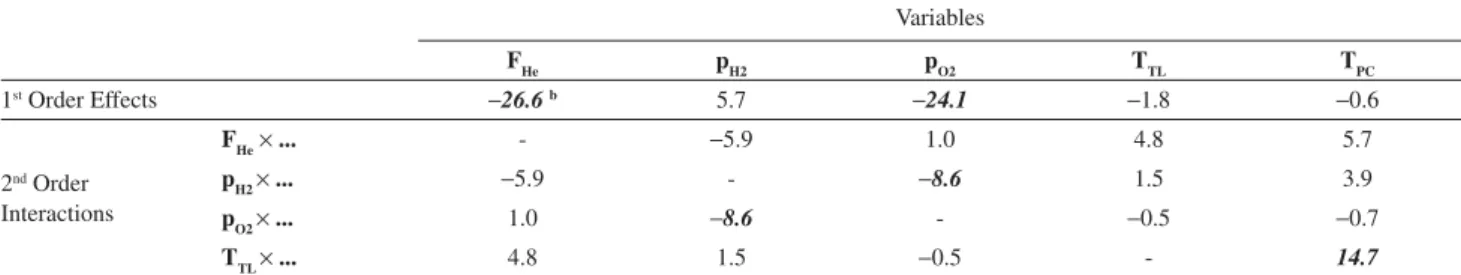
Table 1 shows the effects of the studied operational variables (FHe,pO2,pH2,TTLand TPC) on the S/N ratios measured for the Et2Hg chromatographic peak, obtained after processing the factorial design experiment. Since the behavior and tendencies observed for Me2Hg were equivalent to those of Et2Hg, only the data and results for the later will be presented and discussed here. The second-order interactions between these variables are also shown in this table. To simplify the discussions, larger-order interactions were not considered. Adopting 95% as the confidence level, only the effects of F
He (26.6) and p02 (24.1) on the S/N
ratios were significant. As they are negative, this indicates that the S/N ratio increase when FHe and pO2 are reduced in the studied range. As for the other variables, their effects were not representative and therefore they were fixed at the lower level for the remainder of this study. The presence of some statistically significant 2nd order interactions
(pH2r pH2 and TTLr TPC) confirms the necessity of multivariate approaches for optimization of operational conditions in GC-AED systems, since they indicate that these variables do not act independently on the response.
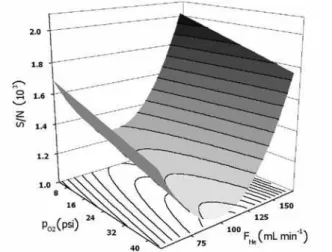
To determine the optimum values of FHe and p02, additional experiments were performed and the results
Table 1. Effects of helium make-up flow (FHe / mL min
-1), pressure of oxygen (p
O2 / psi), pressure of hydrogen (pH2/ psi), temperature of transfer line (TTL/ °C) and temperature of plasma cavity (TPC/ °C) on the GC-AED S/N ratio for Hg and second-order interactions
a of these variable measured after
factorial design experiments
Variables
FHe pH2 pO2 TTL TPC
1st Order Effects 26.6b 5.7 24.1 1.8 0.6
2nd Order
Interactions
FHer ... - 5.9 1.0 4.8 5.7
pH2r ... 5.9 - 8.6 1.5 3.9
pO2r ... 1.0 8.6 - 0.5 0.7
TTLr ... 4.8 1.5 0.5 - 14.7
obtained fitted to a S/Nr FHer pO2 response surface. This response surface is shown in Figure 1. The S/N ratio is maximized with lower pressures of O2 added to the plasma. For the He make-up flow, the dependence is more complex and there is a minimum for FHey 100 mL min-1; better S/N
ratios are obtained either with higher or lower He flows. Since the mechanism of signal generation in GC-AED is extremely complex,18 justification of these tendencies in
terms of possible processes occurring in the plasma zone is impracticable. For the remaining experiments, p02 was lowered only to 24 psi. Although better S/N ratios are attainable using lower pressures of oxygen, during routine operation it was observed that this causes a substantial reduction of the lifetime of the detection cells, due to the build-up of carbonaceous deposits. For FHe,154 mL min-1
was selected, to simultaneously maximize the S/N ratio and the detection cell lifetime (which is also reduced with low He make-up flows).
Figure 2 compares the average peak areas obtained after extractions using different SPME fibers. For both compounds, the order of extraction efficiency is PACR << P100 < DVB < CAR. This particular sequence can be explained in terms of both the polarity and the volatility of the analytes. Dialkylmercury compounds are non-polar species; their affinity with a polar coating such as polyacrylate is expected to be low, which is confirmed by the limited extraction efficiency with this fiber. In contrast, the extracted amounts are substantially higher for P100 fibers, due to the non-polar coating (polydimethylsiloxane) of this fiber; which up to the present has been the fiber most frequently employed for extractions of the alkylmercury compounds.19-21 Higher efficiencies are possible with the
DVB and CAR fibers. Since the coatings of these fibers are
dispersions of solids (divinylbenzene and Carboxen 1006, respectivelly) in polydimethylsiloxane, both adsorption and partition occurs during the extraction.22 For all fibers
except CAR, extraction efficiency for Et2Hg was higher than that of Me2Hg. Since the CAR fiber is selective for lighter, more volatile analytes, the improvement on the extracted amounts for Me2Hg was expected. Considering their improved extraction efficiencies towards the analytes, both CAR and DVB fibers were selected for the further experiments.
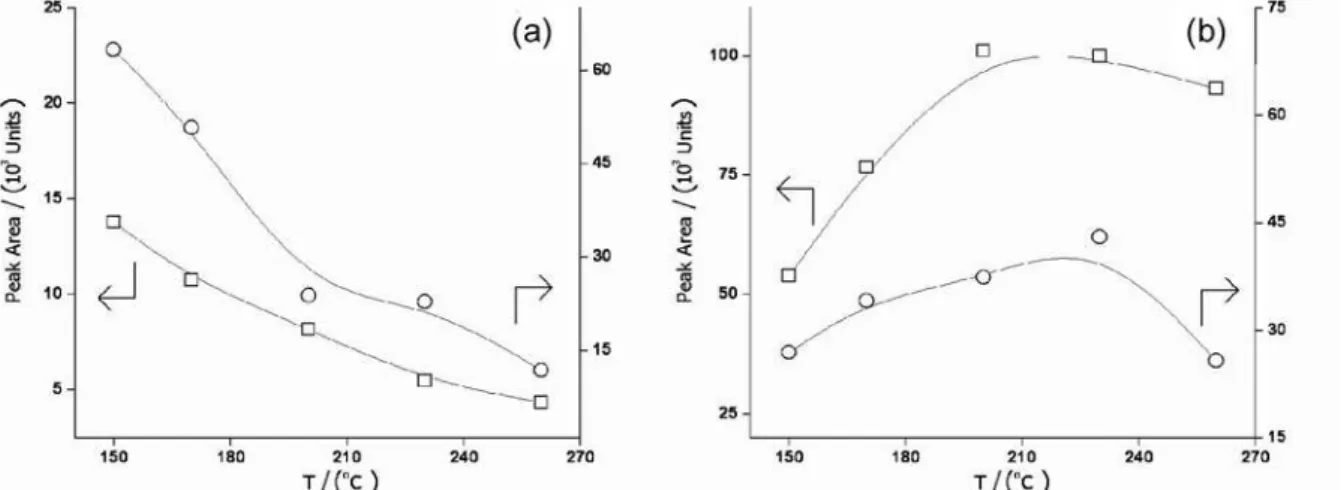
The necessity of careful optimization of injector temperatures for chromatographic analyses of organomercury compounds is well known, since these analytes are thermally labile.23 The effect of desorption
temperature on the peak areas is shown in Figures 3 and 4. The pattern of the variation of peak area of the analytes with the desorption temperature for DVB fibers is different from that of CAR: for both analytes on DVB, increasing the temperature causes a linear decrease in the peak areas. For CAR, the peak areas are maximized with desorption temperatures of ca. 220 °C. Some additional information can result from inspection of the chromatograms shown in Figure 4. The main feature of these chromatograms is the presence of peaks with tRy 1.40 min, which are attributed to decomposition products of the dialkylmercury species (mainly Hg0).24 Comparing the chromatograms
obtained with desorption temperature of 150 °C, it can be seen that the decomposition peak is barely visible for DVB fiber, although it is still intense for CAR fibers. For higher injector temperatures, decomposition peaks appear for both fibers, being the more intense in the DVB chromatogram, and with a height similar to the Me2Hg peak in the CAR chromatogram. These observations suggest that the thermal degradation of dialkylmercury Figure 1. Response surface (S/N × pO2 × FHe) for the Et2Hg chromatographic
peak.
compounds is enhanced when they are adsorbed over the fiber coatings. Decomposition of R2Hg species adsorbed over carbon-based materials has already been described in the literature.25For CAR, even at the comparatively low
temperature of 150 °C artifact peaks already appear; the increase in the peak areas of the dialkylmercury compounds observed up to ca. 220 °C can be regarded as a result of improved desorption of the extracted analytes which, in that temperature range, seems to exceed the loss of adsorbed R2Hg caused by thermal decomposition. Compared to CAR, adsorption and desorption from DVB fibers is faster26 and
the improvement on the desorption rate with temperature is expected to be marginal. Therefore, the only visible effect of higher desorption temperature on DVB is an increase on the rate of thermal degradation. Finally, from Figure 4 an expressive peak tailing on the chromatograms corresponding to CAR fibers is also evident for all studied
desorption temperatures. This is the usual situation when these fibers are employed27 and it is also a consequence
of the previously mentioned slow desorption of extracted materials. In view of the absence of significant thermal decomposition, DVB fibers were selected for the remaining experiments, even considering the higher extraction efficiency of CAR, especially towards Me2Hg. The injector temperature was set to 150 °C, to avoid loss of analytes by thermal decomposition.
As for the dependence between extraction temperature and extraction efficiency, it was observed that the efficiency decreases with the temperature. In the range between 25 °C and 60 °C, the peak areas were reduced in 81% (Me2Hg) and 73% (Et2Hg). Higher temperatures lead to an increase the speed of transfer of volatile analytes from the sample to the headspace, but simultaneously the fiber coating/headspace distribution constant is reduced,28 causing
Figure 3. Dependence between peak areas and desorption temperature for Me2Hg ({) and Et2Hg ( ), after HS-SPME using DVB (a) and CAR (b) fibers.
for the observed behaviour. Therefore, all remaining work was carried out at the laboratory temperature, (25 o 1) °C. The effect of different NaCl concentrations in the extracting media is shown in Figure 5. For Et2Hg, the extraction efficiency is roughly constant up to 18% NaCl, decreasing for more saline media; for Me2Hg, efficiency peaks at 9% NaCl. The usual behavior in HS-SPME, especially for non-polar analytes such as dialkylmercury compounds, is a constant increase of the extraction efficiency with the NaCl concentration.28 The different effect of NaCl concentration
seen here was already been reported for SPME,29 but was
attributed to the quenching of the derivatization process, ethylation. The appearance of a similar effect here shows that an excessive NaCl concentration in the media can also reduce the extraction efficiency, independent of its effect upon the alkylation of organomercury species. This effect can be attributed to the possible formation of ionic, non-volatile and stable complexes between the R2Hg species and chloride ions.30 Higher concentrations of NaCl would
shift the reaction equilibrium towards the formation of the complex, decreasing the concentration of free extractable dialkylmercury species. Considering the observed profiles, 9% NaCl was added to the extracting media for the remainder of this work. Extraction time profiles obtained for HS-SPME of dialkylmercury solutions containing 9% NaCl revealed that equilibrium is reached after ca. 15 min extraction for Me2Hg and between 20 min and 30 min for Et2Hg. However, for practical reasons, since the increase in the area of the later after 15 min is negligible, 15 min was adopted as the extraction time.
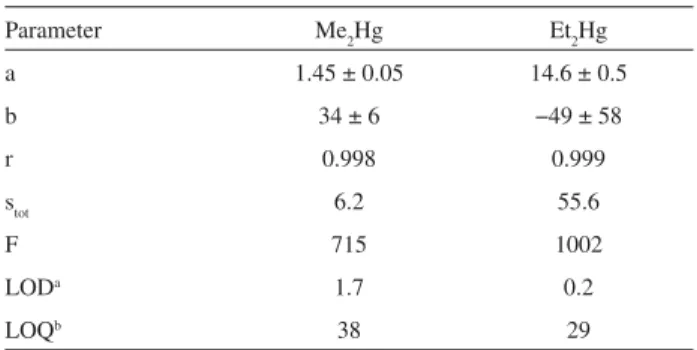
The sensitivity, precision and detectability for R2Hg quantitation using the optimized extraction and detection
method can be evaluated from the data presented on Table 2. The precision for both analytes in the concentration range studied, expressed as the regression coefficients of the analytical curves, can be regarded as adequate (r = 0.998 for Me2Hg and 0.999 for Et2Hg). The F-values for the regression lines, 715 and 2002, respectively, are higher than the 95% significance critical value of 19.2, confirming the linearity of the data in this range. The limits of detection and quantitation, 1.7 ng(Hg) L-1 for Me
2Hg
and 0.2 ng(Hg) L-1 for Et
2Hg, are adequate for application
to most of the environmental or clinical samples29 and in
general better than figures reported for similar studies regarding determination of Hg species in water samples:32
e.g., 412 Mg(Hg) L-1 (diphenylmercury using
SPME-HPLC-UV); 3.1 ng(Hg) L-1 (methylmercury using SPME-GC-MS)
and 3.7 ng(Hg) L-1 (generic alkylmercury using
SPME-GC-ICPMS).
Conclusions
Headspace SPME together with GC-AED was found to be specially suited for isolation, separation and detection of dialkylmercury compounds. The optimization of the operational parameters affecting the AED operation for Hg detection provided a significant enhancement of the sensitivity and detectability for this element. Coupled with HS-SPME, this technique is able to detect and quantify amounts of these analytes in the ng L-1 range. As for the
HS-SPME method, use of PDMS-DVB fibers provide a significant enhancement of the sensitivity, compared to the PDMS fibers usually employed. The thermal instability of these species point to the need of a careful optimization of the extraction parameters, notably the desorption temperature and time.
Figure 5. Dependence between peak areas and NaCl concentration in the samples for Me2Hg ({) and Et2Hg ( ), after HS-SPME using DVB fibers.
Table 2. Figures of merit for the determination of R2Hg using the opti-mized HS-SPME / GC-AED method: slopes a, intercepts b, correlation coefficients r and regression standard errors stot of the analytical curves, corresponding regression F-test parameter F and absolute limits of detec-tion LODaand quantitation LOQb, in ng(Hg) L-1
Parameter Me2Hg Et2Hg
a 1.45 ± 0.05 14.6 ± 0.5
b 34 ± 6 −49 ± 58
r 0.998 0.999
stot 6.2 55.6
F 715 1002
LODa 1.7 0.2
LOQb 38 29
aEstimated from signal-to-noise (S/N) ratio and defined as the
concen-tration of analyte generating a peak with height equal to 3 × (S/N)31; bEstimated from the regression data and defined as 10 × s
tot / a.
Acknowledgments
This work was funded by the Fundação de Amparo à Pesquisa do Estado de São Paulo (FAPESP). Scholarships for A.M.O and G.A.S. were granted by the Conselho Nacional de Desenvolvimento Científico e Tecnológico (CNPq).
References
1. Boening, D. W.; Chemosphere2000,40, 1335.
2. Limaverde Filho, A. M.; Campos, R. C.; Quim. Nova1999,22, 477.
3. Evans, O.; McKee, G. D.; Analyst1987,112, 983.
4. Carro-Dıaz, A. M.; Lorenzo-Ferreira, R. A.; Cela-Torrijos, R.;
J. Chromatogr. A1996,730, 345.
5. Morita, M.; Yoshinaga, J.; Edmonds, J. S.; Pure Appl. Chem.
1998,70, 1585.
6. Westlöö, G.; Acta Chim. Scand.1968,22, 2277.
7. Pereiro, I. R.; Diaz, A. C.; Anal. Bioanal. Chem.2002,372, 74.
8. Paneli, M.; Rosenberg, E.; Grasserbauer, M.; Ceulemans, M.; Adams, F.; Fresenius J. Anal. Chem.1997,357, 756. 9. Valente, A. L. P.; Uden, P. C.; J. High Resolut. Chromatogr.
1993,16, 275.
10. Lobinski, R.; Dirkx, W.M.R.; Ceulemans, M.; Adams, F. C.;
Anal. Chem.1992,64, 159.
11. Estes, S. A.; Uden, P. C.; Barnes, R. M.; Anal. Chem.1982,54, 2402.
12. Minganti, V.; Capelli, R.; de Pellegrini, R.; Fresenius J. Anal.
Chem.1995,351, 471.
13. Grinberg, P.; Campos, R. C.; Mester, Z.; Sturgeon, R. E.; J.
Anal. At. Spectrom.2003,18, 902.
14. Mester, Z.; Sturgeon, R.; Pawliszyn, J.; Spectrochim. Acta B
2001,56, 233.
15. Rodil, R.; Carro, A. M.; Lorenzo, R. A.; Abuın, M.; Cela, R.;
J. Chromatogr. A2002,963, 313.
16. Pini, G. F.; Brito, E. S.; García, N. H. P.; Valente, A. L. P.; Augusto, F.; J. Braz. Chem. Soc.2004,15, 267.
17. Carro, A. M.; Neira, I.; Rodil, R.; Lorenzo, R. A.;
Chromatographia2002,56, 733.
18. Risby, T. H.; Talmi, Y.; CRC Crit. Rev. Anal. Chem.1983,14, 231.
19. Botana, J. C.; Rodríguez, R. R.; Díaz, A. M. C.; Ferreira, R. A. L.; Torrijos, R. C.; Pereiro, I. R.; J. Anal. At. Spectrom.2002,
17, 904.
20. Dıez, S.; Bayona, J. M.; J. Chromatogr. A2002,963, 345. 21. Tutschku, S.; Schantz, M. M.; Wise, S. A.; Anal. Chem.2002,
74, 4694.
22. Mani V. In Applications of Solid Phase Microextraction; Pawliszyn, J., ed.; RSC: Cambridge, 1999, ch. 5.
23. Bloom, N. S.; Colman, J. A.; Barber, L.; Fresenius J. Anal. Chem.1997,358, 371.
24. Waring, C. E.; Pellin, R.; J. Phys. Chem.1967,71, 2044. 25. Liang, L.; Horvat, M.; Bloom, N. S.; Talanta1994,41, 371. 26. Górecki, T.; Yu, X.; Pawliszyn, J.; Analyst1999,124, 643. 27. Oliveira, A. M.; Pereira, N. R.; Marsaioli Jr., A.; Augusto, F.;
J. Chromatogr. A2004,1025, 115.
28. Valente, A. L. P.; Augusto, F.; Quim. Nova2000,23, 523. 29. Cai, Y; Bayona, J. M.; J. Chromatogr. A1995,696, 113. 30. Sinha, S. P.; Inorg. React. Mech.2000,2, 33.
31. Ribani, M.; Bottoli, C. B. G.; Collins, C. H., Jardim, I. C. S. F.; Melo, L. F. C.; Quim. Nova2004,27, 771.
32. Gbatu T. P.; Sutton K. L., Caruso J. A.; Anal. Chim. Acta1999,
402, 67; Centineo, G.; González, E. B.; Sanz-Medel, A.; J. Chromatogr. A2004,1034, 191; De Smaele, T.; Moens, T.; Sandra, P.; Dams, R.; Mikrochim. Acta1999,130, 241.
Received: September 19, 2007 Web Release Date: June 13, 2008