Article
Printed in Brazil - ©2015 Sociedade Brasileira de Química0103 - 5053 $6.00+0.00
A
*e-mail: [email protected]
Dispersive Liquid-Liquid Microextraction with Liquid Chromatography-Tandem
Mass Spectrometry for the Determination of Triazine, Neonicotinoid, Triazole and
Imidazolinone Pesticides in Mineral Water Samples
Cátia M. Bolzan, Sergiane S. Caldas, Bruno S. Guimarães and Ednei G. Primel*
Laboratório de Análises de Compostos Orgânicos e Metais, Escola de Química e Alimentos, Universidade Federal do Rio Grande, 96203-900 Rio Grande-RS, Brazil
Mineral water is known for its high purity. Because mineral water is produced by the infiltration of water through the soil, there is the possibility of contamination with pesticides. The aim of this study was to develop a simple, rapid and efficient method for the extraction and preconcentration of different classes of pesticides in mineral water samples by dispersive liquid-liquid microextraction (DLLME) coupled with liquid chromatography tandem mass spectrometry. To optimize the DLLME conditions for the different classes of pesticides and access the effect of variables on the extraction, a central composite design (CCD) with a five-level fractional factorial design was used for the construction of a second order response surface model (RSM). The limits of quantification were
between 0.005 and 0.5 µg L-1. Correlation coefficients (r) were higher than 0.999. Recoveries ranged
from 102 to 120%, with relative standard deviations between 1 and 10%. Low matrix effect for all compounds was observed. The result showed that using a mixture of acetone and acetonitrile as disperser solvent and a mixture of chloroform and monochlorobenzene as extractor solvent, it is possible to employ the traditional DLLME with chlorinated solvents to extract the multiclass pesticides from the water samples.
Keywords: dispersive liquid-liquid microextraction, multiclass pesticides, sample preparation,
mineral water samples
Introduction
The quality of surface water is affected by several types of contamination. The development of agriculture has significantly affected natural resources, including surface water, mainly through the application of pesticides.1 Due to
the environmental conditions and the their physicochemical properties, pesticides can leach through the soil reaching groundwater such as mineral water.2
Due to the pollution of surface water, currently, mineral water is even more relevant as a source of water for human consumption. Moreover, mineral water has some medicinal properties that make it advantageous in comparison to surface water, i.e., it is naturally enriched with salts that provide benefits to human health.3
Once mineral water samples are formed through the water infiltration in the soil, pollution by pesticides can occur, which deserves investigation. To extract the compounds from mineral waters, efficient sample
preparation techniques able to quantify organic compounds at low concentration levels in environmental samples are desirable.4 For a long time, solid phase extraction (SPE)
has been the most employed technique for the isolation and preconcentration of pesticides from water samples.5,6
However, new sample preparation techniques have been proposed, aiming for faster and simpler methods that consume less solvent. Therefore, in 2006, the dispersive liquid-liquid microextraction (DLLME) technique was developed.7
The basic principle of DLLME is the dispersion of an extraction solvent (immiscible with water) and a disperser solvent (miscible in water and extraction solvent) in an aqueous solution that provides a large contact area between the aqueous phase and the extraction solvent.7 The main
DLLME has been widely used for the determination of organic compounds in aqueous matrices.9,10 However, due
to the versatility of the technique, it has also been used for the determination of pesticide residues in other matrices such as in human plasma,11 fruits,12 honey,13 and wine.14
However, with the advance of the technique, many modifications have emerged that attempt to make it more robust. Modifications have been published that include solvents less dense than water to allow dispersive liquid-liquid microextraction through the solidification of floating organic droplets (DLLME-SFO),15-17
ultrasound-assisted (USAEME) DLLME,18 ultrasound-assisted
DLLME with solidification of floating organic droplets (USAEME-SFO),19 and modifications employing ionic
liquids (IL), such as in IL-DLLME.20
However, despite the considerable development of sample preparation techniques achieved in recent years, multiresidue methods using microextraction techniques are difficult to develop because compounds that have different physicochemical properties must be extracted simultaneously. There are some few references in the literature about the extraction of multiclass of pesticides from water using DLLME.21-24 Due to the wide range of
pesticides that are commercialized, one of the requirements of the current techniques for sample preparation should be to extract a wide range of organic contaminants simultaneously. Moreover, multiresidue methods have the main advantage of reducing the cost and time compared to methods that extract a single class of pollutants.
In DLLME, various parameters have influence in the extraction efficiency, such as the volume of extraction, disperser solvent and the pH can be optimized through the use of response surface methodology (RSM).25
Therefore within the current context of developing more efficient methods in analytical chemistry that include lower solvent consumption and high enrichment factors, this study aims at develop a method for the simultaneous extraction of multiclass pesticides from mineral water samples. The influence of important variables in DLLME was investigated by use of RSM followed by analysis by liquid chromatography tandem mass spectrometry (LC-MS/MS). Figures of merit were evaluated and the applicability of the method for analysis of real samples was examined.
Experimental
Standards and reagents
Analytical standards of atrazine, simazine, imazapic, imazethapyr, imidacloprid, cyproconazole, epoxiconazole
and tebuconazole (purity > 99%) were supplied by Sigma-Aldrich (São Paulo, Brazil).
Analytical grade phosphoric acid (85%) was purchased from Merck (Darmstadt, Germany). Water was purified with a Direct-Q UV3® (resistivity of 18.2 MΩ cm) water purification system from Millipore (Bedford, USA).
Spectroscopy grade chloroform (CLF), dichloromethane (DCM),dichloroethane (DCE), dichlorobenzene (DCB), monochlorobenzene (MCB), tetrachloroethylene (TCE) and carbon tetrachloride (CTC) were purchased from Vetec (Rio de Janeiro, Brazil), and formic acid was purchased from Merck (Darmstadt, Germany). LC-grade methanol (MET), acetone (ACT) and acetonitrile (ACN) were purchased from Mallinckrodt (Phillisburg, USA).
Individual pesticide stock solutions containing 1000 mg L-1 and intermediate working solutions of
100 mg L-1 were prepared in methanol and stored at
−18 ºC. Due to the different sensitivities of the compounds in the mass spectrometry, a working stock solution containing the mixture of eight analytes of different concentrations was prepared: 2.5 mg L-1 for imidacloprid, 0.25 mg L-1 for
atrazine, simazine, imazapic and imazethapyr, 0.05 mg L-1
for cyproconazole and 0.025 mg L-1 for epoxiconazole and
tebuconazole. Successive dilutions of this working solution were prepared daily.
Fresh mineral water samples for the optimization of the method were purchased in the supermarket. No filtration or any further treatment was conducted on the mineral water samples.
Instrument and chromatographic conditions
Liquid chromatography with mass spectrometric detection was performed in a Waters Alliance 2695 Separations Module (Waters, Milford, USA) fitted with an autosampler, a membrane degasser and a quaternary pump. Mass spectrometry was performed on a Micromass Quattro Micro API (Waters, Milford, USA) with an electrospray ionisation (ESI) interface. The LC column used was XTerra® MS C18 with a 3.5 µm particle size (50 × 3 mm
i.d.) (Waters, Milford, USA).
Analytical instrument control, data acquisition, and data treatment were performed by the software, Masslynx, version 4.1 2005 (Micromass, Waters, Milford, USA).
Optimization of the MS/MS conditions, i.e., choice of the ionization mode, identification of the parent and product ions, and selection of the cone and collision voltages were performed with injection of their individual standard solutions.
conditions were optimized for the maximum intensity of the precursor ions as follows: capillary voltage, 3.5 kV, nebulizer and desolvation (drying gas) flows were set at 350 and 500 L h-1, respectively; source block and desolvation
temperatures were 100 and 400 ºC, respectively. Nitrogen was used as the nebulizing, desolvation and cone gas, and argon was used as the collision gas.
A sample volume of 10 µL was injected with an autosampler. The mobile phase was composed of solvent (A): water, and solvent (B): acetonitrile both acidified with 0.1% formic acid. Chromatographic separation was performed in gradient mode as follows: 0-5 min, 85% A; 5-6 min, 5% A; 6-11, 85% A. The flow rates were: 0-5 min, 0.2-0.4 mL min-1; 5-6 min, 0.4 mL min-1; 6-11 min,
0.4-0.2 mL min-1. The total of the run time was 11 min.
Solvent, matrix-matched and working curve
Analytical curve in solvent
The working solutions were prepared by diluting the mixed standard solutions with methanol. The standard curves were obtained by plotting the peak areas versus the concentrations of the analytes in the working solutions. The slopes of the curves were used to calculate the matrix effect (ME).26
Matrix-matched curve
The matrix-matched curve was prepared from dilutions of the working solution standard at the same concentration levels as the analytical curve in the solvent with the blank matrix extract (extracted by DLLME). The curves were obtained by plotting the peak areas versus the concentrations of the analytes in the extract samples. The slopes of the curves were used to calculate the ME.
Working curve
The working curve was prepared using mineral samples fortified in all levels of the standard curve and submitted to the extraction process. The curves were obtained by plotting the peak areas versus the concentrations of the analytes in the mineral water samples. The curves were used to evaluate the performance of the proposed method during the evaluation of the method.26
Extraction
A 10.0 mL sample at pH 3, acidified with phosphoric acid (1:1, v/v) was placed in a 15.0 mL glass tube with a conical bottom. ACT:ACN (1:1, v/v) (2.0 mL) as the disperser solvent, containing 150 µL CLF:MCB (1:1, v/v) as the extraction solvent, was rapidly injected in the sample
and a cloudy solution (water/ACN/ACT/CLF/MCB) was formed in the tube. Pesticides in the mineral water samples were extracted into fine extraction solvent droplets. The resultant cloudy solution was centrifuged for 5 min at 2000 rpm (Centribio 80-2B, Curitiba, Brazil). After centrifuging, the dispersed fine droplets settled in the bottom of the test tube. The sediment phase was completely transferred to another tube using a 100 µL LC syringe, and, after the solvent was evaporated under nitrogen, the residue was re-dissolved in 100 µL LC grade MET and injected into the separation system. All experiments were performed in triplicate, and the results are provided in the Figures and in the Tables.
Validation experiments and internal quality control criteria
The validation of the analytical method under study was performed by using spiked control samples of water and was assessed according to validation guidelines.27,28
Limit of detection (LOD) and limit of quantification (LOQ) were determined as the lowest injected pesticide concentrations that yielded signal-to-noise (S/N) ratios of 3 and 10, respectively. The results were also checked experimentally.
The linearity was evaluated at a concentration range between LOQ and 30-fold LOQ of each compound. Samples were fortified in six concentration levels and extracted in triplicate. Calibration solutions prepared in the solvent were also constructed.
The extraction recovery (R%) is defined as the percentage of the total analyte which is extracted in the settled phase (equation 1).
Co ×Vaq Csed ×Vsed
R% = × 100% (1)
where R% is the extraction recovery, Csed and Co are the concentration of the sediment phase and initial concentration, respectively, and Vsed and Vaq are the volume of the sediment phase, and the volume of the aqueous sample, respectively.7
The recovery was determined in three replicates for spiking concentrations at the following levels: LOQ (0.5 µg L-1 for imidacloprid, 0.05 µg L-1 for atrazine,
simazine, imazapic and imazethapyr, 0.01 µg L-1 for
cyproconazole and 0.005 µg L-1 for epoxiconazole and
tebuconazole); 5 × LOQ (2.5 µg L-1 for imidacloprid,
0.25 µg L-1 for atrazine, simazine, imazapic and imazethapyr,
0.05 mg L-1 for cyproconazole and 0.025 µg L-1 for
epoxiconazole and tebuconazole) and 10 × LOQ (5.0 µg L-1
imazapic and imazethapyr, 0.1 µg L-1 for cyproconazole
and 0.05 µg L-1 for epoxiconazole and tebuconazole).
Recoveries were calculated using the peak areas. The precision was calculated as relative standard deviation (RSD) for each concentration level.
To ensure the quality of the results, some internal quality criteria have been applied. The set of samples under analysis each day was processed together with a blank extract to eliminate false positive results due to contamination in the extraction process, instrument, or chemicals.
DLLME optimization
The optimization of the extraction and disperser solvent was performed by changing one variable at a time. For the selection of the extraction solvent, the following solvents were tested individually: CLF, DCM, DCE, DCB, MCB, TCE, CTC, with all disperser solvents: MET, ACT and ACN. Subsequently, the following mixtures of extraction solvents were tested: DCE:CLF, DCE:DCB, DCE:MCB, CLF:DCB, CLF:MCB, using acetonitrile as the disperser solvent. The experiments were performed using 150 µL of extraction solvent, 2 mL of disperser solvent, and the samples were acidified to a pH of 3. Finally, the comparison among the averages was performed by the Tukey’s test to evaluate the results obtained for extraction in these experiments. The Tukey’s multiple comparison test was used to indicate significant differences among the main
extraction with 95% significance level (p > 0.05). All statistical calculations were performed with the aid of the software StatSoft, Inc. (2004), STATISTICA version 7.0 (Tulsa, USA).
Experimental design and optimization by RSM
After the choices were made for the best disperser and extraction solvents, a central composite design (CCD) with a five-level fractional factorial design was used for the construction of a second order response surface model (RSM). This design is the most frequently used five-level fractional factorial design for the construction of the RSM. A CCD consists of three types of points: cube points that come from factorial design, axial points and center points. In this design, the center points are often used to calculate the experimental error.29 The StatSoft, Inc. (2004) software,
STATISTICA version 7.0, was employed for the data treatment. The analysis of variance (ANOVA) was carried out, and the values were significant when the p-value was < 0.05.
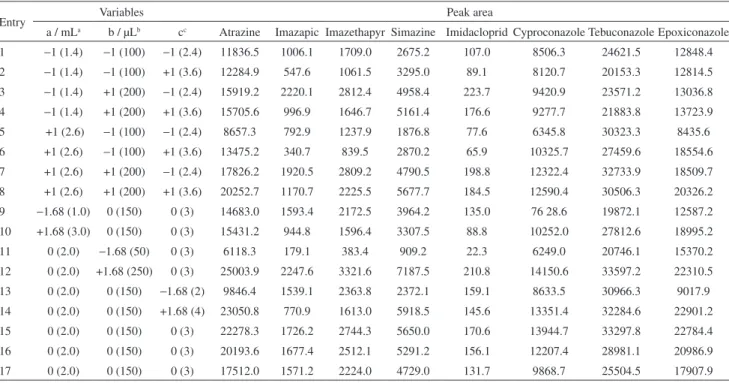
The volume of the disperser solvent (ACT:ACN), the volume of the extraction solvent (CLF:MCB) and pH (independent variables) were optimized by the RSM. A CCD was adopted to evaluate the combined effect of three independent variables on eight responses (area of atrazine, simazine, imazapic, imazethapyr, imidacloprid, cyproconazole, epoxiconazole and tebuconazole) employing
Table 1. Central rotatable composite design matrix and the peak area of the pesticides
Entry Variables Peak area
a / mLa b / µLb cc Atrazine Imazapic Imazethapyr Simazine Imidacloprid Cyproconazole Tebuconazole Epoxiconazole
1 −1 (1.4) −1 (100) −1 (2.4) 11836.5 1006.1 1709.0 2675.2 107.0 8506.3 24621.5 12848.4
2 −1 (1.4) −1 (100) +1 (3.6) 12284.9 547.6 1061.5 3295.0 89.1 8120.7 20153.3 12814.5
3 −1 (1.4) +1 (200) −1 (2.4) 15919.2 2220.1 2812.4 4958.4 223.7 9420.9 23571.2 13036.8
4 −1 (1.4) +1 (200) +1 (3.6) 15705.6 996.9 1646.7 5161.4 176.6 9277.7 21883.8 13723.9
5 +1 (2.6) −1 (100) −1 (2.4) 8657.3 792.9 1237.9 1876.8 77.6 6345.8 30323.3 8435.6 6 +1 (2.6) −1 (100) +1 (3.6) 13475.2 340.7 839.5 2870.2 65.9 10325.7 27459.6 18554.6 7 +1 (2.6) +1 (200) −1 (2.4) 17826.2 1920.5 2809.2 4790.5 198.8 12322.4 32733.9 18509.7 8 +1 (2.6) +1 (200) +1 (3.6) 20252.7 1170.7 2225.5 5677.7 184.5 12590.4 30506.3 20326.2 9 −1.68 (1.0) 0 (150) 0 (3) 14683.0 1593.4 2172.5 3964.2 135.0 76 28.6 19872.1 12587.2 10 +1.68 (3.0) 0 (150) 0 (3) 15431.2 944.8 1596.4 3307.5 88.8 10252.0 27812.6 18995.2 11 0 (2.0) −1.68 (50) 0 (3) 6118.3 179.1 383.4 909.2 22.3 6249.0 20746.1 15370.2
12 0 (2.0) +1.68 (250) 0 (3) 25003.9 2247.6 3321.6 7187.5 210.8 14150.6 33597.2 22310.5 13 0 (2.0) 0 (150) −1.68 (2) 9846.4 1539.1 2363.8 2372.1 159.1 8633.5 30966.3 9017.9
14 0 (2.0) 0 (150) +1.68 (4) 23050.8 770.9 1613.0 5918.5 145.6 13351.4 32284.6 22901.2 15 0 (2.0) 0 (150) 0 (3) 22278.3 1726.2 2744.3 5650.0 170.6 13944.7 33297.8 22784.4 16 0 (2.0) 0 (150) 0 (3) 20193.6 1677.4 2512.1 5291.2 156.1 12207.4 28981.1 20986.9 17 0 (2.0) 0 (150) 0 (3) 17512.0 1571.2 2224.0 4729.0 131.7 9868.7 25504.5 17907.9
seventeen sets of experiments. The ranges and levels of the three selected experimental parameters are shown in Table 1. The variables selected for this study and their respective levels were established based on the literature data and knowledge obtained in the previous work in our group.23
Results and Discussion
LC-MS/MS parameters
The results of the mass spectrometric conditions and retention times for the simultaneous analysis of the pesticides are shown in Table 2. The pesticides atrazine, simazine, imazapic, imazethapyr, imidacloprid, cyproconazole, epoxiconazole and tebuconazole exhibited a more efficient ionization in the positive mode. For each compound, we have selected the optimum collision energies with the aim of obtaining two characteristic multiple reaction monitoring (MRM) transitions with the best signal intensity. We chose the MRM transition with the best signal intensity for quantification and the second one for confirmation of the pesticide detection.
Dispersive liquid-liquid microextraction optimization
Selection of extraction and disperser solvents
The selection of the extraction solvent is an essential parameter in DLLME, and certain criteria must be met for a suitable choice: extraction capability of the investigated compounds, good chromatographic behavior, low solubility in water, high extraction efficiency, and the solvent should form a cloudy solution in the presence of a disperser solvent
when injected into an aqueous solution (in form of very tiny droplets).7
According to these criteria, because of their high densities and low water solubility, the following extraction solvents were tested: CLF, DCM, DCE, DCB, MCB, TCE and CTC.
The disperser solvent is also important because it helps the extraction solvent during the formation of the droplets, and the contact between the droplets and the analyte accelerate the mass transfer process from the aqueous phase to the organic phase, increasing the efficiency and decreasing the time of extraction.30 In general, the solvents
that are appropriate are MET, ACT and ACN.
The experiments for the selection of best extractor and disperser solvents were carried out employing 10 mL of sample acidified to a pH of 3.0, 2 mL disperser solvent and 150 µL of extractor solvent. The sample was fortified with the mixture contained the pesticides in a concentration of 10-fold LOQ of the compounds.
DCM was the only solvent that, when combined with different disperser solvents, did not exhibit a two-phase system.
According with the results (Table 3), for imazapic, imazethapyr and imidacloprid, higher recoveries were reached when chloroform and acetonitrile were used. For atrazine, tebuconazole and epoxiconazole, higher recoveries were reached when dichlorobenzene and acetone were used. However, for simazine, better recoveries were obtained when monochlorobenzene and acetonitrile were used, and for cyproconazole, the most suitable extraction solvent was dichloroethane when acetone was used as the disperser solvent (Table 3).
Table 2. Results of the mass spectrometry conditions for the simultaneous analysis of the pesticidesa
Analyte ESI MRM transition / m/z Cone voltage / V Collision energy / eV tR / min
Atrazine + 216 > 174b
216 > 104
33 31
20 31
2.57
Imazapic + 276 > 231b
276 > 215.8
9 40
21 20
2.84
Imazethapyr + 290 > 230b
290 > 177
40 40
20 20
3.88
Simazine + 202 > 132b
202 > 124
35 35
18 18
3.98
Imidacloprid + 256 > 209b
256 > 175
30 11
14 27
4.45
Cyproconazole + 292 > 70b
292 > 125
35 35
20 30
4.93
Tebuconazole + 308 > 70b
308 > 125
28 40
22 20
6.55
Epoxiconazole + 330 > 121b
330 > 123
27 27
30 30
6.93
Lower recoveries for most of the compounds were obtained when carbon tetrachloride and tetrachloroethylene were used as the extraction solvents. Related to the disperser solvents, when methanol was used, lower recoveries were obtained for all the analytes (2-54%) (Table 3).
The heterogeneous behavior observed for these pesticides can be explained by the octanol-water partition coefficient (KOW). This coefficient defines the tendency of pesticides to distribute between octanol and water.2 The
KOW for the compounds under study ranged between 0.6 and 3.7. These differences in the KOW values indicate that
these compounds can show different behavior during the extraction.31 Based on the obtained results, new experiments
that used a mixture of extraction solvents (CLF, DCE, MCB and DCB) and employing ACN as the disperser solvent were performed. The aim was to find a combination that extracts simultaneously all compounds.
The combination of DCB:MCB for tebuconazole and epoxiconazole resulted in high recoveries (79-81%). For cyproconazole, higher recoveries (80%) were reached using DCE:DCB. For atrazine, simazine, imazapic, imazethapyr and imidacloprid, better results were obtained using a mixture of CLF:MCB (Figure 1).
According to the results, the mixture of CLF:MCB was chosen because it provides improvement in the recoveries for the compounds that had a lower extraction efficiency (atrazine, simazine, imazapic, imazethapyr and imidacloprid). Although this combination was not the best extraction solvent for cyproconazole, epoxiconazole and tebuconazole, and higher recoveries than 50% were reached for these compounds using this combination.
The improved extraction efficiency of this mixture can be explained by the polarity of the solvents, which
Table 3. Percent recoverya and relative standard deviationb of pesticides as a function of different extraction and disperser solvents. Extraction conditions:
sample volume: 10.0 mL; disperser solvent volume: 2 mL; extraction solvent volume: 150 µL
Pesticide
Dichloroethane Chloroform Carbon tetrachloride
Methanol Acetonitrile Acetone Methanol Acetonitrile Acetone Methanol Acetonitrile Acetone R / % RSD R / % RSD R / % RSD R / % RSD R / % RSD R / % RSD R / % RSD R / % RSD R / % RSD Atrazine 19.2 2.7 35.6 2.6 38.2 4.3 20.8 4.8 42.6 2.8 40.2 3.3 17.6 5.1 29.6 4.1 33.4 1.3 Imazapic 3.7 0.1 8.6 1.0 9.6 0.8 8.2 3.2 13.4 2.0 13.7 0.6 − − 2.0 0.2 1.0 0.1
Imazethapyr 9.4 3.7 21.5 0.1 19.2 1.1 8.7 3.8 33.6 2.3 30.4 2.8 1.6 1.0 6.3 2.1 3.9 0.9 Simazine 8.2 2.3 22.7 4.1 21.6 4.4 9.0 1.0 24.3 1.6 31.1 2.5 6.4 1.3 12.7 3.1 11.4 3.6 Imidacloprid 4.9 1.1 18.6 1.4 14.7 0.9 4.6 0.8 26.1 1.5 11.3 0.6 − − − − − −
Ciproconazole 44.9 3.1 57.7 4.4 71.8 0.7 50.1 4.2 51.2 2.2 50.9 1.8 30.1 3.9 46.1 2.9 49.2 1.7 Tebuconazole 44.7 0.4 53.0 2.5 60.8 3.2 45.8 1.4 60.5 3.4 60.4 3.8 54.1 1.0 55.2 1.6 61.3 1.4 Epoxiconazole 51.3 2.0 53.6 1.3 64.1 2.6 40.6 2.4 57.1 0.5 64.5 3.2 49.2 1.9 55.9 3.7 49.0 1.2
Pesticide
Tetrachloroethylene Dichlorobenzene Monochlorobenzene
Methanol Acetonitrile Acetone Methanol Acetonitrile Acetone Methanol Acetonitrile Acetone R / % RSD R / % RSD R / % RSD R / % RSD R / % RSD R / % RSD R / % RSD R / % RSD R / % RSD Atrazine 12.8 3.7 10.8 2.6 23.6 1.6 22.6 3.3 42.9 5.4 52.2 0.2 22.8 4.7 47.3 4.2 41.9 1.2
Imazapic − − − − − − 4.1 0.8 5.7 2.5 5.5 1.3 3.0 1.1 9.5 3.0 6.0 0.3
Imazethapyr − − − − − − 8.3 0.6 14.2 2.6 12.9 4.6 7.9 0.5 20.7 0.7 14.9 1.1 Simazine − − 4.5 0.8 8.0 1.5 15.3 0.8 18.7 4.3 27.9 0.5 12.2 1.9 30.3 1.0 25.3 0.9
Imidacloprid − − − − − − − − 11.0 2.7 9.5 0.7 − − 15.2 2.2 − −
Ciproconazole 45.8 1.8 20.8 1.0 51.1 0.4 48.4 4.3 54.8 3.3 59.2 1.1 46.2 2.2 55.0 0.7 51.3 4.2 Tebuconazole 52.9 2.6 39.2 0.6 59.6 2.8 43.5 4.0 63.6 4.4 69.8 4.0 53.3 2.2 63.4 0.7 60.3 4.6 Epoxiconazole 38.9 8.1 41.5 0.2 61.5 4.0 39.4 5.0 60.2 2.1 79.5 1.9 44.0 5.2 68.9 1.9 60.2 1.2
aPercent recovery: R; brelative standard deviation: RSD.
ranged from low (monochlorobenzene) to slightly more polar (chloroform), while favoring the extraction of pesticides belonging to the different chemical classes. In addition, according to Berijani et al.,4 the benzene ring of
monochlorobenzene interacts with the benzene ring in the analytes and thus increases the efficiency of the extraction.
When acetonitrile was used as the disperser solvent, improved results for the extraction of imazapic, imazethapyr, imidacloprid and simazine were found, and for the extraction of atrazine, tebuconazole, epoxiconazole and cyproconazole, improved results were obtained with acetone (Table 3).
Due to the heterogeneous results that were obtained with the disperser solvents, new experiments using the previously defined mixtures of the extraction solvents were tested with mixtures of ACT and ACN in different ratios (Figure 2).
The mixture of ACT:ACN (1:1, v/v) produced improved recoveries. Different proportions of CLF:MCB were also evaluated using this mixture of disperser solvent, and the best proportion was determined to be a 1:1 ratio (v/v).
23 Central composite design (CCD)
The CCD was applied with the aim of determining the optimum conditions for extraction using the response surfaces. The variables analyzed were the volumes of the disperser and extraction solvent and the pH. The CCD consisted of 17 treatments with 6 experiments at axial points (−1.68 as the lowest level and 1.68 as the highest level) and 3 experiments at central points, as shown in Table 1.
Through the results, the disperser solvent volume presented a significant negative effect (p < 0.05) to imazapic, imazethapyr, simazine, imidacloprid and epoxiconazole (Table 4), suggesting that when passing from the higher level to the lower level (3 to 1 mL) there
is an increasing in the peak area. A significant positive effect was found only for tebuconazole and atrazine, and no statistically significant effect was presented.
This observation can be attributed to the fact that using 1 mL of disperser solvent mixture volume, the cloudy solution is formed well, resulting in a good extraction recovery. When volumes larger than 1 mL were used, the solubility of pesticides in water increases, decreasing the extraction efficiency.
For the extraction solvent volume, the factorial design indicated that the analytes, atrazine, simazine, imazapic imazethapyr, imidacloprid and cyproconazole, presented a positive significant effect (Table 4), indicating that higher extraction solvent volumes improved the results. This behavior can be explained because of the amount of analyte and the disperser solvent mixture partitioning in the extractor solvent mixture increased as the extractor solvent volume increased. Lower volumes led to a decrease in efficiency, probably due to the decrease in the ratio between the disperser and extraction solvent.
When analyzing the pH, imazapic and imazethapyr exhibited a negative significant effect (p < 0.006); however, atrazine, simazine and epoxiconazole exhibited a significant positive effect (p < 0.03). The analytes, cyproconazole, imidacloprid and tebuconazole, presented no statistical significance (Table 4). The heterogeneous behavior observed for these analytes in relation to the changes in pH can be explained by the variation in the polarity of these compounds. According to Ramezani et al.,32 the
acidification of the water sample at pH values lower than the pKafavors the extraction of pesticides of the imidazolinone class, as is the case for imazapic and imazethapyr. However, according to Wang et al.,33 the significant positive effect
found for atrazine and simazine can be explained by the decrease in the water solubility of the triazines when higher pH values were used. This was due to preference of the triazines to remain in the deionized form, which is less polar and therefore increases the efficiency of extraction by the less polar organic solvents.
The data obtained were analyzed by ANOVA with a confidence level of 95% (p < 0.05) using the Fisher F-test. It was verified (Table 5) that the model is adequate within the range evaluated due to the values of Fcal, which are higher than the values of Ftab (p < 0.043). The regression models were simplified by removing terms that were not statistically significant (p > 0.05) and they are represented by the following equations:
ARAtrazine: 20054.80 + 8085.49b + 4347.45c
ARImazapic: 1662.264 – 302.27a2 – 341.678b2 – 382.95c2 +
1039.72b – 611.492c
ARImazethapyr: 2498.665 – 466.246a2 – 488.849b2 +
1404.050b – 594.291c
ARSimazine: 5220.42 – 1101.46a2 + 2991.85b + 1269.36c
ARImidacloprid: 151.9005 – 21.6088a + 111.4289b
ARCyproconazole: 12027.06 – 2306.69a2 + 3456.43b
ARTebuconazole: 29327.94 + 6465.27a
AREpoxiconazole: 20679.55 – 4196.96a2 – 4077.92c2 +
5262.89c
The “AR” is the relative area detected, “a” is the disperser solvent volume, “b” is the volume of the extraction solvent and “c” is the pH. Fcal was between 1.03 and 13.88-fold higher than the Ftab (Table 5), and the response profiles are shown in Figure 3 that represent the recoveries of imazapic and imazethapyr as a function of the significant variables.
The coefficient of determination (R2) was used to verify
the adequacy of the model, which ranged from 0.87 to 0.98 (Table 5), and both of the generated models presented values consonant with the values obtained experimentally, suggesting that the models are predictive, significant and suitable for obtaining the RSM. Moreover, all models showed to be predictive because the errors are insignificant (Table S1 of the Supplementary Information).
From the equations, a relation among some analytes characteristics could be done. For the pesticides with low values of pKa, the pH (variable c) appears as a statistically significant variable. Compounds as imidacloprid (non dissociable) and some weak bases as tebuconazole and cyproconazole showed not be affected by this variable.
The extractor solvent volume (variable b) showed to be significant for almost all compounds, except to the most apolar ones (tebuconazole and epoxiconazole). These ones, due to the less polarity are easily extracted by the extractor solvent than the more polar ones.
According to the results obtained, it was concluded that using a sample acidified to a pH of 3, 2 mL of disperser solvent and 250 µL of extraction solvent, the results produced higher peak areas for all analytes, indicating that these conditions favored an improved percentage recovery for these pesticides. Among the performed tests, experiment 12 represents the optimal conditions of extraction. However, it should be noted that decisions on these conditions were chosen based on the best response
Table 4. The effects of the variables on the extraction of the compounds under study and their p-values
Variable
Atrazine Imazapic Imazethapyr Simazine
Effect Standard
Error p-value Effect
Standard
Error p-value Effect
Standard
Error p-value Effect
Standard Error p-value a 838.2 1692.2 0.6355 −239.7 101.9 0.0509 −159.1 156.9 0.3443 −289.8 382.8 0.4736
a2 −3905.63 1862.6 0.0742 −302.2 112.1 0.0308 −466.2 172.6 0.0306 −1101.4 421.3 0.0347
b 8085.4 1692.2 0.0020 1039.7 101.9 0.0001 1404.0 156.9 0.0004 2991.8 382.8 0.0001
b2 −3549.2 1862.6 0.0984 −341.6 112.1 0.0187 −488.8 172.6 0.0253 −809.7 421.3 0.0960
c 4347.4 1692.2 0.0370 −611.4 101.9 0.0005 −594.2 156.9 0.0068 1269.3 382.8 0.0128
c2 −2921.7 1862.6 0.1607 −382.9 112.1 0.0112 −392.7 172.6 0.0571 −741.1 421.3 0.1219
Imidacloprid Cyproconazole Tebuconazole Epoxiconazole
Effect Standard
Error p-value Effect
Standard
Error p-value Effect
Standard
Error p-value Effect
Standard Error p-value a −21.6 8.7 0.0435 1562.6 850.0 0.1086 6465.2 1868.3 0.0105 3541.0 1527.9 0.0535 a2 −22.2 9.6 0.0548 −2306.6 935.5 0.0431 −4291.5 2056.4 0.0753 −4196.9 1681.7 0.0412
b 111.4 8.7 0.0004 3456.4 850.0 0.0047 4063.9 1868.3 0.0661 3604.8 1527.9 0.0503
b2 −18.9 9.6 0.0906 −1416.1 935.5 0.1738 −1937.4 2056.4 0.3774 −2040.8 1681.7 0.2642
c −16.6 8.7 0.1003 1706.6 850.0 0.0846 −1322.3 1868.3 0.5019 5262.8 1527.9 0.0107 c2 6.3 9.6 0.5328 −855.6 935.5 0.3908 1211.8 2056.4 0.5741 −4077.9 1681.7 0.0457
Values in bold presented significant effect.
for most analytes because when working with multiclass analytes, the compounds present a different behavior in the extractions.
Analytical performance of DLLME
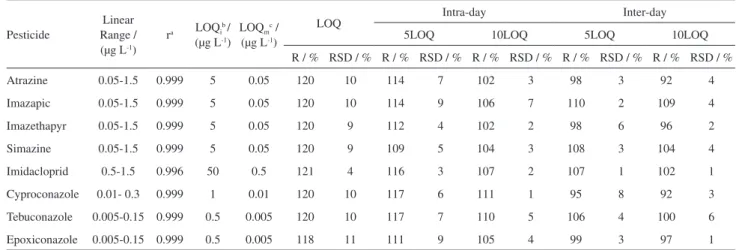
After selecting the optimal extraction conditions, a series of experiments were carried out to evaluate the method in terms of linearity and linear range, correlation coefficient (r), LOQ, recovery (R%), intra-day precision (RSDr) and inter-day precision (RSDip).
The linearity of the method was evaluated through the working curve. Samples were fortified for all levels of the analytical curve and submitted to the extraction process. The linear range of the calibration curves ranged from 0.5 to 15 µg L-1 for imidacloprid, 0.05 to 1.5 µg L-1 for atrazine,
simazine, imazapic and imazethapyr, 0.01 to 0.3 µg L-1
for cyproconazole and from 0.005 to 0.15 µg L-1 for
epoxiconazole and tebuconazole. As shown in Table 6, the correlation coefficients (r) varied between 0.996 and 0.999, producing good linearity for all analytes in accordance with the validation guidelines.27,28 We conclude that the
linear regression model is suitable for this determination analytical study.
LOQs for all target analytes were determined according to the signal-to-noise-ratio (S/N) and varied from 0.5 to 50 µg L-1. After the 100-fold DLLME preconcentration step,
the method limit of quantification (LOQm) was between 0.005 and 0.5 µg L-1 (Table 6). For all pesticides in this
study, this value is below the maximum limits established by the legislation of the European community and below the limits allowed by the Brazilian legislation for water intended for human consumption.34,35
The accuracy of the analytical method was expressed in terms of recovery (R%), and the precision was expressed in
terms of intra-day precision (RSDr) and inter-day precision (RSDpi) (Table 6). The recoveries were calculated via the working curve using three replicate determinations of the spiked samples at three concentrations (LOQ, 5LOQ and 10LOQ for each pesticide). The recoveries varied from 102 to 121%, with RSDs ranging from 2 to 11. For the inter-day precision, the recoveries varied from 92 to 110% while the RSD was below 8% for all compounds.
According to the results, we conclude that the DLLME proved to be an excellent technique for sample preparation because it has the advantages of rapidity, efficiency and ease of extraction and preconcentration for multiclass pesticides in mineral water samples at low concentration levels.
Matrix effects
The co-eluting, undetected matrix components may reduce or enhance the ion intensity of the analytes and affect the reproducibility and accuracy of the assay.36 The
existence of the matrix effect was evaluated by comparison the slope of the analytical curve with the slopes of the matrix matched curve according to the equation described by Economou et al.37 Values of the matrix effect (ME)
between −20% and +20% are considered low.
A ME between −8% and 2% was achieved in this study. These results are due to the characteristics of the mineral water, such as the high degree of purity that occurs once the water infiltrates into the soil, and its long residence time in the subsurface, which reduces the amount of organic matter.3
Comparison of the proposed DLLME with other methods
The extraction and determination of pesticides in water samples by this method are compared with those of other
Table 5. ANOVA parameters
Variation Source
Atrazine Imazapic Imazethapyr Simazine
SSa DFb F
comc Ftabd SSa DFb Fcomc Ftabd SSa DFb Fcomc Ftabd SSa DFb Fcomc Ftabd
Regression 2.87 × 10¹⁴ 2 13.20 3.73 5.96 × 10¹² 5 21 3.2 8.74 × 10¹² 4 17.98 3.25 3.78 × 10¹³ 3 23.8 3.41
Residual 1.52 × 10¹⁴ 14 6.25 × 10¹¹ 11 1.45 × 10¹² 12 6.89 × 10¹² 13
Total 4.40 × 10¹⁴ 16 6.59 × 10¹² 16 1.02 × 10¹³ 16 4.47 × 10¹³ 16
Imidacloprid Cyproconazole Tebuconazole Epoxiconazole
SSa DFb F
comc Ftabd SSa DFb Fcomc Ftabd SSa DFb Fcomc Ftabd SSa DFb Fcomc Ftabd
Regression 4.39 × 10¹⁰ 2 51.78 3.73 5.12 × 10¹³ 2 7.04 3.73 1.42 × 10¹⁴ 1 9.47 4.54 1.71 × 10¹⁴ 3 3.87 3.73
Residual 5.94 × 10⁹ 14 5.09 × 10¹³ 14 2.26 × 10¹⁴ 15 1.92 × 10¹⁴ 13
Total 4.99 × 10¹⁰ 16 1.02 × 10¹⁴ 16 3.68 × 10¹⁴ 16 3.63 × 10¹⁴ 16
aSum of Squares; bdegrees of freedom; cFcom: F computed value; dF
methods in Table 7. The method described here showed shorter extraction time than other microextraction methods that have been proposed in the literature. Similar LODs, recoveries and precision were reached.
Method applicability
The developed method was applied for the pesticides extraction from five samples produced in different regions of Rio Grande do Sul State.
Pesticide residues above the method LOQ were not detected in the samples.
To verify the method performance when applied for different samples, including sparkling and still ones, samples were spiked in a concentration level equivalent to 5-fold LOQ of each compound and submitted to the optimized extraction process. Recoveries and RSDs were in the acceptable range (70 and 120%, with RSDs lower than 20%), indicating that the proposed DLLME could be used for the pesticide determination in sparkling and still water samples (Figure 4).
Conclusion
A new multiresidue method was developed and validated for the simultaneous determination of atrazine, simazine, imazapic, imazethapyr, imidacloprid, cyproconazole, epoxiconazole and tebuconazole in mineral water samples by LC-MS/MS using DLLME as the extraction technique. The advantages of the method are: simplicity of operation, rapidity, low consumption
Table 7. Comparison of the proposed DLLME with other methods
Number of
pesticides Method Extraction time Extraction solvent LOD / (ng L-1) Recovery / % RSD / % Reference
8 DLLMEa few seconds chloroform:
monochlorobenzene (1:1, v/v), 250 µL
1.5-150 102-120 2-10 This paper
6 SPMEb 60 min thermal desorption 0.059-0.151 70.2- 119 4.3-10.2 Li et al.38
8 SDMEc 30 min hexane, 1.6 µL 5.9-58.9 52.5-147.2 15.3-22.9 Soares et al.39
aDLLME: dispersive liquid-liquid microextraction; bSPME: solid phase microextraction; cSDME: single drop microextraction.
Table 6. Method descriptors: linear range, correlation coefficient, instrumental LOQ and LOD of the method, accuracy, intra-day and inter-day precision
Pesticide
Linear Range / (µg L-1)
ra LOQib/
(µg L-1)
LOQmc /
(µg L-1)
LOQ Intra-day Inter-day
5LOQ 10LOQ 5LOQ 10LOQ
R / % RSD / % R / % RSD / % R / % RSD / % R / % RSD / % R / % RSD / %
Atrazine 0.05-1.5 0.999 5 0.05 120 10 114 7 102 3 98 3 92 4
Imazapic 0.05-1.5 0.999 5 0.05 120 10 114 9 106 7 110 2 109 4
Imazethapyr 0.05-1.5 0.999 5 0.05 120 9 112 4 102 2 98 6 96 2
Simazine 0.05-1.5 0.999 5 0.05 120 9 109 5 104 3 108 3 104 4
Imidacloprid 0.5-1.5 0.996 50 0.5 121 4 116 3 107 2 107 1 102 1
Cyproconazole 0.01- 0.3 0.999 1 0.01 120 10 117 6 111 1 95 8 92 3
Tebuconazole 0.005-0.15 0.999 0.5 0.005 120 10 117 7 110 5 106 4 100 6
Epoxiconazole 0.005-0.15 0.999 0.5 0.005 118 11 111 9 105 4 99 3 97 1
acorrelation coefficient; bLOQ
i: instrumental limit of quantification; cLOQm: limit of quantification of the method.
of organic solvents, high preconcentration factor and efficiency of extraction of multiclass pesticides in water samples at low concentration levels. The optimized method obtained satisfactory validation parameters, such as linearity, repeatability, precision and selectivity. Low limits of quantification, acceptable recoveries and a minimal matrix effect were achieved. The experimental results indicated that the proposed method, which uses a mixture of extractor and disperser solvents, is a valuable alternative for the determination of multiclass pesticide residues in mineral water samples. In addition, specific compounds such as imazapic and imazethapyr can be determined, which are difficult to extract by multiresidue methods and usually require a specific extraction method that is specific to the imidazolinone class.
Supplementary Information
Supplementary data (Table S1) is available free of charge at http://jbcs.sbq.org.br as PDF file.
Acknowledgments
The authors acknowledge the financial support and fellowships granted by the following Brazilian agencies: CAPES, FINEP and FURG. Part of this study was supported by a grant from the Brazilian Agencies: CNPq/ CAPES (process number 552318/2011-6), FAPERGS (process number 810-25.51/13-3, and 831-25.51/13-0), CAPES/PNPD (process number 23038.028239/2009-69). E.G. Primel received a productivity research fellowship from the Brazilian Agency CNPq (DT 310517/2012-5).
References
1. Herrero-Hernández, E.; Andrades, M. S.; Álvarez-Martín, A.; Pose-Juan, E.; Rodríguez-Cruz, M. S.; Sánchez-Martín, M. J.; J. Hydrol. 2013, 486, 234.
2. Andreu, V.; Picó, Y.; TrAC Trends Anal. Chem. 2004, 23, 772.
3. Petraccia, L.; Liberati, G.; Giuseppe-Masciullo, S.; Grassi, M.; Fraioli, A.; Clin. Nutr. 2006, 25, 377.
4. Berijani, S.; Assadi, Y.; Anbia, M.; Milani-Hosseini, M. R.; Aghaee, E.; J. Chromatogr. A 2006, 1123, 1.
5. Caldas, S. S.; Demoliner, A.; Costa, F. P.; D’Oca, M. G. M.; Primel, E. G.; J. Braz. Chem. Soc. 2010, 21, 642.
6. Maldaner, L.; Jardim, I. C. S. F.; Talanta2012, 100, 38. 7. Rezaee, M.; Assadi, Y.; Milani-Hosseini, M. R.; Aghaee, E.;
Ahmadi, F.; Berijani, S.; J. Chromatogr. A 2006, 1116, 1. 8. Caldas, S. S.; Gonçalves, F. F.; Primel, E. G.; Prestes, O. D.;
Martins, M. L.; Zanella, R.; Quim. Nova 2011, 34, 1604.
9. Rodríguez-González, N.; Beceiro-González, E.; González-Castro, M.; Muniategui-Lorenzo, S.; Environ. Sci. Pollut. Res. 2015, 22, 618.
10. Martins, M.; Prestes, O.; Adaime, M.; Zanella, R.; Anal. Methods 2014, 6, 5020.
11. Jouyban, A.; Sorouraddin, M. H.; Farajzadeh, M. A.; Somi, M. H.; Fazeli-Bakhtiyari, R.; Talanta2015, 134, 681. 12. Zhang, S.; Li, C.; Song, S.; Feng, T.; Wang, C.; Wang, Z.; Anal.
Methods 2010, 2, 54.
13. Tomasini, D.; Sampaio, M. R. F.; Cardoso, L. V.; Caldas, S. S.; Primel, E. G.; Anal. Methods 2011, 3, 1893.
14. Montes, R.; Rodríguez, I.; Ramil, M.; Rubí, E.; Cela, R.; J. Chromatogr. A 2009, 1216, 5459.
15. Chang, C. C.; Huang, S. D.; Anal. Chim. Acta2010, 662, 39. 16. Leong, M. I.; Huang, S. D.; J. Chromatogr. A2009, 1216, 7645. 17. Wu, Y.; Dai, L.; Cheng, J.; Guo, F.; Li, J.; Chromatographia
2010, 72, 695.
18. Bidari, A.; Ganjali, M. R.; Norouzi, P.; Hosseini, M. R. M.; Assadi, Y.; Food Chem. 2011, 126, 1840.
19. Kamarei, F.; Ebrahimzadeh, H.; Yamini, Y.; Microchem. J. 2011, 99, 26.
20. He, L.; Luo, X.; Jiang, X.; Qu, L.; J. Chromatogr. A 2010, 1217, 5013.
21. Wu, Q.; Li, Y.; Wang, C.; Liu, Z.; Zang, X.; Zhou, X.; Wang, Z.; Anal. Chim. Acta 2009, 638, 139.
22. Cheng, J.; Zhou, Y.; Zuo, M.; Dai, L.; Guo, X.; Int. J. Environ. Anal. Chem.2010, 90, 845.
23. Caldas, S. S.; Costa, F. P.; Primel, E. G.; Anal. Chim. Acta 2010, 665, 55.
24. Sousa, R.; Homem, V.; Moreira, J. L.; Madeira, L. M.; Alves, A.; Anal. Methods2013, 5, 2736.
25. Rodrigues, M. I.; Iemma, A. F.; Planejamento de Experimentos e Otimização de Processos: Uma Estratégia Sequencial de Planejamentos, Casa do Pão Editora: Campinas, 2005. 26. Wang, Y.; You, J.; Ren, R.; Xiao, Y.; Gao, S.; Zhang, H.; Yu, A.;
J. Chromatogr. A 2010, 1217, 4241.
27. http://www.inmetro.gov.br/Sidoq/Arquivos/CGCRE/DOQ/ DOQ-CGCRE-8_04.pdf accessed in June 2015.
28. http://www.eurl-pesticides.eu/library/docs/allcrl/AqcGuidance_ Sanco_2013_12571.pdf accessed in June 2015.
29. Sakkas, V. A.; Islam, M. A.; Stalikas, C.; Albanis, T. A.; J. Hazard. Mater. 2010, 175, 33.
30. Farajzadeh, M. A.; Djozan, D.; Khorram, P.; Anal. Chim. Acta 2012, 713, 70.
31. Martins, M. L.; Primel, E. G.; Caldas, S. S.; Prestes, O. D.; Adaime, M. B.; Zanella, R.; Sci. Chromatographica 2012, 4, 35.
32. Ramezani, M.; Simpson, N.; Oliver, D.; Kookana, R.; Gill, G.; Preston, C.; J. Chromatogr. A2009, 1216, 5092.
34. Agência Nacional de Vigilância Sanitária (ANVISA); Regulamento Técnico para Águas e Gelo, Resolution - RE No. 274, 2005.
35. EU, 98/83/EC of 3 November 1998 on the quality of water intended for human consumption; Off. J. Eur. Comm.1998, 5, L330.
36. Matuszewski, B.; Constanzer, M.; Chavez-Eng, C.; Anal. Chemistry 2003, 75, 3019.
37. Economou, A.; Botitsi, H.; Antoniou, S.; Tsipi, D.; J. Chromatogr. A2009, 1216, 5856.
38. Li, S.; Lu, C.; Zhu, F.; Jiang, R.; Ouyang, G.; Anal. Chim. Acta 2015, 873, 57.
39. Soares, C. E. S.; Neves, A. A.; Queiroz, M. E. L. R.; Oliveira, A. F.; Costa, A. I. G.; Assis, R. C.; Andrade, C. E. O.; J. Braz. Chem. Soc. 2014, 25, 2016.
Submitted: March 25, 2015 Published online: July 8, 2015