Nota Técnica
*e-mail: [email protected]
SPECTROPHOTOMETRIC AND SPECTROFLUORIMETRIC DETERMINATION OF SOME DRUGS
CONTAINING SECONDARY AMINO GROUP IN BULK DRUG AND DOSAGE FORMS VIA DERIVATIZATION WITH 7-CHLORO-4-NITROBENZOFURAZON
Armağan Önal
Department of Analytical Chemistry, Faculty of Pharmacy, Istanbul University, 34116, Beyazit, Istanbul – Turkey
Recebido em 9/3/10; aceito em 22/9/10; publicado na web em 31/1/11
Sensitive and selective spectrophotometric and spectroluorimetric methods have been developed for determination of some drugs such as Pramipexole, Nebivolol, Carvedilol, and Eletriptan, which commonly contain secondary amino group. The subject methods were developed via derivatization of the secondary amino groups with 7-Chloro-4-Nitrobenzofurazon in borate buffer where a yellow colored reaction product was obtained and measured spectrophotometrically or spectroluorimetrically. Concentration ranges were found as 2.0 to 250 μg mL−1 and 0.1 to 3.0 μg mL−1, for spectrophotometric and spectroluorimetric study, respectively. The described methods can be easily applied by the quality control laboratories in routine analyses of these drugs in pharmaceutical preparations. Keywords:secondary amino groups; 7-chloro-4-nitrobenzofurazan; pharmaceutical preparations.
INTRODUCTION
Pramipexole ((6S)-N6
-propyl-4,5,6,7-tetrahydro-1,3-benzothiazo-le-2,6-diamine, PRM) is a non-ergoline dopamine agonist, initially introduced for the treatment of early and advanced Parkinson’s disea-se1 and recently approved in US and Europe also for the treatment of
idiopathic restless legs syndrome in adults.2 Nebivolol hydrochloride
(NBV) is chemically known as α,α′ -[iminobis(methylene)]bis[6-louro-3,4-dihydro-2H-1-benzopyran-2-methanol]hydro-chloride,3
it is a highly selective β1-blocker with nitric oxide-mediated
vasodi-latory actions and beneicial effects on vascular endothelial function. It is a third-generation, cardio-selective beta-blocker used for the treatment of hypertension and chronic heart failure.4 Carvedilol
(CRV), 1-(carbazol-4-yloxy)- 3-((2methoxyphenoxy)ethyl)amino)-2- propanol (Figure 1), is a non-selective beta adrenergic blocking agent.5 Eletriptan (ETP), [(R
)-3-(1-methyl-2-pyrrolidinylmethyl)-5-[2-(phenylsulphonyl)-ethyl]-1H-indole] (Figure 1), which is a new serotonin 5-HT(1B/1D) receptor agonist, has been developed for the treatment of acute migraine attacks.6 Chemical structures of the
subject APIs were given in Figure 1.
There are only a limited number of analytical methods developed for analysis of these drugs in dosage forms. Previously, analysis of Pramipexole in bulk and drug products was carried out by a high performance liquid chromatographic (HPLC) method.7,8 Five HPLC 9-13 and densitometric14 methods have been reported for determination
of NBV in drug products. Two spectrophotometric methods were reported for the determination of CRV.15,16 The literature data for ETP
indicates only one HPLC method utilized in analysis of Eletriptan in dosage forms.17
Although chromatographic methods are sensitive and accurate, their major disadvantages comprise utilization of complex and ex-pensive equipment, usage and disposal of high purity solvents, ap-plication of labor-intensive sample preparation procedures as well as longer duration of analyses. In view of that, new spectrophotometric/ spectroluorometric methods were developed via derivatization of the
secondary amino group of the subject drugs with 7-Chloro-4-Nitro-benzofurazon (NBD-Cl), which is well known to react with primary and secondary amines forming stable condensation colored products.18
The condensation products of NBD-Cl have been demonstrated to be suitable for spectrophotometric and spectroluorimetric assessments therefore, it has been used in analyses of many pharmaceutical for-mulations or biological luids.19-23 The developed methods were also
validated successfully for speciicity, linearity, accuracy, precision, robustness and they have been applied for quantiication of these drugs in tablets, avoiding interferences caused by the excipients. The proposed methods can be easily used in laboratories where modern and expensive apparatus are not available.
EXPERIMENTAL
Apparatus
Reagents and solutions
Pramipexole Hydrochloride and Nebivolol Hydrochloride drug substances and its pharmaceutical preparation (Nexivol® containing
5 mg/tablet Nebivolol Hydrochloride) were kindly supplied by Abdi Ibrahim Pharmaceuticals (Istanbul, Turkey). Pexola®
contai-ning 1 mg of pramipexole hydrochloride per tablets was obtained from local drugstore. Carvedilol and its pharmaceutical preparation (Kinetra®) containing 25 mg of Carvedilol per tablet were procured
from Sanovel (Istanbul, Turkey). Eletriptan Hydrobromide and its pharmaceutical preparation (Relpax ilm coated tablet®) containing
40 mg of Eletriptan Hydrobromide per tablet were kindly supplied by Pizer (Istanbul, Turkey). NBD-Cl and other chemicals were purchased from Merck (Darmstadt, Germany). All chemicals and reagents were of analytical-reagent grade. A stock solution of PRM base containing 1 mg mL-1 was prepared in water. A stock solution of
NBV base containing 10 mg mL-1 was prepared in methanol. A stock
solution of CRV (1 mg mL-1) was prepared in acetonitrile. ETP stock
solution 1.0 mg/mL, calculated as free base was prepared in methanol. NBD-Cl solution was freshly prepared in methanol at 5 mg mL-1
concentration. Buffer solution was prepared as follow: 0.620 g boric acid and 0.750 g potassium chloride were dissolved with 100 mL of water. After adjusting the pH to 8.0 and 8.5 with 0.1 N sodium hydro-xide solution, the inal solution was diluted to 200 mL with water. General procedure
Pramipexole
This material was analyzed using both spectrophotometric and spectroluorimetric methodology. Aliquots of the stock standard solu-tion varied from 0.05-0.3 and 0.015-0.15 mL, for the spectrophoto-metric and spectroluorispectrophoto-metric studies, respectively, were transferred into a series of 10.0 mL volumetric lasks and then the volume was adjusted to about 0.3 and 0.15 mL with water, for spectrophotometric and spectroluorimetric study, respectively.
Nebivolol
Aliquot of the associated stock standard solution ranged betwe-en 0.005 and 0.060 mL were transferred into a series of 10.0 mL volumetric lasks and then the volume was adjusted to about 0.060 mL with methanol.
Carvedilol
Aliquots of its stock standard solution between 0.035 and 0.300 mL were individually transferred into glass stoppered tubes and their volumes were brought to 0.300 mL with acetonitrile.
Eletriptan
Aliquots of its stock standard solution (0.15-1.25 mL) were indi-vidually transferred into glass stoppered tubes and their inal volumes were brought to 1.25 mL with methanol. Following addition of 0.2 mL of buffer solution to each drug solutions, 0.7, 0.8, 0.3 and 0.5 mL of NBD-Cl solutions were added to PMP, NBV, CRV and ELT, respectively and the mixtures treated in water bath with thermostat at 70 °C for 30 min for NBV and 80 °C for 7, 20 and 30 min for PMP, CRV and ELT, respectively. The mixtures were then cooled within a ice bath and acidiied with 0.2 mL of 0.1 M HCl solution. The derivatives of individual drug substances formed by coupling with NBD-Cl, were extracted using 5 mL aliquots of chloroform (for PRM and CRV), dichloromethane (for NBV) and ethyl acetate (for ELT) by mixing vigorously with a vortex mixer. The phases were separated by centrifugation. For the spectrophotometric studies, absorbance values of the derivatives extracted to the organic layers
were measured at their respective maximum wavelengths against a blank solution prepared similarly.
For the spectroluorimetric studies, upon completion of the ex-traction process, 1 mL aliquots of the organic phase were transferred to 10 mL volumetric lasks and their volumes were diluted to 10 mL with chloroform (for PRM) or dichloromethane (for NBV) and mixed well. The luorescence intensities of these derivatives were measured at 529 and 530 nm (for PRM and NBV) while exciting at 470 and 473 nm (for PRM and NBV) measured against blank solu-tions prepared similarly. The luorescence intensity of the reference standard, sodium luoressein, solution was also measured at the same wavelength combination. The relative luorescence intensity (IF)
was then calculated by the following equation: IF=x/y×100. x and
y represent the luorescence intensities of the sample and reference standard solutions, respectively (n=5).
Assay procedure for tablets
Pramipexole
Tablet powder equivalent to 50 mg of PRM base was accurately weighed and transferred into a 50 mL calibrated volumetric lask. About 25 mL of water was added and then extraction was performed by shaking mechanically for 20 min and sonicating for 20 more min. Upon completion of the extraction step, the volume of the mixture was brought to 50 mL with water and mixed well by vortexing. Then, inal solution was iltered through a 0.45 um nylon ilter.
Nebivolol
Tablet powder equivalent to 50 mg of NBV base was accurately weighed and transferred into a 50 mL calibrated lask. About 25 mL of methanol was added and then extraction was performed mechanically for 20 min and sonicated for 20 more min. The volume was brought to 50 mL with methanol and inal solution was iltered.
Carvedilol
Ten tablets were individually weighed to get the average weight of the tablets. A sample of the powdered tablets, claimed to contain 100 mg of CRV was transferred to 100 mL volumetric lask. About 75.0 mL of acetonitrile was added and then extraction was performed mechanically for 20 min and sonicated for 20 more min. The volume was brought to 100 mL with acetonitrile and its contents were cen-trifuged for 10 min at 3000×g.
Eletriptan
Ten ilm-coated tablets were transferred to 500 mL volumetric lask. About 400 mL of methanol was added and then extraction was performed mechanically for 20 min and sonicated for 20 more min. The volume was brought to 500 mL with methanol and inal solution was iltered. Then 1 mL of this solution was further diluted to 100 mL using methanol.
Aliquots of the iltrates were further diluted withsolvents stated above then proceeded with the solution preparation scheme as des-cribed under of the general procedure section. The nominal contents of the tablets were calculated using either the calibration graph or the corresponding regression equation.
RESULTS AND DISCUSSION
NBD-Cl was selected as a derivatizing reagent because it forms luorescent/chromogenic derivatives with primary or secondary amines requiring relatively mild reaction conditions.19-23 PRM, NBV,
the generated derivatives were then measured at their respective λmax
which were outlined in Table 1. Figure 3 shows absorption spectra of drug-NBD derivatives against the blank prepared similarly.
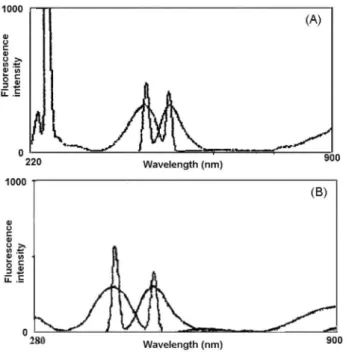
Under the developed experimental conditions, the maximum luorescence intensities for PRM and NBV were determined at 529 and 530 nm while excitation took place at 470 and 473 nm, respectively. Figure 4 shows the excitation and emission spectra for PRM-NBD and NBV-NBD derivatives. When NBD derivatives of CRV and ELT were measured against a blank prepared using a spectroluorimetry, no substantial differences have been determined. Therefore, NBD derivatives of CRV and ELT were studied utilizing spectrophotometric methods.
Study of experimental parameters
The different experimental parameters affecting the development of the reaction product were carefully studied and optimized. The variability/optimization of the main reaction parameters such as pH, volume of the reagent, temperature, and heating time were studied individually.
Effect of pH and HCl concentration
The pH study was completed within the range of 7-10 using borate buffers. The maximum absorbance was obtained at pH 8.5 for PRM and NBV and at pH 8 for ELT and CRV. The test results for pH studies are summarized in Figure 5.
Cl is hydrolyzed in alkaline medium by formation of NBD-OH having a maximum absorbance at 460 nm. In order to decrease high background effect, it was necessary to acidify the reaction mix-ture. The required amount of HCl for acidiication was determined as 0.2 mL of 0.1 M HCl.
Effect of temperature and time
In order to determine the optimum temperature and time required for the completion of the reaction, the derivatization reaction was car-ried between the range of 60 to 80 °C. Complete color development was attained after 7, 20 and 30 min for PMP, CRV and ELT, respectively in water bath at 80 °C while heating at 70 °C for 30 min was suficient to fulill the optimum reaction requirement for NBV(Figure 6).
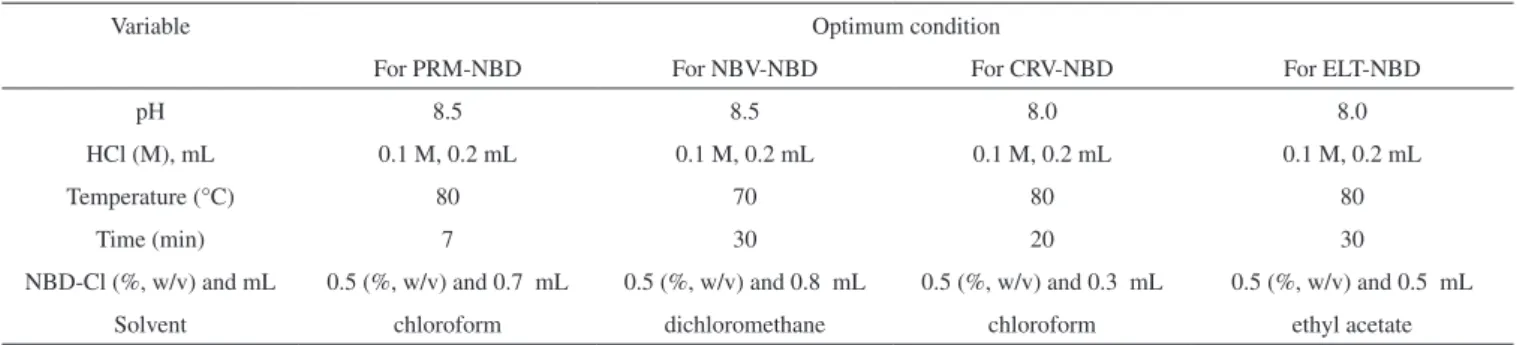
Table 1. Optimization of variables affecting the reaction of drugs with NBD-Cl
Variable Optimum condition
For PRM-NBD For NBV-NBD For CRV-NBD For ELT-NBD
pH 8.5 8.5 8.0 8.0
HCl (M), mL 0.1 M, 0.2 mL 0.1 M, 0.2 mL 0.1 M, 0.2 mL 0.1 M, 0.2 mL
Temperature (°C) 80 70 80 80
Time (min) 7 30 20 30
NBD-Cl (%, w/v) and mL 0.5 (%, w/v) and 0.7 mL 0.5 (%, w/v) and 0.8 mL 0.5 (%, w/v) and 0.3 mL 0.5 (%, w/v) and 0.5 mL Solvent chloroform dichloromethane chloroform ethyl acetate Figure 2. Proposed reaction pathway between drug containing secondary
amine and NBD-Cl
Effect of NBD-Cl concentration
The concentration range of NBD-Cl was also investigated. Additions of 0.7, 0.8, 0.3 and 0.5 mL of 0.5% NBD-Cl solution were found to be suficient for obtaining maximum and reproducible color intensity for PMP, NBV, CRV and ELT, respectively. Refer to Figure 7 for the summarized related data points.
Effect of organic solvents and stability of the derivative
Different organic solvents were tested to determine the most appropriate solvent: methanol, ethyl acetate, dichloromethane, chloroform and acetonitrile. Chloroform (for PRM and CRV), di-chloromethane (for NBV) and ethyl acetate (for ELT) were found to
be the suitable solvents providing the highest absorbance values. The effect of time on the stability of the drug-NBD derivative in organic solvents was studied at different time intervals. The color remains stable at least for 12 h.
A summary for the optimization of the variables affecting the reaction of these drugs with NBD-Cl are given in Table 1.
Stoichiometry of the reaction
The molar ratio of NBD-Cl and the subject API in the reaction mixture was studied according to Job’s method of continuous variation.24
Utilizing equimolar solution of drugs and NBD-Cl, the reaction stoichio-metry was found to be a good approximation 1:1 ratio (drug/reagent). Validation of the methods
A linear correlation was established between the absorbance and concentration values in the ranges as outlined in Table 2. The correlation coeficients, intercepts and slopes for the calibration data for the four cited APIs are calculated using the least squares method. These values are illustrated in Table 2. Under the optimum reaction conditions relative luorescence intensity was found to be linearly correlated with the API concentration over the range of 0.3-3.0 μg mL−1 for PRM and 0.10–1.2 μg mL−1 for NBV. Linear regression
analysis of the concentration-luorescence intensity data gave the following equation: If=22.181 C +8.0837 for PRM and If=722.1 C
+152.69 for NBV where C is the concentration in μg mL−1 and I f is
the luorescence intensities (n=5). The correlation coeficient was 0.9983 and 0.9999 for PRM and NBV methods showing excellent linearity. The limit of detection (LOD) and limit of quantitation (LOQ) were determined using the formula: LOD or LOQ = κSDa/b, where κ= 3 for LOD and 10 for LOQ, SDa is the standard deviation of the intercept, and b is the slope. The parameters for the analytical performance of the proposed methods are summarized in Table 2.
To check accuracy of the proposed methods, the standard addition technique was applied. Aliquots of the sample solution was spiked with three different concentrations of the standard solution. The percent recoveries of the added standards were calculated using the Equation 1.
Recovery % = [(Ct-Cu ) / Ca] x 100 (1)
where Ct is the total concentration of the analyte found; Cu is the
concentration of the analyte present in the formulation; and Ca is
the concentration of the pure analyte added to the formulation. The results of analysis of the commercial dosage forms and the recovery study are shown in Table 3. The average percent recoveries ranged from 98.20 to 101.27% indicating good accuracy of the methods.
The speciicity of the methods was studied by evaluating the in-terference liabilities from the common tablet excipients, such as talc, lactose, starch, mannitol and magnesium stearate. No interference Figure 4. Excitation and emission spectra of the reaction product of drugs
with NBD-Cl (A) Pramipexole, (B) Nebivolol
Figure 5. Effect of pH on the development of the reaction product of drugs with NBD-Cl
Figure 6. The effect of time of heating on the reaction between drugs with NBD-Cl at optimum temperature
Table 2. Results of analytical parameters of the proposed methods
Parameters PRM NBV CRV ELT
Spectrophotometric method
Spectroluorimetric method
Spectrophotometric method
Spectroluorimetric method
Spectrophotometric method
Spectrophotometric method Wavelength (nm) λmax:474 λex : 470, λem :529 λmax: 484 λex : 473, λem :530 λmax: 480 λmax: 480 Concentration range a (μg
mL−1)
10-60 0.3-3.0 2.0-40.0 0.1-1.2 7.0-60.0 30-250
Regression equationb
Intercept ± SD - 0,0969 ± 0.063 8.0837 ± 0.55 0.0523 ± 0.0007 152.69 ± 2.19 0.0138 ± 0.00027 -0.1578 ± 0.002383 Slope ± SD 0,0906 ± 0.096 22.181 ± 0.89 0.0191 ± 0.0002 722.1 ± 5.6 0.0149 ± 0.00110 0.1009 ± 0.004222 Correlation coeficient (r2) 0.9997 0.9983 0.9994 0.9999 0.9997 0.9995
Precision
Intra-day c, RSD % 0.55 0.85 0.91 0.68 0.98 0.98
Inter-dayd, RSD % 0.89 1.14 1.02 0.95 1.45 1.43
LOD (μg ml−1) 2.08 0.074 0.110 0.010 0.055 0.070
LOQ (μg ml−1) 6.95 0.247 0.367 0.0334 0.185 0.236
a Average of ive determinations. b A = a + bC (where C is the concentration of drug in μg mL−1). cResults of 5 different days. d n=5 correspond to replicate analysis for each level
was observed from these excipients.
The inter- and intra-day precision were examined by analysis of drugs (n=5) for 7 consecutive days. The RSD values for intra-day precision and %, and inter-day precision and %, for spectrophoto-metric and spectroluorispectrophoto-metric methods indicated good precision. The obtained results are summarized in Table 2.
Robustness was assessed by testing the susceptibility of measu-rements to deliberate variation of the analytical conditions. It was ve-riied that slight variations in concentration of NBD-Cl (0.45–0.55%, w/v), temperature (optimum ± 2 °C), and time (optimum ± 0.25 min) Table 3. Results of recovery studies by standard addition method
Methods Amount taken (µg mL-1) a
Amount added (µg mL-1)
Total amount found b (µg mL-1) (Mean± S.D.c )
Recovery (%) RSD (%)
PRM Spectrophotometric Method
30.0 10.0 40.120±0.32 101.20 0.80
20.0 49.980±0.55 99.90 1.10
30.0 60.140±0.68 100.47 1.13
Spectroluorimetric Method
1.0 0.3 1.301±0.012 100.33 0.92
1.0 2.013±0.025 101.34 1.24
2.0 2.986±0.038 99.30 1.27
NBV Spectrophotometric Method
5.0 2.0 6.99±0.050 99.50 0.72
15.0 20.190±0.210 101.27 1.04
35.0 40.150±0.265 100.43 0.66
Spectroluorimetric Method
0.70 0.10 0.799±0,004123 99.99 0.52
0.30 1.00±0.005765 100.14 0.58 0.50 1.20±0.007987 100.22 0.67 CRV Spectrophotometric
Method
5.0 2.0 7.01±0.054 100.50 0.77
25.0 29.65±0.34 98.60 1.15
55.0 59.01±0.67 98.20 1.14
ELT Spectrophotometric Method
50 30 79.71±0.502 99.03 0.63
100 149.79±0.839 99.79 0.56
200 249.61±1.068 99.81 0.43
a Pexola® tablet (1 mg) (for PRM), Nexivol® tablet (5 mg) (for NBV), Kinetra® tablet (25 mg) (for CRV), Relpax ilm coated tablet (for ELT). bFive independ-ent analyses. cStandard deviation
did not have an adverse impact on the subject derivatization proce-dure. All precision studies yielded RSD values not more than 2%. The most critical factor affecting the test results was determined to be the pH which was adjusted to be in the range of 8.5 ± 0.2 in order to generate the maximum response or 8.0 ± 0.2.
Applications of the method
tablet and Relpax® ilm coated tablet) and the results obtained are
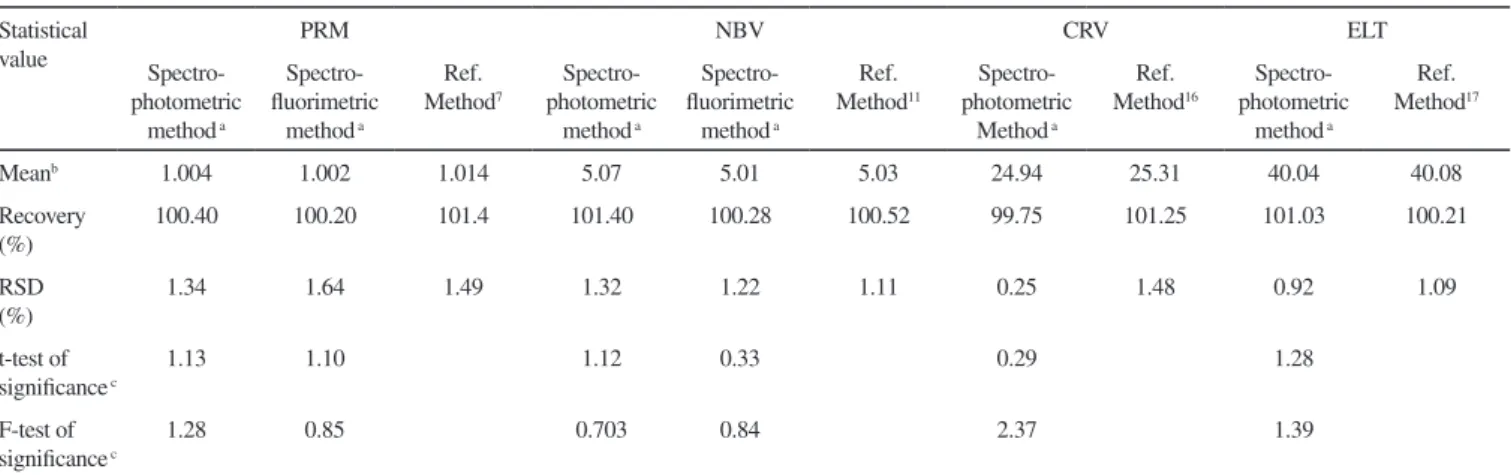
summarized in Table 4. Statistical analysis of the results obtained by the proposed method and reference HPLC methods6,11,17 for PRM,
NBV and ELT, respectively and UV spectrophotometric method16
for CRV were performed using the Student’s t-test and the variance ratio F-test. The calculated values were comparable with that of the theoretical test results indicating no signiicance difference between the compared methods regarding accuracy and precision.
CONCLUSION
New simple, sensitive and selective spectrophotometric and spec-troluorimetric methods, which comprise NBD-Cl as derivatization reagent, have been developed and validated for determination of PRM, NBV, CRV and ELT. The proposed methods were successfully applied for the subject drug substances and their respective drug products,and proven to be selective, highly sensitive, accurate, and precise. Therefore, the proposed methods are suitable for routine assay determination of PRM, NBV, CRV and ELT .
SUPPLEMENTARY MATERIAL
Available at http://quimicanova.sbq.org.br in PDF format, with free access.
ACKNOWLEDGEMENT
I would like to thank to the Research Fund of Istanbul University for supporting the subject scientiic study (Project numbers: BYP-1909 and BYP-3252).
REFERENCES
1. Hubble, J. P.; Novak, P.; Exp. Rev. Neurother.2001, 1, 43.
2. McCormack, P. L.; Siddiqui, M. A. A.; CNS Drugs2007, 21, 429. 3. The Merck Index; Budavari, S., ed.; 13th ed., Merck & Co., Inc.:
Whitehouse Station, 2001, p. 1152.
4. Moen, M. D.; Wagstaff, A. J.; Drugs2006, 66, 1389. 5. Abshangen, U.; J. Cardiovasc. Pharmacol. 1987, 10, 23.
6. Goadsby, P. J.; Ferrari, M. D.; Olesen, J.; Stovner, L. J.; Senard, J. M.; Jackson, N.C.; Poole, P. H.; Neurology2000, 54, 156.
7. Srinubabu, G.; Jaganbabu, K.; Sudharani, B.; Venugopal, K.; Girizasan-kar, G.; Rao, J. V. L. N. S.; Chromatographia2006, 64, 95.
8. Jancic, B.; Medenica, M.; Ivanovic, D.; Malenovic, A.; Acta Chim. Slov. 2007, 54, 49.
9. Shah, D. A.; Bhatt, K. K.; Mehta, R. S.; Baldania, S. L.; J. AOAC Int. 2008, 91, 1075.
10. Dhandapani, B.; Kumar, K. S.; Dharuman, J.; Geetha, K.; Asian J. Chem. 2008, 20, 1648.
11. Kachhadia, P. K.; Doshi, A. S.; Joshi, H. S.; J. AOAC Int.2008, 91, 557. 12. Doshi, A. S.; Bhagwan, S. S.; Mehta, T. N.; Gupta, V. K.; Subaaiah, G.;
J. AOAC Int.2008, 91, 292.
13. Shah, D. A.; Bhatt, K. K.; Mehta, R. S.; Baldania, S. L.; Gandhi, T. R.; Ind. J. Pharm. Sci. 2008, 70, 591.
14. Reddy, T. S.; Devi, P. S.; J. Planar Chromatogr.—Mod. TLC2007, 20, 149.
15. Cardoso, S. G.; Ieggli, C. V.; Pomblum, S. C.; Pharmazie2007, 62, 34. 16. Ieggli, C. V.; Cardoso, S. G.; Belle, L. P.; J. AOAC Int. 2005, 88, 1299. 17. Sagirli, O.; Onal, A.; Sensoy, D.; Chromatographia2008, 68, 269. 18. Pesez, M.; Batros, J.; Colorimetric and Fluorimetric Analysis of Organic
Compounds and Drugs, Marcel Dekker: New York, 1974, p. 170. 19. Saleh, H. M.; El-Henawee, M. M.; Ragab, G. H.; El-Hay, S. S.;
Spec-trochim. Acta, Part A2007, 67, 1284.
20. Olojo, R. O.; Xia, R. H.; Abramson, J.; J. Anal Biochem.2005, 339, 338. 21. Önal, A.; Sagirli, O.; Spectrochim. Acta, Part A2009, 72, 68. 22. Önal, A.; J. AOAC Int.2006, 89, 972.
23. Önal, A.; Sagirli, O.; Cetin, S. M.; Toker, S.; Chromatographia 2007, 66,103.
24. Job, P.; Anal. Chem. 1928, 9, 113.
Table 4. Statistical evaluations of the results obtained by proposed and reference (6,1) methods for the assay of drugs in pharmaceutical preparations (n=5) Statistical
value
PRM NBV CRV ELT
Spectro-photometric
method a
Spectro-luorimetric
method a
Ref. Method7
Spectro-photometric
method a
Spectro-luorimetric
method a
Ref. Method11
Spectro-photometric
Method a
Ref. Method16
Spectro-photometric
method a
Ref. Method17
Meanb 1.004 1.002 1.014 5.07 5.01 5.03 24.94 25.31 40.04 40.08 Recovery
(%)
100.40 100.20 101.4 101.40 100.28 100.52 99.75 101.25 101.03 100.21
RSD (%)
1.34 1.64 1.49 1.32 1.22 1.11 0.25 1.48 0.92 1.09
t-test of signiicance c
1.13 1.10 1.12 0.33 0.29 1.28
F-test of signiicance c
1.28 0.85 0.703 0.84 2.37 1.39
Material Suplementar
*e-mail: [email protected]
SPECTROPHOTOMETRIC AND SPECTROFLUORIMETRIC DETERMINATION OF SOME DRUGS
CONTAINING SECONDARY AMINO GROUP IN BULK DRUG AND DOSAGE FORMS VIA DERIVATIZATION WITH 7-CHLORO-4-NITROBENZOFURAZON
Armağan Önal
Department of Analytical Chemistry, Faculty of Pharmacy, Istanbul University, 34116, Beyazit, Istanbul – Turkey