Wave run-up on embayed beaches. Study case: Itapocorói Bay, Southern
Brazil
This paper presents a new approach for estimating
run-up on embayed beaches based on a study of the
microtidal coast of Itapocorói Bay, Southern Brazil
using the surf similarity parameter and wave height at
break location. The four step methodology involved:
1) direct wave measurement (34 days), wave run-up
measurement (19 days at 7 points within the bay),
measurement of bathymetry and beach topography
in the entire bay; 2) tests on available formulae to
calculate wave run-up; 3) use of the SWAN spectral
wave model to simulate wave parameters at breaking
at each wave run-up measurement point and; 4)
development of a new formula/approach to assess
wave run-up on embayed beaches (in both exposed
and protected areas). During the experiments the
signiicant wave height varied from 0.5 m to 3.01
m, the mean wave period from 2.79 s to 7.76 s (the
peak period varied between 2.95 s and 17.18 s), the
mean wave direction from 72.5° to 141.9° (the peak
direction varied from 39.2° to 169.8°) and the beach
slope (tan β) from 0.041 to 0.201. The proposed
formula is in good agreement with measured data
for diferent wave conditions and varying degrees of
protection. The analysis demonstrates that although R²
varies from 0.52 to 0.75, the wave run-up distribution
over the measurements agreed well with the proposed
model, as shown by quantile-quantile analysis
(R²=0.98 to 0.99). The errors observed in individual
cases may be related to errors of measurements,
modeling and to non-linear processes in the swash
zone, such as infragavity waves.
A
bstrAct
Guilherme Vieira da Silva
1*, Paula Gomes da Silva
2, Rafael Sangoi Araujo
3, Antonio Henrique da
Fontoura Klein
4, Elírio E. Toldo Jr.
5 1 Griith Centre for Coastal Management (GCCM) - Griith University(Gold Coast Campus - QLD 4222 - Building location (G51) Australia).
2 Instituto de Hidráulica Ambiental (IH Cantabria) - Universidad de Cantabria
(Parque Cientíico y Tecnológico de Cantabria, C/ Isabel Torres, 15, 39011 Santander, Cantabria, Cantabria, Espanha)
3 Centro de Ciências Tecnológicas da Terra e do Mar (CTTMar) - Universidade do Vale do Itajaí
(Rua Uruguai, 458, Centro - Itajaí - Santa Catarina, CEP 88302-901)
4 Laboratório de Oceanograia Costeira (LOC) -Departamento de Geociências Universidade Federal de Santa Catarina
(Campus Universitário Trindade - Florianópolis - SC - Brasil. CEP: 88040-900)
5 Centro de Estudos de Geologia Costeira e Oceânica (CECO) - Universidade Federal do Rio Grande do Sul
(Campus do Vale Av. Bento Gonçalves, 9500 - Porto Alegre - RS - Brasil CEP: 91501-970)
*Corresponding author: [email protected]
Descriptors:
Swash zone, Overtopping, Coastal
management, Coastal inundation, Beach erosion,
Coastal process.
Este artigo tem o objetivo de estimar o
run-up
em praias
de enseada a partir de estudo realizado na Enseada do Ita
-pocorói, localizada em uma costa de micromarés no sul
do Brasil utilizando o parâmetro de similaridade de surf
(
surf similarity parameter
) e altura de ondas no ponto de
quebra. A metodologia aplicada foi dividida em quatro
etapas: 1) medição direta de ondas (34 dias), medidas de
wave
run-up
(19 dias em 7 pontos da baía), medições to
-po-batimétricas; 2) testes com as fórmulas disponíveis na
literatura para cálculo do
run-up
; 3) uso do modelo
espec-tral SWAN para simular a propagação das ondas e obter os
parâmetros de ondas no ponto de quebra no momento das
medições do
run-up
e; 4) desenvolvimento de uma nova
abordagem para estimar o
run-up
em praias de enseada
(aplicável às áreas protegidas e expostas da enseada). Os
resultados demonstram que, durante os experimentos, a
altura signiicativa de onda variou entre 0,5 e 3,01 m, o
período médio entre 1,79 e 7,76 s (o período de pico entre
2,95 e 17,19 s), a direção média entre 72,5° e 141,9° (a
direção de pico entre 39,2° e 169,8°) e a declividade da
face da praia (tan β) entre 0,041 e 0,201. A fórmula pro
-posta apresenta boa concordância com os dados medidos
para diferentes condições de ondas e graus de proteção da
praia. Como conclusão destaca-se que, apesar do R² variar
entre 0,52 e 0,75, a distribuição das medições de
run-up
apresentou boa concordância com o modelo proposto,
como demonstrado pela análise quantil-quantil (R²=0,98
a 0,99). Os erros observados em casos individuais podem
estar relacionados a erros das medições, do modelo e aos
processos não lineares presentes na zona de espraiamento,
como as ondas de infragravidade.
r
esumo
Descritores:
Zona de espraiamento, Sobrelavagem,
Gerenciamento costeiro, Inundação costeira, Erosão
praial, Processos costeiros.
BJOCE
Original Article /
Artigo Original
INTRODUCTION
The run-up induced by waves on natural beaches and
artiicial structures has been the focus of many studies over the last few decades (e.g. AHRENS; TITUS, 1985; NIELSEN, 1989; HOLLAND et al., 1995; LONGO et
al., 2002; BONETTI et al., 2012), since it is an important criteria for the design of coastal structures and an important element in analysis of vulnerability to erosion
and looding at the coast (HOLMAN; SALLENGER, 1985). Furthermore, run-up in the swash zone is an
important boundary condition for numerical models of
beach evolution (HORIKAWA, 1988). Described as the
maximum height above sea water level reached on the
coastline (BATTJES; JANSSEN, 1978), the run-up is
composed of a superelevation of the mean water level
caused by breaking waves (setup) and of luctuations around this superelevation on the beach (swash) (GUZA; THORTON, 1982; HOLMAN; SALENGER, 1985).
Due to the complexity of the non-linear processes involved in run-up generation, its prediction is often based
on empirical approaches (BATTJES, 1974; HEDGES; MASE, 2004) and shall be based on parameters that
represent all the wave transformation processes, until it reaches the beach and/or structure. Nevertheless, for pragmatic reasons, most studies undertake run-up predictions based only on the beach or structure slope and deep water wave parameters as wave height and wave
length (NIELSEN; HANSLOW, 1991).
The primary eforts on calculating run-up through empirical parametrizations was presented by HUNT (1959), based on data obtained from laboratory experiments
that represented the run-up of monochromatic waves over
structures with lat and impermeable bottoms. The author
proposed that run-up was related to the structure slope, wave height and wave length, through the surf similarity
parameter (ξ). The formulation given by HUNT (1959)
has been heavily utilized, however, applying formulas based on laboratory data to natural beaches can present
some complications, as stated by STOCKDON et al. (2006): i) in natural conditions wave height and period become statistical parameters (usually signiicant wave
height (Hs) and peak period (Tp)); ii) the wave height
is measured at diferent points (deep water wave height, break height, local height) and iii) deining only one value
of beach slope to describe the run-up on the entire beach
is diicult and becomes more complicated in the presence
of sandbars.
Since then, several authors presented run-up
formulations based on data from natural beaches. GUZA; THORTON (1982) used data from a ield experiment to deine a formulation relating wave height at a point in 10
m depth and the elevation of run-up on an exposed sandy
beach. The authors justify the absence of correlation with the surf similarity parameter by the low range of ξ0 in their data.
NIELSEN; HANSLOW (1991) tested the run-up on natural sandy beaches with diferent slopes. They
analyzed run-up on six exposed beaches (from dissipative
to relective conditions) relating it to the values of wave height at a point in 80 m water depth and the beach face
slope. Assuming a Rayleigh distribution, the authors
presented the results for diferent statistics run-up (mean run-up, signiicant run-up, run-up exceeded by 2% of the waves, run-up exceeded by 1% of the waves and root
mean squared run-up). According to analysis of the data
collected in that work, the beach slope has no signiicant inluence on the values of run-up height on beaches with low beach face slopes (tan β<0.1).
RUGGIERO et al. (2004) conducted tests using data from video monitoring and ield campaigns on
a high-energy dissipative beach (Agatha Beach), in
Oregon, USA. On beaches with these characteristics, the
infragravity energy (with frequencies ranging between
0.05 and 0.004 Hz) tends to dominate the inner surf and
swash zones. A strong dependence was observed between
run-up height variations and the beach face slope. Finally,
the dependence of the surf similarity parameter was
conirmed, and the results showed that it has stronger inluence over run-up values when reaches values greater than 0.3. High performance correlations usingξ0 relect the efect of surf zone processes and beach characteristics
on run-up values, since the surfer similarity parameter is commonly used to describe and parameterize
wave-breaking, amount of relection, beach morphodynamic
state, among others processes.
STOCKDON et al. (2006) used data from ten diferent experiments, covering the whole range of values of ξ.
Wave parameters were obtained in shallow water and
reverse shoaled until 80 m depth, so the data from diferent
experiments could be compared. The run-up exceeded by
2% of the waves was related to the surf similarity parameter
through an equation that calculates separately setup,
mainly dominant on dissipative beaches, in accordance
with the indings presented by NIELSEN; HASLOW (1991). Finally, the authors tested their formulation using wave break height and found similar it to that obtained
using deep-water wave parameters. Nevertheless, the experiments were taken in exposed beaches and may not guarantee the equations’ prediction capability in sheltered areas.
BONETTI et al. (2012) performed a calibration of the NIELSEN; HANSLOW (1991) model at Itapocorói
Bay on Southern coast of Brazil. The work was based on wave data (at 17m depth) and runup measured in
diferent zones along an embayed beach (from exposed
to sheltered zone). Through a linear regression between the run-up measured and the run-up calculated with
NIELSEN; HANSLOW (1991) formula, the authors
found that such parametrization better explains run-up on
the exposed sectors, while lower correlation was veriied
in the sheltered zones. These results highlight the need of
appropriate run-up predictors in zones where difraction
can be a relevant process.
Because of shallow water wave transformation around
the beach boundaries, headland-bay beaches (KLEIN et al., 2010; LOUREIRO et al., 2013), show strong longitudinal
gradients of wave energy, beach grain size and beach face slope. Despite of that, all formulations presented until
the date (except for the site-speciic calibration proposed by BONETTI et al. (2012)), are applicable to exposed
beaches, but have strong limitation if applied to sheltered
areas where the difraction plays a signiicant role.
Based on the information presented above, it is clear
that much efort was made in the past few decades to
accurately predict run-up values on beaches and a large
range of formulas were proposed. Even though, the lack
of studies aiming to assess the run-up on sheltered areas is evident. This paper investigates the run-up on headland bay beaches using the data collected in Itapocorói Bay,
Southern Brasil (same data presented by BONETTI et al., 2012). The observations were tested against existing
formulations and a new empirical formulation relating run-up to wave conditions at break locations is presented. This approach is appropriate to embayed beaches where the wave attenuation present high variability alongshore.
Study Area
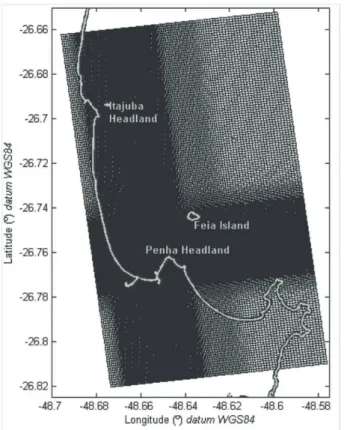
The data used in this work were collected at Itapocorói
Bay, located in the central-north coast of Santa Catarina, southern Brazil, extending from Penha to Itajuba headlands
(see Figure 1). The Itapocorói Bay is approximately 9 Km
long and includes Alegre (in the south, sheltered by the
headland), Piçarras (central part of the bay) and Itajuba
beaches (the most exposed part in the north of the bay).
At Santa Catarina coast, the waves are predominantly
from the south with periods of 12 s, followed by waves
from the east with periods of 8 s. VIEIRA DA SILVA et al (2016) demonstrate that the bimodal wave conditions
are important, especially at coastlines with variable
orientation. According to ARAÚJO et al. (2003) bimodal (south and east) sea conditions occur during >30% of the time. Wave heights averages from 1 to 1.5 m and Ho
(deep water wave height) can exceed 4 m. During the
austral autumn and winter (March to August), swell waves
from south prevail over easterly seas, while in summer
(December to February) there is a balance between both,
and during the spring easterly seas are predominant. Itapocory Bay presents a microtidal regime, with a predominantly semidiurnal pattern with diurnal inequalities. The mean elevation of spring tide in Santa
Catarina state ranges from 0.46 m to 1.06 m (TRUCCOLO et al., 2004). Meteorological forcing can elevate water level for periods of three to ten days (CASTRO; LEE, 1995) with extreme values observed during winter and
spring seasons. The mean elevation of storm surges is
around 1 m (TRUCCOLO et al., 2004).
KLEIN; MENEZES (2001) classiied the diferent
sectors of the Itapocorói Bay regarding morphodynamic state and exposure to waves. According to that study, the
Itapocorói Bay varies from relective in its exposed part (Itajuba to Central) to low tide terrace in sheltered areas (Alegre). The beachface slope is around 7° at Itajuba beach, 4.95° at Piçarras beach and 4.6° at Alegre beach. The sediments comprise ine to coarse sand, increasing in grain size northward (KLEIN; MENEZES, 2001; ARAÚJO et al., 2010).
METHODS
To assess the wave run-up on an embayed beach a methodology composed of four steps was conducted: 1)
Field work to measure waves, wave run-up and beach
Figure 1. Location of the study area on the Southern Brazilian coastal zone. It is also indicates
ADCPs (STs), wave run-up, beach proile measurement and RTK and ruler positions.
Run-up and Morphodynamic experiment
A 34 day-long experiment was run to measure wave
regime, wave run-up, and beach morphology. Figure 1
presents a summary of waves, wave run-up and beach
proile measurement locations.
Wave Measurement
From August 19th to September 22nd, three ADCP
Nortek™ model AWAC™ were moored at Itapocorói Bay Figure 1. Two 1MHz (ST001 and ST002) were moored at 3.9 and 7.3 m water depth, respectively and one 600 kHz (ST003) at 16.8 m. The equipment was installed on the
seabed upward-looking and were set to measure pressure
at every 30 minutes in order to establish tide data and record waves every hour with a 20 minute sample rate of 4 Hz (0.25s) at ST001 and ST002 and 2 Hz (0.5 s) at ST003.
The equipment used the Acoustic Surface Tracking (AST) system that measures the actual position of the surface at high frequency leading to more accurate measurements if compared to pressure instruments.
Wave parameters (height, period and direction) and orbital velocity near the surface were obtained by the
AST system. The data were processed in STORM™. Following the standard post-processing, the spikes were removed (mean ± 4σ, representing 0.006% of the dataset
considering a normal distribution).
Wave Run-up
Between August 20th and September 21st, (19 ield
work days), during the time the AWAC™ was measuring
waves, the wave run-up height was measured at Itapocorói
20th, 22th, 24th, 26th, 29th and 31st, in September on 2nd,
5th, 12th, 14th, 16th, 19th and 21th. Firstly seven points
of measurement were chosen in order to have data in
both, protected and exposed areas. From September 12th
a new point was added in order to ill the gap between measurement points (see Figure 1). A base station was
deployed to enable real time data collection using a roving
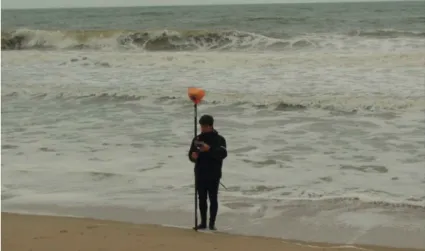
staf. At each point the maximum up-rush of each wave was measured during a 30 minute campaign (Figure 2).
The data were collected refered to the Imbituba vertical
datum - default reference level in Brazil = approximatelly
mean sea level at Imbituba, city located 170 km South - 28°14’S, 48°40’W - of study area), therefore, it was
necessary to correct the measured elevations to the still
water level, as proposed by HOLMAN (1986). To do that, the AWAC™ pressure time series were used. The mean
sea level (equal to Imbituba vertical datum mean sea
level) was assumed to be equal to the mean sea level of the 34 days of mooring. The instantaneous sea level was subtracted from the instantaneous wave run-up to derive the wave run-up with respect to still water level.
Topography
At the same location and each time that wave run-up
measurements were conducted, a sub-aerial beach proile was measured using a Total Station TOPCON GPT-7500.
The total station was placed where it could see two known points, enabling triangulation to obtain its position. To
survey exactly the same proile the azimuth of each proile was deined and stakes were placed to guide the surveyor.
The data were post-processed and reduced to Imbituba
vertical datum. The proile data was used to calculate the
beach face slope.
Bathymetry
Bathymetric data were obtained on November 2 and 6
of 2011 with a sub-metric precision Garmim GPSMAP 178c
echo sounder and a DGPS Trimble R6 (centimeter precision),
a laptop to record the data and a jetski. The equipment setup together with jetski vertical movements lead to a survey with errors < 1 m. The Survey plan covered an approximate length of 300 km over an area of approximately 70 km² with 300 m spacing between lines in the more exposed north of the bay and 100 m in the more protected south and around the islands. A DGPS was used in a PPK (Post Processed Kinematic) mode to post-correct the position based on two IBGE Continuum Monitoring Brazilian Network of GNSS Systems bases located 160 km south (Imbituba) and 150 km north of the study area (Curitiba). During the measurements, a gauge was installed at Picarras Inlet (200 m from the furthest part of the West jetty) so the tide inluence
could be post-corrected. Spikes were taken out of the data visually considering the neighboring data. Two lines that presented several inconsistencies were discarded. As a heave compensator was not available in the survey, the height
frequency oscillations caused by waves were iltered using a low-pass ilter of 7th order (considering 7 samples) for all
surveyed lines. All bathymetry were collected in WGS-84
horizontal datum and referred to IBGE vertical datum.
Tests of Existing Formulations
In order to assess the performance of previous published empirical models, run-up data from the Itapocorói Bay tests were compared with predicted run-up.
The wave run-up was measured and R2% was calculated to
compare the results using the following formulae:
a) NIELSEN; HANSLOW (1991) b) STOCKDON et al. (2006) c) GUZA; THORTON (1982)
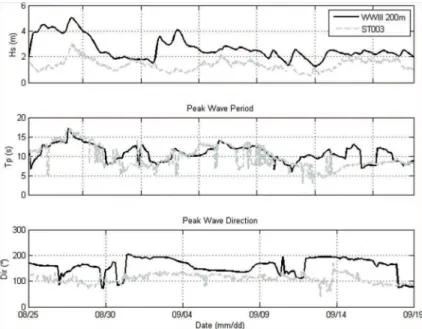
To calculate run-up with GUZA; THORTON (1982) formula, the wave height measured at station ST003 during the ield experiment described above were used (see Figure 1). On the other hand, both NIELSEN; HANSLOW (1991) and STOCKDON et al. (2006) formulas require
wave height and length values at deep water. Therefore, deep water wave parameters for the study period were obtained from the WW3 model. The deep-water data was
from a 200m depth point seaward of the study area (X: -46.6324 Y:-26.6107). The wave data time series of these points are shown in Figure 3:
The existing models to calculate the run-up exceeded
by 2% of the waves were then applied to each run-up
measurement point in Itapocorói Bay.
Numerical modeling
To assess the wave data over the entire bay, it was necessary to conduct a wave modeling study. The bathymetry used consisted of the bathymetry presented above extended seaward
using nautical chart number 1809 from DHN (Directorate of
Hydrography and Navigation - Brazilian Navy). All the source data were referred to Imbituba vertical datum. A spherical
coordinate grid (Figure 4) with 211 x 306 elements with space-varying resolution (from approximately 210x210 m in deeper
parts to 20x20 m closer to the beach) was used for modeling wave transformation using SWAN (BOOIJ et al., 1999). The grid was extended to consider the efects of refraction and
wave attenuation generated by southern headland.
The ST003 full directional spectrum obtained from AWAC™ ST003 consisted of a matrix of energy density for each time with 48 frequency bins and 90 directional bins. The ADCP output ile was transformed into a SWAN input ile, to run the model. The model considered 90 direction bins and 48 frequency bins as well as depth-induced breaking, bottom friction, difraction, refraction and frequency shift.
The calibration parameters used are presented in Table 1.
From the calibrated wave model, the breaker wave height was identiied as the point at cross-shore transects along beach where the Hs/depth ratio reaches a value of 0.5 (BERTIN et al., 2008; HARLEY et al., 2011). Transects
were taken perpendicular to the coast in front of the points where the run-up measurements were conducted. At each
transect, the break point was identiied as a point where the ratio of 0.5 (Hs/depth) is reached.
RESULTS AND DISCUSSION
Run-up and Morphodynamic Experiment
Waves
No signal-to-noise data presented a ratio lower than
30, so all data was considered of good quality. After that
Figure 4. Wave grid used in SWAN wave-modeling exercise.
Table 1. Calibration Parameters used in SWAN model.
Parameter Value
Depth-induced Breaking (B&J model) alpha 1 Depth-induced Breaking (B&J model) Gamma 0.73
JONSWAP Bottom Friction 0.04
Difraction Smoothing coef. 0.2
Difraction Smoothing steps 5
analysis and after the qualiication procedure described above, the inal timeseries for all three ACDP’s were plotted (Figure 5). After the post-processing the amount of recovered data for all ACDP’s was higher than 95% of
total possible data.
Wave parameters from ST003 were propagated and it
was possible to notice that during the measurements when
there was bimodal wave ield (i.e. more energetic waves from
south and less energetic waves from east) the calibration was poor. This occurs because the peak direction would normally be from south, however, for the protected southern part of
the bay, the southerly waves are refracted/difracted as they
pass Penha headland and are considerably reduced in energy. The less energetic waves from east do not lose energy due to
refraction/difraction and reach the southern part of the bay
with higher energy than would be considered by a theoretical
spectrum shape such as JONSWAP.
The ST003 station received the highest waves (up to 3 m) during the study period. Waves at ST002 were approximately 50% smaller as it is at a more protected area, and at ST001, waves were even smaller (around 50% of ST002 height).
Wave direction analysis indicated that waves were refracted/
difracted as they entered the bay, varying in direction from ~110° (ST03) to ~80° (ST02) and ~0° (ST01). On August 26th the mean wave period in ST003 was around 7 s, although, ST001 and ST002 presented a mean wave period of approximately 5 s. That is again because of a bimodal
condition (shorter period easterly waves together with longer
period SE waves). Southeast waves that reach ST003 lose
a considerable amount of energy due to refraction (bottom)
and difraction (Penha headland) as they propagate towards ST001 and ST002. On the other hand, easterly waves lose less energy due to refraction/difraction processes as they propagate towards ST01 and ST02.
Wave Run-up
Figure 5. Measured wave parameter time series acquired with moored ADCP in Itapocorói Bay at
depths of 3.9 m (ST001), 7.3 m (ST002) and 16.8 m (ST003).
Figure 6. Example of run-up measured at each beach proile (igure 3) referenced to Imbituba vertical datum, tide
level and corrected run-up (above still water level) for September, 9th, 2011.
the time of the measurement, the y-axis represents the
run-up level (tide, measured and corrected run-run-up). Each dot
represents one measured run-up event reduced to Imbituba
datum. Crosses refer to corrected run-up relative to still
water level (Reducing the wave run-up to still water level
datum is important in order to discount the inluence of
the tide in wave up heights). It is clear that the run-up heights range increase in more exposed sections of the beach. In the protected part of the bay, the waves are more
than 50% smaller than the exposed section, so the range of wave run-up is also smaller (0.25-0.7 m), than on exposed parts of the beach (1-1.5 m).
Beach profile
Topographic data were used to obtain the beach face
slope. Figure 7 presents the beach proile measurements
during the study period. The beach face slope was measured between the lowest and highest wave run-up at each site, and the tangent calculated for the intervening section.
Tests of existing run-up formulae
Figure 8 shows the relation between the values of signiicant run-up (the run-up exceeded by 1/3 of waves - Rs)
Figure 7. Monitoring of the morphological variations of the beach face slope at eight locations along Itapocorói Bay.
Figure 8. Comparison between observed signiicant wave run-up and the signiicant wave run-up calculated with
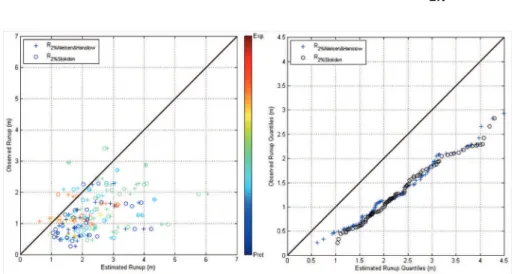
HANSLOW (1991) formulations, and the signiicant run-up measured. Figure 9 compares the R2% run-up calculated
using NIELSEN; HANSLOW (1991) and STOCKDON et al. (2006). The graphs show an overestimation of the
values of Rs and RSig by available formulation for the
study area, especially at sheltered zone. Table 2 presents
statistical parameters of the analysis. The signiicant wave run-up calculated by NIELSEN; HANSLOW (1991) formula were statistically diferent from the measured data. The GUZA; THORTON (1982) formula, on the other hand, was not statistically diferent to measured data with a signiicance level of 5%. The NIELSEN; HANSLOW
(1991) formula tends to overestimate the run-up. While
GUZA; THORTON’s (1982) formula represents run-up between 0.5 and 1.2 m quite well it underestimates values lower than 0.5 and overestimates values higher than 1.2 m. The formulae of NIELSEN; HANSLOW (1991) and STOCKDON et al. (2006) presented similar predictions of run-up 2%, although, both formulae overrestimated R2% for all measured data. For both formulae, with a level of signiicance of 0.05, the means are statistically diferent
from the measured data.
Considering that none of the tested equations its the
measured data, a new approach was taken that may be more applicable in embayed beaches.
A wave run-up formula suitable for either protected or exposed areas was developed using post- refraction /
difraction wave parameters, since these lead to variable
wave heights along the bay (higher waves in exposed areas and smaller in protected areas). Breaker wave parameters are the more adequate to analyze wave run-up since at the break point the wave has already undergone most of the refraction
and difraction processes. Considering that wave run-up
is a function of wave height, wave length and beach slope
(HUNT, 1959; NIELSEN; HANSLOW, 1991; RUGGIERO et al., 2004; STOCKDON et al. 2006), the wave data obtained
from calibrated numerical simulations were used to calculate the surf similarity parameter according to:
Figure 9. Comparison between observed R2% and the R2% calculated with the formulae of NIELSEN;
HANSLOW (1991) - crosses and STOCKDON et al. (2006) - circles. (a) R2% wave run-up; (b) quantile/quantile.
Table 2. Tested formulae versus measured data: statistical parameters.
Formula Data Quantile
r R² RMSE P r R² RMSE p
Rsig NIELSEN; HANSLOW (1991) 0.28 0.08 1.01 4.54E-11 0.99 0.98 0.69 1.61E-11
Rsig GUZA; THORTON (1982) 0.28 0.08 0.58 0.17 0.96 0.92 0.28 0.16
R2% NIELSEN; HANSLOW (1991) 0.39 0.15 1.36 1.10E-14 0.99 0.98 1.07 2.56E-15
R2% STOCKDON et al. (2006) 0.37 0.14 1.40 1.26E-16 0.99 0.99 1.11 1.89E-17
/ tan
H L b
b 0
p = b
where is Hb the mean 1/3 highest waves at break, Lo and L0 is the deep water wave length.
Figure 10. SWAN calibration at ST001.
where g is the gravity and T is the mean wave period. The surf similarity parameter and wave height were considered the main parameters to assess wave run-up, therefore it were plotted against measured R2% and the linear
coeicients were adjusted to it the data. Furthermore, a
quantile-quantile analysis was preformed to analyze the accuracy of the formula. To analyze the results four statistical
parameters were applied: 1) Pearson coeicient (r) to identify
the correlation between predicted and measured data; 2)
Coeicient of determination (R²) to analyze how well the data its the model; 3) RMSE to access the error of the model
and; 4) A student t-test was applied to test the hypothesis that both measured and calculated run-up have equal means. The
test was applied with a signiicance level of 5% and p>0.05
indicates that correlations are statistically valid.
Model results
The calibrated timeseries for ST001 and ST002 are presented in Figure 10 and Figure 11, respectively. The model presented a Hs RMSE (root mean square error) of 0.07 and a 0.09 m for ST001 and ST002; mean wave period (T) RMSE of 2.03 (ST001) and 1.2 s (ST002); and direction RMSE of 10.69 (ST001) and 9.34 ° (ST002).
New formula
Wave parameters at the breakpoint, measured
wave run-up and beach slope were used to ind a set of
formulae that its the measured data for both protected
and exposed part of an embayed beach. Table 3 presents
a summary of the best it equations for all calculated values of wave run-up and its Pearson coeicient (r), coeicient of determination (R²), RMSE. A student t-test was analyzed with a signiicance level of 5%. For all cases the Pearson coeicient, as expected, presented a positive correlation. The coeicient of determination
showed that the data may be varying along the tendency
with R² varying between 0.27 and 0.56 but the quantile
analysis showed that all the formula are very accurate
with R² of 0.98 or more in all cases. The RMSE for the data varied between 0.44 (R2%) and 0.65 (Rmax). The calculated RMSE for quantile analysis showed that all the formulae are very accurate with RMSE varying from 0.07 m for Rmean to 0.11 m for Rmax. The analysis
is considered statistically valid for all formulae for both data and its quantile.
The proposed equations provide very good predictions of wave run-up along an embayed beach
(Figure 12) as it considers wave parameters at the break
point, after the wave has already undergone refraction/ attenuation processes characteristic of embayed beaches.
The results showed that all proposed formulae it the
Figure 11. SWAN calibration at ST002.
Table 3. Proposed formulae and statistical parameters of its predictions.
Formula Data Quantile
r R² RMSE p r R² RMSE p
Rmean=Hsbξb+0.1 0.65 0.42 0.39 0.90 0.99 0.98 0.07 0.91 Rsig=1.3Hsbξb+0.1 0.52 0.27 0.57 0.73 0.99 0.99 0.09 0.72
R2%=1.35Hsbξb+0.32 0.75 0.56 0.44 0.93 0.99 0.98 0.09 0.92
Rmax=1.6Hsbξb+0.35 0.59 0.35 0.65 0.84 0.99 0.98 0.11 0.85
Figure 12. Estimated wave run-up vs observed wave run-up (left) and its quantiles (right) for mean (square),
CONCLUSION
On protected beaches the available formulae to predict
Rsig and R2% are not in good agreement with wave
run-up measured. That is due to reliance on wave deep water
parameters that do not relect conditions in embayed
beaches where shallow water transformations create strong wave-energy variations along the beach.
This paper presents formulae to calculate run-up for embayed beaches. The formulae are based on measured
data from intensive ield work, and, are presented as
appropriate for other embayed beaches. In contrast to the other formulae that use deepwater wave parameters, the formulae presented here are suitable for beaches where the wave conditions vary alongshore. It considers waves that have already passed through most transformation processes
such as refraction and difraction before reaching the break point. For that reason the proposed formula its the entire
bay and does not overestimate the wave run-up on sheltered parts of the beach or underestimate in exposed areas.
The proposed formula is in good agreement with measured data for a variety of wave conditions and degrees of protection. The analysis demonstrates that even with R²
varying from 0.52 to 0.75, the measured distribution of
measured and modeled wave run-up are very consistent,
as shown by quantile/quantile analysis with R² of 0.98 to 0.99. The individual run-up errors may be related to errors
of measurements, modeling and to non-linear processes that swash zone is exposed to, such as infragravity waves.
ACKNOWLEDGEMENTS
The authors are very thankful to CNPq-CTTrans Proc. No.575008/2008-3, CNPq Research Productivity Scholarship, CAPES-RISCOS for a scholarship, PPGEO-UFRGS, PPGG-UFSC, UNIVALI for all ield support, CB&I Brazil for ADCP mooring and data processing support, “Anjos do Mar” for jetski bathymetry support, to all the team that worked at the ield: Ácmon Bhering, Alexandre Schweitzer, Camila Longarete, Diego Bitencourt, Francisco Travassos, Felipe Amorim, Jonas Oliveira, José Neto, Mar Alfaro, Marcos Berribilli, Michel
Prado. Without this support this paper would not have been possible.
REFERENCES
AHRENS, J. P.; TITUS, M. F. Wave runup formulas for smooth slopes. J. Wat. Port, Coast. Ocean. Eng., v. 111, n. 1, p.
128-133, 1985.
ARAÚJO, C. E. S.; FRANCO, D.; MELO, E.; PIMENTA, E. Wave regime characteristics of the southern Brazilian coast. In: International Conference on Coastal and Port Engineering in Developing Countries, 6., 2003, Colombo,
Sri Lanka. Proceedings. Colombo: COPEDEC VI, 2003. 15 CD-ROM.
ARAÚJO, R. S.; SPROVIERI, F. C.; FREITAS, D.; KLEIN, A. H. F. Variação da morfologia praial e identiicação de zonas de erosão acentuada (ZEA) na enseada do Itapocorói - SC.
Braz. J. Aquat. Sci. Technol., v. 14, n. 1, p. 29-38, 2010.
BATTJES, J. A. Computation of set-up, longshore currents, run-up and overtopping due to wind-generated waves. 1974. 251f. Thesis (Doctoral) - Committee on Hydraulics. Civil Engineering and Geoscience, Delft University of Technology. Delft, 1974. http://repository.tudelft.nl/islandora/object/ uuid:e126e043-a858-4e58-b4c7-8a7bc5be1a44?collection=r esearch
BATTJES, J.A.; JANSSEN, J.P.F.M. Energy loss and set-up due to breaking of random waves. Proc. Coast. Eng., ASCE, p. 569-587, 1978.
BERTIN, X.; CASTELLE, B. O.; CHAURNILLON, E.; BUTEL, R.; QUIQUE, R. Longshore transport estimation and inter-annual variability at a high-energy dissipative beach: St. Trojan beach, SW Oléron Island, France. Cont. Shelf Res., v. 28, n. 10-11, p. 1316-1332, 2008.
BONETTI, J.; KLEIN, A. H. F.; MULER, M.; DE LUCA, C. B.; SILVA, G. V.; TOLDO JR., E. E.; GONZÁLEZ, M. Spatial and numerical methodologies on coastal erosion and looding risk asserssment. In: FINKL, C. (Ed.). Coastal hazards. Chapter 16. Coastal Research Library Series. Dordrecht:
Springer, 2012. p. 423-442.
BOOIJ, N.; RIS, R. C.; HOLTHUIJSEN, L. H. A third-generation wave model for coastal regions: 1. Model description and validation. J. Geoph. Res., v. 104, n. C4, p. 7649-7666, 1999.
CASTRO, B. M.; LEE, T. N. Wind-forced sea level variability on the southeast Brazilian shelf. J. Geoph. Res., v. 100, n. C8, p.
16045-16056. 1995.
GUZA, R. T.; THORTON, E. B. Swash oscillations on a natural beach. J. Geoph. Res., v. 87, n. C1, p. 483-491. 1982.
HARLEY, M. D.; TURNER, I. L.; SHORT, A. D.; RANASINGHE, R. A reevaluation of coastal embayment rotation: The dominance of cross-shore versus alongshore sediment transport processes, Collaroy-Narrabeen Beach, Southeast Australia. J. Geoph. Res., v. 116, F04033, 2011.
HOLMAN, R. A. Extreme value statistics for wave run-up on a natural beach. Coast. Eng., v. 9, n. 6, p. 527-544. 1986.
HEDGES, T. S.; MASE, H. Modiied Hunt´s equation incorporating wave setup. J. Wat. Port Coast. Ocean. Eng. v. 130, n. 3, p. 109-113, 2004.
HOLLAND, K. T.; RAUBENHEIMER, B.; GUZA, R. T., HOLMAN, R. A. Runup kinematics on a natural beach. J. Geoph. Res., v. 100, n. C3, p. 4985-4993, 1995
HOLMAN, R. A. Extreme value statistics for wave runup on a natural beach. Coast. Eng., v. 9, n. 6, p. 527-544, 1986.
HOLMAN, R. A.; SALLENGER JR, A. H. Setup and swash on a natural beach. J. Geoph. Res., v. 90, n. C1, p. 945-953, 1985.
HUNT, I. A. Design of seawalls and breakwaters. J. Wat. Harb. Div., v. 85, p. 123-152, 1959.
KLEIN, A. H. F.; MENEZES, J. T. Beach morphodynamics and proile sequence for headland bay coast. J. Coast. Res., v. 17 n. 4, p. 812-835, 2001.
KLEIN, A. H. F.; FERREIRA, Ó.; DIAS, J. M. A.; TESSLER, M. G.; SILVEIRA, L. F.; BENEDET, L.; DE MENEZES, J. T.; DE ABREU, J. G. N. Morphodynamics of structurally controlled headland-bay beaches in southeastern Brazil: A review. Coast. Eng., v. 57, n. 2, p. 98-111, 2010.
LONGO, S.; PETTI, M.; LOSADA, I. J. Turbulence in the swash and surf zones: a review. Coast. Eng., v. 45, n. 3-4, p.
129-147, 2002.
LOUREIRO, C.; FERREIRA, O.; COOPER, J. A. G. Applicability of parametric beach morphodynamic state classiication on embayed beaches. Mar. Geo., v. 346, p. 153-164, 2013. NIELSEN, P. Wave setup and runup: An integrated approach.
Coast. Eng., v. 13, n. 1, p. 1-9, 1989.
NIELSEN, P.; HANSLOW, D. J. Wave runup distributions on natural beaches. J. Coast. Res., v. 7, n. 4, p. 1139-1152, 1991.
RUGGIERO, P.; HOLMAN, R. A.; BEACH, R. A. Wave run-up on a high-energy dissipative beach. J. Geoph. Res., v. 109,
n. C6, 2004.
STOCKDON, H. F.; HOLMAN, R. A.; HOWD, P. A.; SALLENGER JR, A. H. Empirical parametrization of setup, swash and runup. Coast. Eng., v. 53, n. 7, p. 573-588, 2006.
TRUCCOLO, E. C.; FRANCO, D.; SCHETTINI, C. A. F. The low frequency sea level oscillations in the Northern Coast of Santa Catarina, Brazil. J. Coast. Res., SI 39, p. 547-552, 2004.