0103 - 5053 $6.00+0.00
A
r
ti
c
le
* e-mail: [email protected]
Electrodeposition of Ni–Mo and Fe-Mo Alloys from Sulfate-Citrate Acid Solutions
Luciana S. Sanches a, Sergio H. Domingues a, Ademir Carubelli a and Lucia H. Mascaro*,b
a
Departamento de Química, Universidade Federal do Paraná, Centro Politécnico, 81531-990 Curitiba - PR, Brazil
b
Departamento de Química, Universidade Federal de São Carlos, CP 676, 13565-905 São Carlos - SP, Brazil
Neste trabalho estudou-se a eletrodeposição de ligas de Fe-Mo e Ni-Mo sobre eletrodos de Pt em meio de citrato de sódio em pH 4,0. O comportamento das ligas foi avaliado por voltametria ciclica em diferentes razões dos íon metálicos. Os depósitos foram caracterizados por MEV, EDX e difração de raios-X. Nos voltamogramas cíclicos os picos de dissolução só aparecem para soluções com maior concentração de íons Fe ou Ni. Análises de MEV mostraram morfologias diferentes para as duas ligas estudadas sendo que as de Ni-Mo são mais uniformes e espessas. O conteúdo de Mo e O nas ligas Ni-Mo é maior do que na de Fe-Mo. A deposição das ligas de Ni-Mo é do tipo anômala.
This paper reports on a study of the electrodeposition of Ni-Mo and Fe-Mo alloys on Pt electrodes in a sodium citrate solution at pH 4.0. The alloys were subjected to cyclic voltammetry at different ion concentration ratios to identify their behavior. The electrodeposited coatings were analyzed by SEM, EDX and XRD. The results of the cyclic voltammetry tests indicated the presence of dissolution peaks only with high Ni or Fe ion concentrations. The SEM analysis revealed that the two alloys had dissimilar morphologies and the Ni-Mo alloys were homogeneous and thick. The Mo and O contents were higher in the Ni-Mo than in the Fe-Mo alloys. Anomalous deposition was found to occur in the co-deposition of Ni and Mo.
Keywords: electrodeposition, Ni-Mo alloys, Fe-Mo alloys
Introduction
Alloy electrodeposition is widely employed in the production of new materials for applications requiring
specific mechanical, chemical and physical properties.1,2
Investigations of the electrodeposition of Fe and Ni alloys have been carried out mainly to identify the ability of these alloys to display stable, beneficial magnetic
properties at room temperature.3,4 Fe and Ni alloy deposits
are used in the electronic industry for memory devices 5,6
and for hydrogen evolution reactions (HER).7-10 Good
electrocatalytic properties for HER have been found in
binary alloys of Ni, Co, or Fe and Mo, W or V.11 In this
context, the electrodeposition of Mo alloys with Fe-group metals has gained increasing importance in recent years, mainly due to these alloys’ magnetic and electrocatalytic properties.
Apparently Mo cannot be electroplated from an
aqueous solution, but its alloys can be electroplated.12,13
Hence, it is possible to induce the co-deposition of Mo
with Fe-group metals.14-19 The Co-Mo system is an example
of induced co-deposition. An investigation of its induced discharge process is essential to correlate the coating properties with conditions of electrodeposition. The presence of polycarboxylates is required in
electro-deposition baths18 if one wishes to get co-deposited Mo
alloys of Fe-group metals. In many cases, citrate has been selected to establish the electrodeposition conditions that lead to homogeneous Co-Mo deposits of variable composition. Citrate in the electrolytes assures a stable
pH during the deposition process.18
Many investigations into Mo induced co-deposition have focused on the deposition of Ni–Mo alloys. This
alloy is highly corrosion and wear-resistant.20 Furthermore,
it presents a low hydrogen evolution overpotential.21
However, the co-deposition mechanism of Ni–Mo alloys has not yet been completely elucidated. Several
hypo-theses have been proposed 22,23 and many investigations
have involved the possible multi-step reduction of some Mo chemical species.
surface-adsorbed intermediate, [Ni (II) LMoO2]ads, where L is a
ligand such as citrate.14-16 Zeng et al.12,23 studied the
co-deposition mechanism in the electroco-deposition of Ni–Mo
alloys by applying methods of in situ surface Raman
spectroscopy. Their experimental results showed that, in a
NiSO4-free solution, molybdate could only be reduced to
a mixture of polyvalent Mo oxides and/or hydroxide.
Meanwhile, in the case of NiSO4 coexisting in solution,
molybdate is first reduced to Mo (IV) oxide, which, as an
intermediate, subsequently is reduced to Mo in alloy under the catalysis induced by Ni. The governing features of the induced co-deposition mechanism included soluble nickel acting as a catalyst to the molybdenum deposition and the generation of an absorbed intermediate species on the
electrode surface.15
Although the induced electrodeposition of Fe–Mo alloy has not been studied extensively, it is known that the substitution of nickel by Fe dramatically lowers the
deposition rate of molybdenum.17,24 These phenomena are
described by a mathematical model, which assumes that iron-group species can become adsorbed on the electrode surface, competing with the intermediate molybdenum for free surface sites. Thus, the partially diminished current density of Mo in Fe-containing electrolytes can be explained by a blocking mechanism caused by the adsorbed intermediate Fe. However, further investigations and information are required for a better understanding of the induced co-deposition of Mo with alloy groups.
Considering the statements above, which involve several distinct observations on the compositions and mechanism of induced Mo co-deposition, it is evident that much work is still needed to understand this complex system. A major source of controversy is the fact that, at different deposition rates, a variety of structures can be formed on the electrode surface. Therefore, this paper reports on a study of Ni-Mo and Fe-Mo alloys subjected to cyclic voltammetry and characterized by X-ray diffraction, scanning electron microscopy and X-ray microanalysis.
Experimental
Electrochemical experiments were performed in a conventional three-electrode cell controlled by a microcomputer-controlled MICROQUÍMICA model MQPG01 potentiostat/galvanostat. The chemicals used,
FeSO4·6H2O, NiSO4·7H2 O, Na2MoO4 ·2H2O, and
Na3C6H5O7·2H2O, were all of analytical grade. All the
chemical solutions were freshly prepared with very low conductance water, purified in a Millipore Milli-Q system. The electrolytic compositions used in all the electro-chemical tests are listed in Table 1. In all experiments, the temperature was kept at 25 °C and the electrolyte pH was always adjusted to 4.0 with a citric acid solution.
The surface morphology of the electrodeposits was analyzed under a Philips XL-30 scanning electron microscope (SEM). The quantitative chemical analyses of the alloys were performed by energy dispersive X-ray (EDX) using a QX 2000 (Link Analytical). The alloys phase structure was analyzed by X-ray diffraction (XRD) with a Philips MRD diffractometer.
Platinum discs (0.196 cm2) were used as working
electrodes (WE). Pt foils were used in the specific preparation of electrodeposits destined for diffraction and SEM analyses. Before each experiment, the electrodes were polished to a mirror finish with alumna polishing powder and then ultrasonically cleaned for 2 min in pure water. The reference electrode was a saturated calomel electrode (SCE) assembled in a lugging capillary end tube filled with NaCl solution. The counter electrode (CE) was a large surface platinum spiral wire.
The voltammetric experiments were conducted at 5 and
50 mV s-1, initially scanning towards negative potentials up
to different cathodic limit potentials between –1.0 at –1.8 V. This was followed by a positive sweep up to 1.8 V. Each voltammetric experiment consisted of only one cycle.
Electrodeposits destined for XRD and SEM analysis
were obtained galvanostatically at 30 mA cm-2 for 1 and 2
Table 1. Concentrations of Ni (II), Fe (II) and Mo (VI) and their molar ratio in the electrolyte used for electrodeposition of individual metals and alloys
Bath [Ni (II)] (mol L-1) [Fe (II)] (mol L-1) [Mo (VI)] (mol L-1) [Ni (II)]/ [Mo(VI)] [Fe(II)]/ [Mo(VI)]
1 0.01 -
-2 0.01 -
-3 0.01 -
-4 0.01 - 0.01 1:1
-5 0.10 - 0.01 10:10
-6 0.01 - 0.10 01:10
-7 - 0.01 0.01 - 1:1
8 - 0.10 0.01 - 10:10
9 - 0.01 0.10 - 01:10
h under stirred solution to ensure the homogeneity of the deposit composition.
Results and Discussion
Voltammetric behavior of individual metals and alloy deposits
Cyclic voltammetry (CV) was used to define potential regions and to characterize the Ni, Fe and Mo deposition process. Figure 1 shows a series of cyclic voltammograms
taken at 50 mV s-1, representing the electrodeposition and
electrodissolution of individual metals or their alloys. The electrode used here was a stationary platinum disc
electrode in solutions of 0.01 mol L-1 Mo (VI), 0.01 mol L-1
Fe (II), 0.01 mol L-1 Ni (II) concentrations and their mixtures
in an aqueous solution of sodium citrate at pH 4.0. Figure 1a shows typical cyclic voltammograms of the deposition of Ni, Mo and Ni–Mo alloys. Two cathodic peaks at approximately 0.0 V and –1.0 V are visible in the voltammograms for all solutions. In the case of the Ni-Mo alloy depositions, the first cathodic peak can be attributed
to hydroxide Ni deposition25 and the peak at -1.0 V was
attributed to a reduction of the mixture of polyvalent
molybdenum oxides and/or hydroxide.12,18,26,27 In the case
of individualmetals, the two peaks indicate the formation
of oxide/hydroxide. Electrodeposition of pure metals or Ni-Mo alloys occurs only at more negative potentials in combination with a hydrogen evolution reaction. The beginning current of the Ni and Mo peaks approximately overlapped in the deposition of pure nickel and pure iron, as illustrated in Figure 1. Although it is expected, from the thermodynamic standpoint, that the reduction of Ni
(Erev = –0.22 V) starts at nobler potentials than Mo
(Erev = –1.05 to –0.91 V),28 this reduction is due to the
formation of a complex between metal ions with sodium
citrate.29
The cyclic voltammogram of the Ni-Mo alloys shows the characteristic crossover between cathodic branch currents, suggesting the presence of a nucleation process. The crossover can also be attributed to an autocatalytic hydrogen evolution reaction due to a significant increase in electrode roughness, as in the formation of a spongy molybdenum-based deposit or due to activation of the deposit surface through the reduction of metal oxides at these potentials. These arguments are corroborated by the evolution of hydrogen, which begins at more positive potentials in Ni-Mo deposits.
The anodic profiles of Ni and Ni-Mo are poorly defined except for the one very close to the oxygen evolution, because the electrodeposits are passivated in that medium
and these phenomena hinder the metallic dissolution.29
The cyclic voltammogram of Mo shows a small anodic peak around –0.5 V caused by an oxidation mixture of polyvalent molybdenum oxides and/or hydroxide deposited in the cathodic sweep. No attempt was made to identify all the anodic current peaks.
The cyclic voltammograms shown in Figure1b are typical for pure Fe, Mo and Fe-Mo alloys. The curve of the pure Fe shows very well defined cathodic and anodic peaks which relate to the metallic Fe deposition and
dissolution.30,31 The Fe deposition process is followed by
hydrogen evolution. A comparison of the cathodic currents
in the CVs of Figure 2b indicatesthat the current peaks of
pure Mo are higher than those of the Fe or Fe-Mo deposition. This may be interpreted as the inhibition of the formation of polyvalent molybdenum oxides and/or hydroxide when Mo is deposited in the presence of Fe.
Influence of the metal concentration
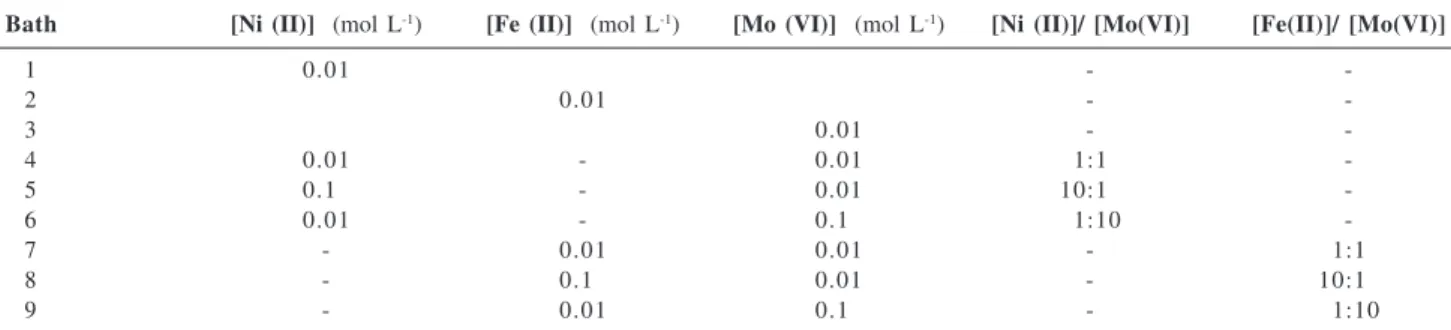
The influence of the concentration of metallic ions on the electrolyte was studied at three different ratios, as described in the experimental section. Figures 2a and 2b show the CVs obtained for Ni-Mo and Fe-Mo alloy deposition in solutions containing ion ratios of 1:1, 1:10
and 10:1. The sweep rate applied was 50 mVs-1.
Figure 2a shows that cathodic process was strongly influenced by the concentration of the deposition solution. Cathodic peak potentials appeared at –0.78 V for the 1:1 ratio; at –0.61V and –1.38 V for the 10:1 ratio and at –1.0 V for the 1:10 ratio solution. Therefore, when the concentration of Mo(VI) increased, the peak shifted to a more negative potential and, conversely, when the concentration of Ni(II) increased, the peak shifted to a more positive potential. These results were expected, since the reduction potential of Mo is about 0.8 V more negative
than that of Ni. Therefore, as the Mo ion concentration increases, the contributing current from Ni is expected to decrease, indicating the possibility of obtaining alloys
containing larger amounts of Mo.32 Figure 2a also shows
that the hydrogen evolution current begins at a more anodic potential in a 1:10 ratio solution, possibly indicating that the alloy promotes the evolution of hydrogen. A second cathodic peak at -1.45 V was recorded for the 10:1 Ni:Mo, in which, according to the literature, molybdate is first reduced to Mo (IV) oxide as an intermediate and subsequently reduced to molybdenum in alloy under the
catalysis of inducing nickel.12 The voltammetric curves
show no characteristic peaks for oxidation, even at 1:1 or 1:10 Ni–Mo ratio solutions. A broad anodic peak is visible in the voltammograms for the 10:1 ratio solution, which relates to the second cathodic peak displayed in the cathodic sweep, as will be discussed later.
The cathodic and anodic peak charges obtained in the CV tests were calculated. The cathodic potential range identified was the potential at which the cathodic current is zero up to the exponential increase of the current (hydrogen current). The anodic charge considered was related to a dissolution peak ranging from -0.75 to 0.7 V. The cathodic charges were: 9.9; 34.0 and 7.4 mC for ratios of 1:1; 10:1 and 1:10, respectively, and the anodic charge for a 10:1 ratio was 12.5 mC. These results led to the conclusion that increasing the Ni(II) concentration facilitates the deposition process and increases the thickness of films. The anodic charge was lower than the cathodic charge, but current efficiencies cannot be discussed here due to the passivation deposits, which prevented the complete dissolution of deposits.
A similar analysis was made for the Fe-Mo alloys, whose CVs are shown in Figure 2b. The cathodic peak potentials showed -0.70 V for 1:1; -1.2 V and -1.36 V for 10:1 and -1.0 V for 1:10 ratio solutions. It can be observed that, in the case of Ni-Mo, when the Mo (VI) concentration increased, the cathodic peak shifted to a more negative potential. When the Fe (II) concentration (at a 10:1 ratio) increased, the cathodic peak shifted to a more negative potential than with other solution ratios and its current contribution increased. One reasonable explanation for this case is that a higher concentration of Fe ions inhibits the formation of Mo (IV) oxide and that Mo (VI) is reduced directly to
molybdenum in alloy form, i.e., Fe(II) lowers the deposition
rate of molybdenum.17,24 The voltammetric curves in the
1:10 Fe–Mo ratio solution showed no characteristic oxidation peaks. At a 10:1 ratio, a well-defined anodic peak
is visible at -0.27 V, which is attributed to Fe dissolution.30,31
The cathodic and anodic charges revealed by CV for Fe-Mo were also calculated for Ni-Mo and the potential
ranges used to calculate the charges were taken in the same manner. The cathodic charges were: 12.1; 30.1 and 10.6 mC, respectively, for ratios of 1:1; 10:1 and 1:10, while the anodic charges were 2.7 for a 1:1 ratio and 26.1 mC for a 10:1 ratio. Again, the increased Fe(II) concen-tration facilitated the deposition process, leading to films with greater thickness. The anodic charge was lower than the cathodic charge, but the anodic-cathodic charge ratio was higher than Ni-Mo in the same proportion (10:1), indicating that passivation deposits did not occur in the absence of Ni.
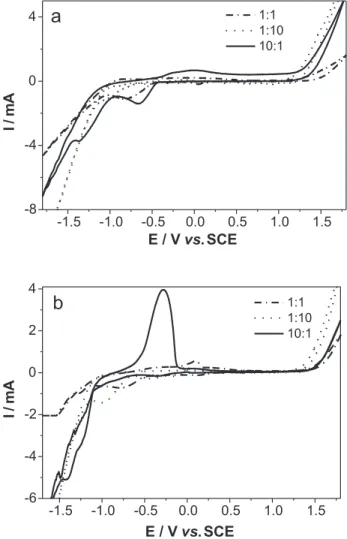
Influence of the negative potential limit
The influence of the negative potential limit on the anodic dissolution peak was investigated in Ni-Mo and Fe-Mo alloys. Figure 3a shows a set of voltammograms
corresponding to the Ni-Mo deposition from 0.1:0.01 mol L-1
or lower limits of -0.5, -1.2, -1.5 and -1.8 V, at 5 mV s-1. The
CVs obtained at relatively low overpotentials did not
display an anodic process. Upon decreasing the lower limit, a clear reduction developed in two peaks, followed by hydrogen evolution. At all the negative limits, the crossover at zero current took place at the same potential.
With regard to the oxidation features, only one oxidation peak centered at around 0.25 V was obtained when the negative scan was reversed after the second reduction peak. The oxidation peak current increased when the limit was rendered more negative, demonstrating that there is a correlation between the cathodic and anodic processes. This indicates that the electrodeposition process does not occur at potentials more positive than -1.0 V.
Figure 3b shows a set of voltammograms corresponding
to the Fe-Mo deposition from 0.1:0.01 mol L-1 for lower
limits of -0.5, -1.2, -1.5 and -1.8 V, at 5 mV s-1. The analysis
of these CVs is similar to that of the Ni-Mo. The main difference involved a second oxidation peak that appeared as a band (1.0 V) when low limit was -0.5 and -1.2 V. This process was likely due to the formation of oxide/ hydroxide, which was reduced when the potential sweep dropped to lower potentials.
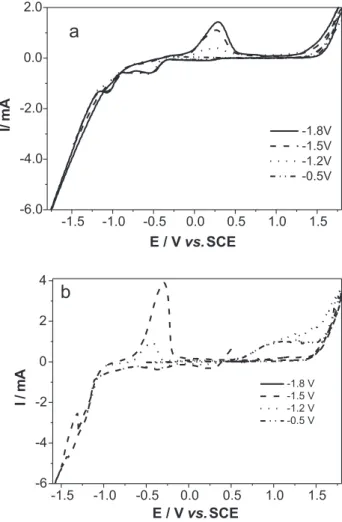
Morphology of the deposits and their surface composition
Figure 4 shows the SEM images of the Ni-Mo and Fe-Mo deposits. The samples were prepared on Pt foil electrodes from solution baths 5 and 8 (see Table-1), at
average current density of i = 30 mA.cm-2 applied for 1 h.
A clear morphological modification was observed in the different alloys. These images indicate that a globular surface and crack-free deposit was obtained with the Fe-Mo alloys (Figure 4 a). These deposits display some holes, which were attributed to hydrogen bubbles formed during co-deposition. The electrodeposited Ni-Mo, on the other hand, shows large agglomerations typical of nodular grains (Figure 4 b).
The average compositions of all the alloys were evaluated by EDX microanalysis, whose results are given in Table 2, which indicates that oxygen was detected in both the alloys coating the electrodes. Considering this finding and some results previously described in the
literature12,18,26, we concluded that metallic alloys and their
oxides were produced simultaneously during the electrochemical reduction process. Another important fact is that our EDX analyses consistently detected the Pt substrate containing Ni-Mo. However, our EDX analyses of Fe-Mo deposits did not detect the Pt substrates. The explanation for characteristic Pt lines appearing in the EDX is that the surface was not totally covered with Ni-Mo alloy. The same result for Ni-Mo deposits was also observed in the SEM images.
Another point is that the Mo content was higher in the Ni-Mo alloy than in the Fe-Mo alloys obtained by the same process. A comparison of concentration ratios in the bath with the atomic percentage of metals in deposited films reveals that the deposited Mo content was 1.7 times higher than the Ni content, even though the content of
metal ions in the bath were the same. Thus, since the less
noble metal (Mo) was deposited preferentially than the
nobler metal (Ni), we can deduce that anomalous
deposition occurred in the deposition of Ni-Mo.33 In the
case of Fe-Mo, this alloy was richer in Fe, indicating the preferential electrodeposition of Fe in the alloy (nobler metal) and, in this case, no anomalous deposition was detected.
X-ray diffraction analyses
A structural analysis of the deposits was performed by XRD. The samples for XRD analyses were prepared on Pt electrodes immersed in 5 and 8 solution baths (see Table
1) and subjected to a current density of i = –30 mA cm-2 for
1 or 2 h. The results of the XRD analyses are depicted in Figure 5, which shows small peaks characteristic of crystalline structures. The Ni-Mo and Fe-Mo alloy deposits showed a similar profile, with narrow peaks. The XRD
diffractogram corresponding to the Fe-Mo (Figure 5a)
deposition for 1 hour showed three main peaks around
2θ = 40o, 46o and 68o characteristic of Pt substrate. With
Figure 4. SEM micrograph of deposits obtained galvanostatically on Pt at -30 mA cm -2 for 1 hour in 0.01 mol L-1 Fe (II) + 0.01 mol L-1 Mo (VI) (a) and 0.01 mol L-1 Ni (II) + 0.01 mol L-1 Mo (b) solutions.
Table 2. Composition of deposit alloys obtained by microanalysis data
Element Ni-Mo alloys Fe-Mo alloys
% Atomic % Atomic
O 49.8 21.5
Ni 18.5
-Fe - 66.9
M o 31.7 11.6
longer deposition times, the intensity of the Pt peaks
decreased, showing one main broader peak around 2θ =
44°. The Ni-Mo deposits showed four main peaks around
2θ = 40°, 44o, 46o and 67o. In this case, all the recorded
peaks increased with longer deposition times. All these results are also congruent with the SEM and microanalysis results. The line intensities of Fe-Mo and Ni-Mo increased as the thickness of the deposits increased (2 h), but there was no shift in the X-ray diffraction angle, indicating that no significant structural and compositional changes occurred through the deposit’s thickness.
Conclusions
It was shown that the use of linear sweep voltammetry applied to Mo metal and alloy electrodepositions produced highly complex profiles, due to the formation of several different species on the substrate during the potential sweep. However, it can be concluded, from the voltammetric cyclic analysis, that the electrodeposition of pure metals or Ni-Mo alloys only reaches more negative potentials when in combination with a hydrogen evolution reaction. The hydrogen evolution current was catalyzed with a Ni:Mo ratio of 1:10, indicating that this alloy could be used in water electrolysis for hydrogen production. Based on the CVs of the Ni:Mo with the 10:1 ratio, it was observed that molybdate is first reduced to Mo (IV) oxide and subsequently to molybdenum in alloy under the catalysis
of inducing nickel.The increase in the concentration of
Ni(II) facilitates the deposition process, leading to films with greater thickness. Ni-Mo alloy films passivate in the deposition bath, which prevents their dissolution.
High concentrations of Fe ions inhibit the formation of Mo (IV) oxide and Mo (VI) is reduced directly to molybdenum in alloy; in other words, Fe(II) lowers the reduction of molybdenum. The EDX analyses were congruent with these results, which showed a lower O content in Fe-Mo than in Ni-Mo alloys. The presence of Fe in deposits also reduced film passivation, which is illustrated by one well-defined dissolution peak in the CV.
The SEM analysis shows a clear morphological modification in the different alloys, with Fe-Mo display some holes, which were attributed to hydrogen bubbles formed during co-deposition. The EDX microanalysis allowed us to conclude that the Ni-Mo deposition was an anomalous process. The line intensities increased as the thickness of the deposits increased, indicating that there were no significant structural and compositional changes in the deposit thickness.
Acknowledgements
Authors are indebted to Brazilian agencies CAPES/ PROCAD, CNPq, Araucária Foundation and to LACTEC for SEM analysis.
References
1. Leith, S.D.; Ramli, S.; Schwartz, D.T.; J. Electrochem. Soc.
1999, 146, 1431.
2. Leith, S.D.; Wang, W.; Schwartz, D.T.; J. Electrochem. Soc.
1999, 145, 2827.
3. Sasaki, K.Y.; Talbot, J.B.; J. Electrochem. Soc.1998, 145, 981.
4. Biallozor, S.; Lieder, M.; Surf. Technol. 1984, 21, 1. 5. Kieling, V.C.; Surf. Coat. Technol. 1997, 96, 135. 6. Osaka, T.; Takai, M.; Tachibana, H.; US pat.6,512 2000. 7. Weikang, H.; Int. J. Hydrogen Energy2000, 25, 111. 8. Donten , M.; Cesiulis, H.; Stojek, Z.; Electrochim. Acta2000,
45, 3389.
9. Giz, M. J.; Bento, S. C.; Gonzalez, E. R.; Int. J. Hydrogen
Energy2000, 25, 621.
10. Sufredini, H.B.; Cerne, J.L.; Crnkovic, F.C.; Machado, S.A.S.; Avaca, L.A.; Int. J. Hydrogen Energy 2000, 25, 415. 11. Abouatallah, R.M.; Kirk, D.W.; Thorpe, S.J.; Graydon, J.W.;
Electrochim. Acta2001, 47, 613.
12. Zeng, Y. ; Zelin, L.; Ming, M.; Shaomin, Z.; Electrochem.
Commun. 2000, 2, 36.
13. Marlot, A.; Kern, P.; Landolt, D.; Electrochim. Acta2002, 48, 29.
14. Podlaha, E.J., Landolt, D.; J. Electrochem. Soc. 1996, 143, 885.
15. Podlaha, E.J., Landolt, D.; J. Electrochem. Soc. 1996, 143, 893.
16. Podlaha, E.J., Landolt, D.; J. Electrochem. Soc. 1997, 144, 1672.
17. Marinho, F.A.; Santana, F.S.M.; Vasconcelos, A.L.S.; Santana, R.A.C.; Prasad, S.; J. Braz. Chem. Soc. 2002, 13, 522. 18. Gomez , E.; Pellicer, E. Vallés, E.; J. Electroanal. Chem.2001,
517, 109.
19. Beltowska-Lehman, E.; Surf. Coat. Technol.2002, 151, 440. 20. Yao, S.W.; Zeng, Y.; Guo, H.T.; Surf. Tech.1994, 45, 643. 21. Zeng, Y.; Yao, S.W.; Guo, H.T.; Platinum Surf. Fin. 1995, 82,
64.
22. Holt, M.L.; Trans. Electrochem. Soc. 1987, 71,301. 23. Chassaing, E.; Quang, K.V.; Wiart , R.; J. Appl. Electrochem.
1989, 19, 839.
24. Zeng, Y.; Yao, S.W.; Guo, H.T.; Chin. J. Chem. 1997, 15, 193. 25. Jayashree, R.S.; Vishnu Kamath, P.; J. Power Sources2001,
26. Zhen-Jiang, N.; Shi-Bing, Y.; Shao-Min, Z.; J. Electroanal. Chem. 1998, 455, 205.
27. Shaoquin, L.; Zhang, B; Wang, E; Dong, S.; Electrochem.
Commun. 1999, 1, 365.
28. Winand, R.; Oblerfache Surface 1990, 8, 112.
29. Afshar, A.G.; Dolati, M.; Ghorbani, M.; Mat. Chem. Phys. 2002, 77, 352 .
30. Gómez, E.; Pelaez, E.; Vallés, E.; J. Electroanal. Chem. 1999,
469, 139.
31. Bertazzoli, R.; Pletcher, D.; Electrochim. Acta1993, 38, 611. 32. Beltowska-Lehman, E.; Surf. Coat. Tech., 1986, 27, 75. 33. Brenner, A.; Electrodeposition of Alloys, Academic Press: New
York, 1963.
Received: December 5, 2002 Published on the web: July 21, 2003