0103 - 5053 $6.00+0.00
A
r
ti
c
le
* e-mail: [email protected]
Preparation and Voltammetric Characterization of Electrodes Coated with
Langmuir-Schaefer Ultrathin Films of Nafion
®Paolo Bertoncellob andPaolo Ugo*,a
a
Department of Physical Chemistry, University of Venice, S. Marta 2137, 30123 Venice, Italy
b
Department of Biophysics, M&O Science and Technologies, University of Genoa, Corso Europa 30, 16132 Genoa, Italy
Filmes ultrafinos do polímero perfluorado Nafion® foram depositados em eletrodos de óxido
índio-titânio (ITO) usando a técnica de Langmuir-Scaefer (LS), depois da otimização das condições de composição da subfase. As características morfológicas das camadas foram obtidas por Microscopia de Força Atômica (AFM). Filmes de Nafion® LS mostraram boa uniformidade e cobertura completa da
superfície do eletrodo. No entanto, diferentes graus de organização das camadas poliméricas ficaram evidentes com respeito a filmes finos depositados por revestimento rotacional. Eletrodos ITO modificados com camadas de Nafion® LS, pré-concentrados por cátions eletroativos de troca iônica, como o
Ru[(NH3)6]
3+, dissolveram-se em soluções diluídas. A espécie eletroativa foi retida pelo ITO com
camada de Nafion® LS, mesmo depois da mudança do eletrodo modificado para eletrodo de suporte
purificado. Isto possibilitou o uso do complexo de rutênio como padrão voltamétrico para o teste do fenômeno de difusão nos filmes de Nafion® LS. Os coeficientes de difusão aparentes (D
app) do
Ru[(NH3)6]3+ incorporado no filme de Nafion® LS foram obtidos por medidas voltamétricas. Os
valores de Dapp diminuíram levemente com o aumento da quantidade de complexo de rutênio incorporado
no filme ultrafino e foram significativamente mais baixos do que os valores para filmes de Nafion®
recapados, em acordo com a natureza altamente condensada dos filmes de Nafion® LS.
Ultrathin films of Nafion® perfluorinated polymer were deposited on indium-tin oxide electrodes
(ITO) by using Langmuir-Schaefer (LS) technique, after optimization of the subphase composition conditions. Morphological characteristics of these coatings were obtained by Atomic Force Microscopy (AFM). Nafion® LS films showed a good uniformity and complete coverage of the electrode
surface, however a different organization degree of the polymer layer was evidenced with respect to thin films deposited by spin-coating. ITO electrodes modified with Nafion® LS coatings preconcentrate
by ion-exchange electroactive cations, such as Ru[(NH3)6]3+, dissolved in diluted solutions. The
electroactive species is retained by the Nafion® LS coated ITO also after transfer of the modified
electrode into pure supporting electrolyte. This allowed the use of the ruthenium complex as voltammetric probe to test diffusion phenomena within the Nafion® LS films. Apparent diffusion
coefficients (Dapp) of Ru[(NH3)6]
3+ incorporated in Nafion® LS films were obtained by voltammetric
measurements. Dapp values decrease slightly by increasing the amount of ruthenium complex incorporated in the ultrathin film. They are significantly lower than values typical for recasted Nafion® films, in agreement with the highly condensed nature of the Nafion® LS fims.
Keywords: Langmuir-Schaefer films, Nafion®, modified electrodes, Ru[(NH 3)6]
3+, diffusion
coefficients
Introduction
Nafion®, a copolymer of tetrafluoroethylene and
sulfonyl fluoride vinyl ether, is one of the most interesting solid polymer electrolytes for technological and scientific researches. It is used as ionomeric permselective membrane
for a variety of electrochemical applications including fuel cells, water electrolyzers and chlor-alkali cells,1,2
chemically modified electrodes,3-5 ion-selective and
potentiometric sensors,6-7 voltammetric sensors8-9 and
electrochromic devices.10-11
For electroanalytical purposes, Nafion® coated
modified electrodes were widely used for preconcentrating and determining trace concentrations of electroactive cations.8-9 Voltammetric signals relevant to the
precon-centrated analytes are, in fact, increased by a factor dependent on the partitioning within the film.8 However,
the much lower values for the apparent diffusion coefficients which rule mass and charge transport phenomena within the coating,4,5 can sometimes contrast
the increase in sensitivity expected only on the basis of preconcentration effects.
In general, fluorocarbon polymers are hydrophobic in nature, but Nafion® is an exception due to its partial
solubility in water determined by the presence of sulphonic groups, which exhibit a very strong acidic character. The water content of the membrane affects greatly its properties, since it determines the type of counter ions incorporated within the polymer matrix12,13 as well as the dynamics of
diffusive processes within the coating layer.4 Also the ionic
conductivity in Nafion® is understood to be strongly
dependent on the morphology and local structural order of the film.14 All these evidences support the relevancy of
developing deposition methods able to control the film architecture down to the molecular level.
Langmuir-Blodgett (LB), Langmuir-Schaefer (LS), and layer-by-layer self-assembly techniques15 allow one to
prepare ordered molecular architectures where thickness is controllable up to the molecular level.16 In a recent paper,11
we showed that by choosing proper composition of the subphase it was possible to obtain Langmuir monolayers of Nafion® at the water/air interface and that this films can be
deposited on solid substrates by LS technique. At variance with “classical” LB technique, in the LS deposition the substrate is placed horizontally (instead of vertically) in contact with the Langmuir monolayer film. When the substrate is lifted and separated from the water surface, the monolayer is transferred onto the substrate.15 In the present
work we examine in detail the charge transfer and diffusion behavior of electroactive probe based on cations such as Ru[(NH3)6]3+ , incorporated by ion-exchange in Nafion® LS
films deposited on electrode surfaces in comparison with “traditional” coatings deposited by solvent evaporation of recasted Nafion® solutions.3,4,18
Experimental
Fabrication of Langmuir-Schaefer films of Nafion®
Nafion® 117 solution (5% m/v in a mixture of low
molecular weight alcohol) was purchased from Sigma-Aldrich. All other chemicals were of reagent grade quality. A stock solution of Nafion® was prepared by dilution of
the commercial solution with CH3OH to obtain a final concentration of 0.5 mg cm-3. On the basis of the methanol/
water solvent ratio used in this study, Nafion® is expected
to attain a micellar conformation with the polar sulfonate groups located on the surface of the micelles and the hydrophobic fluorocarbon chains in the inner part. The Nafion® Langmuir monolayer was formed by using a
Langmuir trough (MDT corporation, Moscow, Russia - 240 mm x 100 mm or, alternatively, with a KSV Langmuir-Blodgett trough). The surface pressure was measured by means of a Wilhemy balance with an accuracy of 0.2 mN m-1. The volume of Nafion® solution added to the
subphase was varied in the range of 100-200 µL. An elapsed time of two to five minutes was given before compression of the floating film. The effect of ions on the Langmuir monolayer formation was studied by using subphases containing various ions, i.e., pure water, NaCl, LiClO4, NaCl +HCl (pH 2), HCl (pH 2) water solutions, respectively. Preparation and optimization of these subphases was described elsewhere.11 A large number of deposition
parameters influences the microstructure and the growth rate of the Nafion® LS film. Based on Langmuir behavior,
the conditions of parameters used for the deposition are: surface pressure of 25 mN m-1 and 0.1 mol dm-3 NaCl
solution as the subphase.
Atomic force microscopy
Atomic force microscopy (AFM) was performed by using a Digital Instruments D3100 AFM with Nanoscope IIIa controller operating in air at a constant relative humidity of about 60%. The AFM worked in “Tapping Mode” confi-guration using commercial n+-doped silicon microlevers
with an apex curvature radius of the probe tip in the range 5-10 nm and a typical force constant of about 40 N m-1.
AFM technique was also used for the estimation of the films thickness by using the following procedure. At first the film was repeatedly scratched using a cantilever of the same type used for imaging but operating in “contact mode”. The typical amount of force applied for a complete removal of the material deposited was in the range 2-5 µN. This values have been chosen in order to discover a clean area of the substrate and to avoid the substrate damaging. A new probe was then used to scan the scratched area. The film thickness was then obtained by averaging several profiles of the scratched area and considering the vertical distance between the discovered substrate and the film surface.
Electrochemical measurements
using a EG&G PARC, model 263A or a CH model 620 A potentiostat/galvanostat controlled by their own software. In all cases a standard three electrodes cell configuration was used. The working electrode was an ITO (Indium Tin Oxide) coated glass plate on which Nafion® LS films were
deposited. A platinum coil was used as the counter electrode and Ag/AgCl (KCl saturated) as the reference electrode. The working electrode area immersed in the electrolyte solution was kept equal to 0.6 cm2. All solutions were
accurately degassed with nitrogen before the measurements.
Results and Discussion
Langmuir isotherms
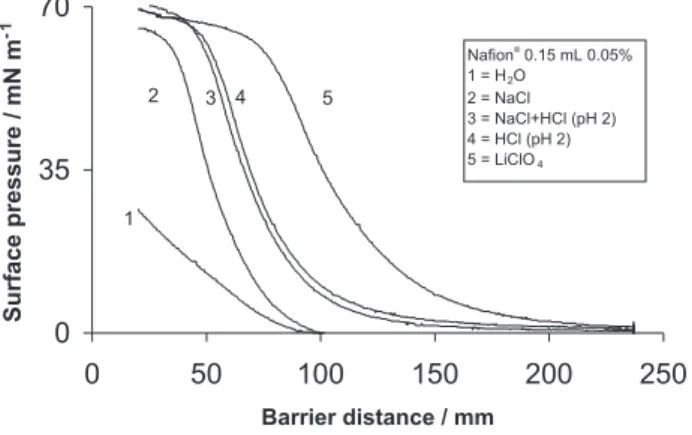
Figure 1 reports the pressure-area isotherm of Nafion®
molecules at the air-water interface in subphases containing different electrolytes. As shown by curve 1 in Figure 1, no sharp increase in the pressure-area plot characterizes the isotherm obtained in pure water. This indicates the sinking of some of the molecules below the air/water interface due to the partial solubility of Nafion®
in pure water. However, the shape of the isotherms changes dramatically when strong electrolytes are dissolved in the subphase (see Figure 1, curve 2-5). Such marked variations in the pressure-area isotherms of Nafion® Langmuir
monolayers indicate that the polymer undergoes relevant structural changes connected with the high ionic strength of the subphases and related to the electrostatic shielding effect that cations dissolved in the subphase can play with respect to the sulfonated groups of the polymer. These cations can stabilize, in fact, the interfacial film by lowering the ionic repulsion between the sulfonic groups of Nafion®
which are put very close each other during the compression of the layer.
In these cases, for example with Na+ in the subphase
(see curve 2 in Figure 1), Nafion® does not sink, as in pure
water, rather it floats at the air/water interface. A smooth phase transition with an increase in surface pressure above 10 mN m-1 is observed from all curves 2 -5 in Figure 1.
During the solid phase transition the polymer molecules start to interact closely increasing their 2-D packing degree. The further increase in the surface pressure above 45 mN m-1
shows the occurrence of 3-D transformations with the collapsing of the interfacial film at 50-60 mN m-1. These
transformations were previously put in evidence by Brewster Angle Microscopy.11
The comparison of the different isotherms shown in Figure 1, indicates that the degree of condensation of the film depends on the specific interactions between Nafion®
and the cations dissolved in the subphase. In particular,
the evidence that the condensation extent follows the sequence Na+>H+>Li+ indicates a correlation with the
sequence reported in the literature for the ion-exchange selectivity of Nafion® for these ions.19 This indicates that
the same factor which favours the ion-exchange incorpo-ration in membranes could switch also the aggregation of interfacial films produced by Langmuir compression.
Note that, due to difficulties in determining the real molecular weight and the exact solubility of the available Nafion®, the isotherms report the barrier distance as the
quantity on the X-axis. The stability of the Langmuir film at the air-water interface depends strongly on the selection of suitable subphases and barrier speeds as well as the concentration of the Nafion® solutions. Based on the
behaviours of the pressure-area isotherms curves, 25 mN m-1 was estimated as the best value for performing the
deposition of LS films, since at this surface pressure a stable 2-D transformation is evident.
Atomic force microscopy
Figure 2 shows typical AFM images of Nafion® LS
films. Figure 2a, which refers to a five layers sample, is representative of the surface morphology of these films. The whole substrate surface is covered uniformly. By increasing the number of layers deposited the films thickness increases linearly from 1.3 nm for one layer to 16 nm for 10 layers, while the average grain-size increases from 25 nm to 70 nm. The increase in the number of layers deposited reflects also in the increase of the surface roughness factor (Rq) from 0.5 nm to 1.2 nm.
Figure 2b shows a typical AFM topography of Nafion®
thin films deposited by spin-coating at 750 rpm. The thickness of the spin-coated film shown in Figure 2b is
Figure 1. Pressure-Area (Π-A) isotherms of Nafion® in different
subphases at 1.67 mm s-1 barrier speed: (1) H
2O, (2) 0.1 mol dm -3
NaCl, (3) 0.1 mol dm-3 NaCl + HCl (pH 2); (4) HCl (pH 2), (5) 0.1
equal to 17 nm and compares with that of a 10 layers Nafion® LS coating. However, the surface roughness factor
for spin-coated Nafion® is higher, being equal to 1.8 nm.
These evidences indicate a high condensation degree and compactness for Nafion® LS films, while spin-coated films
of comparable thickness appear more grainy and rough.
Cyclic voltammetry
It is well known that Nafion® can incorporate
electroactive cations by ion exchange.4,5,18 This
incorpo-ration (or doping) process allowed dramatic improvements in detection capabilities and electrocatalytic applications of Nafion® coated electrodes with respect to conventional
uncoated electrodes.8,9 However, it was shown that the
properties of recasted Nafion® films depend strongly on
the deposition conditions,19,20 some of which can not be
controlled easily.
In order to investigate if Nafion® LS films display
preconcentration capabilities similar to those of recasted films and to understand which are the mechanisms which control transport phenomena within these films, the ion-exchange and electrochemical behavior of Ru[(NH3)6]3+
incorporated in Nafion® LS films was studied by cyclic
voltammetry (CV). At first, the modified electrode was dipped in 10-2 mol dm-3 NaNO
3 solution containing a rather
low concentration a redox cation, namely 10-5 mol dm-3
Ru[(NH3)6]3+. Cyclic voltammograms recorded in the
Ru[(NH3)6]3+containing solution (not shown) were
characterized by a quick increase of the peak currents typical for the Ru[(NH3)6]3+ / Ru[(NH
3)6]
2+ couple (see
below) until a stable signal was obtained after about 5 min. This agrees with a quick ion-exchange precon-centration of the ruthenium complex within the Nafion®
LS coating. It is worth to note that at electrodes coated with recasted Nafion® films ion-exchange equilibrium
conditions are achieved only after hours.18
Figure 3 and 4 show the CV patterns recorded at an ITO electrode covered with Nafion® LS films, loaded in
Ru[(NH3)6]3+ solution and transferred into pure supporting
electrolyte (10-2 mol dm-3 NaNO
3). Note that soon after
transfer signals decrease slightly (about 10%), but after few minutes, they reach the stable voltammetric behavior shown in Figures 3 and 4.
The CVs in Figure 3 show the scan rate dependence of signals at an ITO electrode coated with 30 layers (45 nm thickness from AFM measurements ) of Nafion® LS films.
E1/2 values are calculated as E1/2 = (Epf + E p
b) / 2,21 where E p
f
and Epb are the voltammetric peak potentials measured in
Figure 2. AFM pictures of 5 layers of Nafion® LS films (a)
depos-ited on silicon substrate in 0.1 mol dm-3 NaCl as subphase; (b)
Nafion® spin-coated film on silicon substrate at 750 rpm.
Figure 3. CVs on ITO coated with 30 layers of Nafion® LS films,
recorded at different scan rates in 10-2 mol dm-3 NaNO
3 supporting
electrolyte. The coated ITO were previously loaded in 10-5 mol dm-3
Ru[(NH3]6]3+, 10-2 mol dm-3 NaNO
3 and then transferred in pure
supporting electrolyte. Scan rates: (a) 5 mV s-1, (b) 10 mV s-1,
the forward and backward scan, respectively. They are roughly independent on the scan rate and are equal to about -300 mV. This agrees with previous observation19
which showed that Ru[(NH3)6]3+ incorporation in Nafion®
coatings produces a significant negative shift (of about 150 mV, for our case) in the E1/2 value of the Ru[(NH3)6]3+/2+
couple because the higher oxidation state is more strongly bound by the Nafion® sulfonate groups. Note that ∆E
p
values are rather large at high scan rates while they decrease down to 10 mV at low scan rates (5 mV s-1). The analyses of
peak currents indicates that they depend linearly on the square root of the scan rate for v > 40 mV s-1, while at lower
scan rates they depend linearly on v. This evidence indicates a diffusion control for the former data and a thin-layer-like behavior for the latter.21 A diffusion controlled behavior is
observed at coated electrodes when the thickness of the diffusion layer is thinner than the coating thickness;8 when
the opposite is true (usually at low scan rates), thin-layer-like conditions become operative.
Figure 4 shows the dependence of the voltammetric patterns of Ru[(NH3)6]3+ incorporated in Nafion® LS coated
ITOs as a function of the number of LS layers deposited. All these CVs were recorded at 5 mV s-1, i.e. under
thin-layer-like conditions. They clearly show that peak currents
scale linearly with the number of layers deposited. The amount of ruthenium complex incorporated in the film is calculated by integrating the area of these voltammetric peak, since under thin-layer-like conditions, the exhaustive electrolyses of all the incorporated species takes place during the voltammetric scan.8
For reversible redox couples incorporated in Nafion®
coatings, the slope of the Ip vs. v1/2 plot in the diffusion
controlled region obeys the Randles-Sevcik equation.8,21
The slopes of these plots, when linear, can be combined with known film thickness and amount of electroactive species incorporated (obtained by coulometric integration of CV peaks under thin-layer conditions, see above) in order to calculate the values of apparent diffusion coefficients (Dapp) of Ru[(NH3)6]3+ within the coating.9
Dapp values were calculated by using equation (1):
Dapp = (S x Φ / 2.69 x 10⁵ x m) (1)
where S = slope of Ipvs. v1/2 plots, Φ = film thickness (45
nm), m is the number of moles of Ru[(NH3)6]3+ incorporated
in the film. Note that if the electrode area is kept constant during the low scan rate scan (used for the coulometric measure of m) and the high scan rates scans (used to measure S), the exact knowledge of the electrode area has no influence on Dapp estimation.
Typical data measured at Nafion® LS coated ITO are
listed in Table 1, as a function of different ruthenium complex loading. Dapp values decreased slightly with increasing the ruthenium loading, however, they are all in the order of 10-11 cm2 s-1. Such values are almost two order
of magnitude lower than those reported in the literature for films of recasted Nafion®, which ranged from 2 x 10⁻⁹ to
4 x 10⁻⁸ cm2 s-1.4,5,19.22 Such an evidenceagrees with the
AFM observation that a more compact and condensed structure characterizes Nafion® LS films with respect to
films of comparable thickness recasted by spin-coating. A more condensed film is, in fact, expected to slow down the physical diffusion of electroactive ions. The slight decrease in Dapp values with increasing the ruthenium loading for Nafion® LS films is somehow parallel, although less
dramatic, with data obtained for measurements performed
Table 1. Values of apparent diffusion coefficients (Dapp) for Ru[(NH3)6]3+ in Nafion® LS films (30 layers) at different ruthenium loadings (Γ);
S = slope of Ipvs. v1/2 plots, Φ = film thickness (45 nm), m = number of moles of Ru[(NH 3)6]
3+ incorporated in the film, C
s and Cp are the
Ru[(NH3)6]3+ concentrations in the loading solution and in the polymer, respectively
Cs (mol dm-3) Γ (moles cm-2) S (A s 1/2 V-1/2) m/Φ (moles cm-1) C
p (mol dm
-3) D
app (cm 2 s-1)
1 x 10⁻⁶ 1 x 10⁻¹⁰ 5.4 x 10⁻⁵ 1.3 x 10⁻⁵ 0.022 2.25 x 10⁻¹¹
5 x 10⁻⁶ 5.8 x 10⁻¹⁰ 7.7 x 10⁻⁶ 7.7 x 10⁻⁵ 0.120 1.4 x 10⁻¹¹
10 x 10-6 7.5 x 10⁻¹⁰ 8.6 x 10⁻⁵ 10 x 10-5 0.166 1.0 x 10⁻¹¹
Figure 4. CVs recorded at 5 mV s-1 on ITOs coated with a different
number of layers of Nafion® LS films: (a) 5 layers, (b) 10 layers, (c)
on recasted Nafion® films.19,22 Such a dependence can be
attributed to the electrostatic crosslinking of Nafion®
polymer chains caused by the incorporation of cation with ionic charge >1. Each Ru[(NH3)6]3+ interacts with 3 SO
3 –
groups of Nafion® possibly coming from different polymer
chains which are, therefore, crosslinked. In the case of Nafion® LS coatings such a crosslinking seems to further
increase the already high condensation degree of the film. The comparison between column 1 and 5 in Table 1, shows the very high preconcentration capability of the Nafion® LS coating. The partitioning of the analyte
quantified by Cp/Cs ratios (where Cp and Cs are the analyte concentrations in the polymer and in the solution, respectively) is in fact in the order of 104. This explains
why, notwithstanding the rather low Dapp values, high peak currents and well resolved voltammograms are observed at electrodes coated with Nafion® LS films even when the
loading is performed in micromolar solution concen-trations of electroactive analytes. Note that a similar behavior was observed for Nafion® LS films incorporating
methylviolgen as electroactive probe cation.11
Conclusions
AFM and CV measurements indicate that Nafion® LS
films deposited on ITO form continuous films whose thickness depends on the number of layers deposited. These films are more compact and present a higher molecular condensation degree than recasted and spin-coated films. Nafion® LS films can preconcentrate electroactive cations
and such a process is faster than at electrodes coated with recasted Nafion® films. The electroactivity of incorporated
Ru[(NH3)6]3+ at relatively high scan rates (> 40 mV s-1) is
ruled by a very small apparent diffusion coefficient which indicates charge transport phenomena slower than in recasted films. However, the amplification of signals related to the analyte incorporation in the coating still prevails so allowing one to use Nafion® LS coated electrodes for the
preconcentration and ion-exchange voltammetric determination of electroactive cations present at micromolar solution concentrations.
Acknowledgments
The authors thank Andrea Notargiacomo (Università di Roma Tre) and Francesca Vezzà for performing some
experiments. Partial financial support by MIUR (Rome) is acknowledged.
References
1. Xing, B.; Savadogo, O.; Electrochem. Commun.2000,2, 697 2. Pillai, K.C. ; Kumar, A.S. ; Zen, J.-M.; J. Mol. Catal. A: Chem.
2000, 160, 277
3. White, H.S.; Leddy, J.; Bard, A.J.; J. Am. Chem. Soc.1982,
104, 4811
4. Martin, C.R.; Dollard, K.A.; J. Electroanal. Chem. 1983, 159, 127
5. Buttry, D.A.; Anson, F.C.; J. Electroanal. Chem. 1981, 130, 333
6. Martin, C.R.; Freiser, H.; Anal. Chem.1981, 53, 902 7. Ugo, P.; Moretto, L.M.; De Boni, A.; Scopece, P.; Mazzocchin,
G.A.; Anal. Chim. Acta2002, 474, 147
8. Ugo, P.; Moretto, L.M.; Electroanalysis1995, 7, 1105 9. Ugo, P.; Moretto, L.M.; Vezzà, F.; ChemPhysChem2002, 3,
917
10. Sabatani, E.; Nikol, H.D.; Gray, H.B.; Anson, F.C.; J. Am.
Chem. Soc.1996, 118, 1158
11. Bertoncello, P.; Ram, M.K.; Notargiacomo, A.; Ugo, P.; Nicolini, C.; Phys. Chem. Chem. Phys., 2002, 4, 4036 12. Gebel, G.; Lombard, J.; Macromolecules1997, 30, 7914 13. Mauritz, K.A.; Mater. Sci. Eng., C1998, 6 , 121
14. Okada, T.; Moller-Holst, S.; Gorseth, O.; Kjelstrup, S.; J.
Electroanal. Chem., 1998, 442, 137
15. Ulman, A.; Ultrathin Organic Films, Academic Press: New York, 1991
16. Ram, M.K.; Nicolini, C.; Rec. Res. Devel. Phys. Chem.2000, 4, 219
17. Steck, A.; Yeager, H.L.; Anal .Chem. 1980, 52, 273 18. Szentirmay, M.N.; Martin, C.R.; Anal. Chem. 1984, 56, 1898. 19. Shi, M.; Anson, F.C.; Anal. Chem.1997, 69, 2653
20. Porat, Z.; Rubinstein, I.; Zinger, B.; J. Electrochem. Soc.1993, 140, 2501
21. Bard, A.J.; Faulkner, L.; Electrochemical Methods, Wiley: New York, 2000
22. Daniele, S.; Ugo, P.; Bragato, C.; Mazzocchin, G.A.; J. Electroanal. Chem.1996, 418, 29.
Received: February 29, 2003
![Figure 3 and 4 show the CV patterns recorded at an ITO electrode covered with Nafion ® LS films, loaded in Ru[(NH 3 ) 6 ] 3+ solution and transferred into pure supporting electrolyte (10 -2 mol dm -3 NaNO 3 )](https://thumb-eu.123doks.com/thumbv2/123dok_br/18989498.460115/4.892.70.406.131.645/figure-patterns-recorded-electrode-solution-transferred-supporting-electrolyte.webp)
![Figure 4 shows the dependence of the voltammetric patterns of Ru[(NH 3 ) 6 ] 3+ incorporated in Nafion ® LS coated ITOs as a function of the number of LS layers deposited.](https://thumb-eu.123doks.com/thumbv2/123dok_br/18989498.460115/5.892.96.438.600.857/figure-dependence-voltammetric-patterns-incorporated-nafion-function-deposited.webp)
