0103 - 5053 $6.00+0.00
A
r
ti
c
le
* e-mail: [email protected]
Voltammetry at Micro-Mesh Electrodes
Jay D. Wadhawana, Peter J. Welforda, Kamran Yunusb,Adrian C. Fisherb and Richard G. Compton*,a
a
Physical and Theoretical Chemistry Laboratory, Oxford University, South Parks Road, Oxford OX1 3QZ, United Kingdom
b
Department of Chemistry, University of Bath, Claverton Down, Bath BA2 7AY, United Kingdom
Neste trabalho investigamos a voltametria em eletrodos do tipo micromesh. Em experimento de duração suficientemente curta, os eletrodods de trabalho micromesh se comportam primeiramente como uma rede de eletrodos de microbanda, seguido pelo comportamento esperado para um arranjo de eletrodos de micro-anel, independentes de difusão, com perímetro igual ao tamanho da grade. Durante eletrólise prolongada, o eletrodo apresentou o comportamento previsto para um eletrodo parcialmente bloqueado, com arranjo cúbico. A aplicação deste eletrodo micromesh na determinação eletroquímica de dióxido de carbono em soluções eletrolíticas de DMSO é descrita.
The voltammetry at three micro-mesh electrodes is explored. It is found that at sufficiently short experimental durations, the micro-mesh working electrode first behaves as an ensemble of microband electrodes, then follows the behaviour anticipated for an array of diffusion-independent micro-ring electrodes of the same perimeter as individual grid-squares within the mesh. During prolonged electrolysis, the micro-mesh electrode follows that behaviour anticipated theoretically for a cubically-packed partially-blocked electrode. Application of the micro-mesh electrode for the electrochemical determination of carbon dioxide in DMSO electrolyte solutions is further illustrated.
Keywords: micro-mesh electrodes, microelectrodes, partially-blocked electrodes, micro-ring electrodes, microband electrodes, voltammetry
Introduction
Microelectrodes have been used extensively in electrochemical studies for over twenty-five years.1-6 The features that make these devices attractive include the smaller solution resistance associated with microelectrodes compared with large electrodes, reduced time constants in electrochemical cells employing microelectrodes, and the ability to obtain a steady-state (or quasi-steady-state) current in the absence of forced convection. Such features have been well-documented in several reviews.1,2,5,6 For electroanalytical purposes, the small size of micro-electrodes has been exploited to probe electroactive compounds in small volumes, or at particular microscopic locations. For analytical sensing devices, diffusionally-independent microelectrode arrays (generally consisting of regularly packed disk or band electrodes) have proved efficacious as they retain the properties of microelectrodes,
yet the currents can be comparable to those obtained at macroelectrodes, resulting in improved sensitivity and detection limits.
or to simulate stationary voltammetry using a simple planar diffusion model,8 with a total area of twice of the area of mesh used (accounting for both sides of the mesh), suggesting that at sufficiently long times, the diffusion layers at each wire overlap.
In this paper we examine the diffusion-only behaviour at micro-mesh electrodes, treating the mesh either as a regular ensemble of microband or micro-ring electrodes, or as a partially-blocked electrode.12
Experimental
Chemical reagents
Experiments were undertaken using solutions of ferrocene (Aldrich, concentration ca. 1-2 mmol L-1) in dried and distilled acetonitrile (Fisher Scientific, Ltd., UK),
containing 0.1 mol L-1 tetrabutylammonium perchlorate
(TBAP, Fluka, electrochemical grade). Dimethylsulfoxide (DMSO, BDH, Spectrol grade) solutions contianing 0.2 mol L-1 tetraethylammonium perchlorate (TEAP, Fluka, electrochemical grade) employed for carbon dioxide
electrochemistry were purified as outlined previously.13
All chemical reagents were purchased as the highest commercially available grade. Solutions were purged of oxygen prior to electrochemical experiments by outgassing with pure argon (BOC, Guildford, UK).
Carbon dioxide was purchased from MG Gases, Ltd., and was admitted into the electrochemical cell in select volume ratios using a Wösthoff triple gas mixing pump
(Bochum, Germany), as described in earlier work.13 All
experiments were undertaken at a temperature of 20 ± 2 oC.
Instrumentation
All electrochemical experiments were conducted using a three-electrode cell in which the micro-mesh electrode comprised the working electrode (vide infra), a gold wire coiled into a spiral the counter electrode, and a silver wire pseudo-reference electrode. Electrochemical measurments were made using a commercially-available computer-controlled potentiostat (Autolab PGSTAT30, Eco Chemie, Utrecht, The Netherlands).
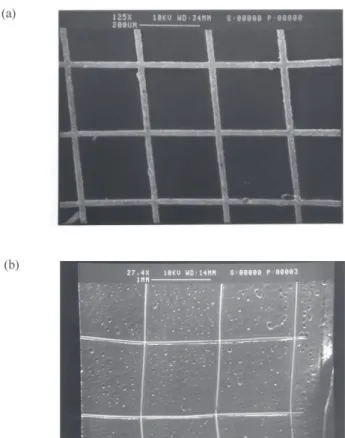
The voltammetry of three meshes were explored. The first micro-mesh, mesh A, was fabricated by sputtering gold onto a glass template in a manner similar to that previously reported.12 This micro-mesh consisted of 576 grid-squares, with 20 µm wide electrode strips, separated by 400 µm. The other two micro-mesh electrodes used were commer-cially-available electroformed gold grids (obtained from Buckbee Mears Co., St. Paul, MN). Mesh B contained 100
wires per inch, each wire having a nominal diameter of 20 µm and approximate separation of 210 µm; micro-mesh C contained 20 wires per inch, each wire having an average
width of 30.9 µm and average separation of 1213.2 µm.
SEM images of the gold wire meshes are illustrated in Figure 1. The meshes were mounted in a PTFE case so that electrochemistry could only take place at one side of the metallic micro-mesh. Only a small area (corresponding to a circular disc with a 3 mm diameter) was exposed to the solution containing the electroactive species, as illustrated in Figure 2. The wire mesh close to, but not exposed by, the circular disc, was further shielded from contact with the solution by wrapping it with a piece of PTFE tape. Electrical connection to the mesh was established by “spot
welding” a gold wire (ca. 125 µm diameter) to a point
within the area concealed by the case. In this manner, 105 grid-squares were exposed in mesh B, and four grid-squares were exposed in mesh C. The meshes were cleaned by rinsing with acetonitrile before and after experimentation; owing to their fragility, the meshes were not gound/ polished.
Detailed viewing of the gold wire meshes used in this work via scanning electron microscopy (SEM) was undertaken using a Cambridge Instruments Stereoscan scanning electron microscope.
Results and Discussion
Voltammetry of the micro-mesh electrode
Figure 3 illustrates the oxidation of ca. 2.0 mmol L-1 ferrocene in 0.1 mol L-1 TBAP in acetonitrile solvent, at each of the three gold micro-mesh working electrodes, for several scan rates. The presence of voltammetric peaks in
the current vs. voltage plots, rather than sigmoidal steady-state signals expected for microelectrode behaviour, is attributable to two causes. First, in the electrode design depicted in Figure 1, the wire mesh is recessed by ca. 1.0 mm below the PTFE cover. Second, it may be inferred from the macroelectrode-type behaviour observed in Figure 3 that the gold wires are too closely packed for a microelectrode array, even for mesh C, causing the diffusion layers surrounding each individual wire to overlap during the course of potential sweep.
The wire mesh geometry is such that it can be thought to be a regularly distributed ensemble of micro-wire (approximately microband) electrodes, or of square (approximately effectively ring) microelectrodes. In order to understand fully the voltammetric response of the micromesh electrode, it was analysed by assuming the mass transport to a square mesh to be identical to that of an ensemble of diffusionally independent micro-ring or microband electrodes.
The micro-mesh electrode as a microelectrode
For the simple, uncomplicated electrochemical oxidation,
A - e
-º
A+•The diffusion-only mass transport equation applicable to a micro-ring electrode is given in normalised cylindrical polar co-ordinates as:
(1)
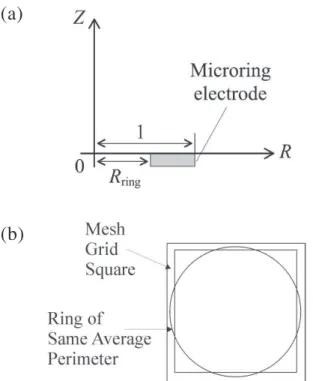
in which a = [A]/[A]bulk, and Z and R are the distances normal to and radial to the electrode surface. A solution to equation 1 is sought subject to the boundary conditions in Table 1, for which R
ring is the dimensionless inner radius
of the micro-ring electrode, as defined in Figure 4. For
Table 1. Boundary conditions employed for the simulation of the micro-ring electrode
Simulation Space [A] Constraints
R ≥ 0; Z →∞ a = 1
R →∞; Z ≥ 0 a = 1
Rring < R ≤ 1; Z = 0; t > 0 a = 0
Rring≥ R > 1; Z = 0
R = 0; Z ≥ 0
Figure 2. Schematic illustration of the Teflon case used to house the gold wire mesh.
Figure 3. Cyclic voltammograms for the oxidation of ferrocene (ca. 2 mmol L-1) in 0.1 mol L-1 TBAP/MeCN at gold mesh
elec-trodes. (a) Data for the sputtered micro-mesh, mesh A, with a fer-rocene concentration of 2.0 mmol L-1; (b) Data for the wire mesh
with 100 wires-per-inch, mesh B, with a ferrocene concentration of 2.0 mmol L-1; (c) Data for the wire mesh with 20 wires-per-inch,
comparison with micro-mesh B, a micro-ring of the same average perimeter (half the sum of the internal and external perimeters) as a square wire mesh unit within the mesh (see Figure 4), and a width of 20 µm, was considered. Numerical solutions to this problem were simulated as detailed elsewhere,14 to obtain the sought current vs. time response. The transient expected for a microband electrode, of length (b) 400 µm, and width (w) 20 µm, was next calculated
using the analytical expression deduced by Aoki:3
(2)
where n is the number of electrons transferred from the
electrode per mole species A, F is the Faraday constant, [A]bulk is the bulk solution concentration of species A, and the dimensionless parameter, θ = DAt/w2. Equation 2 is only valid at short times (θ < 2, with 5% error).3 Figure 5 shows a typical current transient obtained for ca. 2 mmol L-1 ferrocene in acetonitrile solutions at the wire mesh electrode mesh B. The number of square units exposed by the PTFE case, measured to be 105 using an optical microscpe, has normalised the observed current. The figure also includes the theoretical chronoamperograms for micro-ring electrodes of the same average perimeter as a unit square-grid within the mesh, and also for microband
electrodes of dimensions reported above. It may be concluded from Figure 5, that at very short times (t < 0.4 ms), the current response obtained using the mesh electrode tends towards that of a microband. After this period, the mesh electrode transient deviates from the curve expected for a microband, and its behaviour approaches that of micro-ring electrode of the same average perimeter as a unit mesh grid-square, with good agreement observed at times between 4 and 8 ms. The mesh electrodes begins to exhibit macroelectrode behaviour after 10 ms; hence quasi-steady-state currents are not observed, except at very low scan rates. From the simulation of the micro-ring, the concentration of the electroactive species at the ring centre decreased by 1% of its bulk value, after 300 ms. Although this is beyond the region in which the mesh electrode resembles a micro-ring electrode, it nevertheless gives us a upper limit for the diffusion layers surrounding each electrode to remain independent.
Thus, a wire mesh electrode exhibits microelectrode behaviour at short times (a few ms), but mimics a macroelectrode of the same total surface area at long times.
Micro-mesh electrodes as partially blocked electrodes
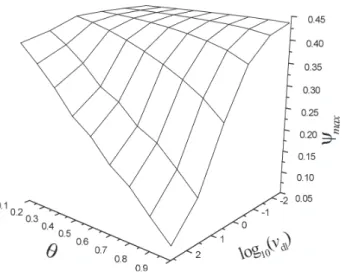
We have previously solved the mass transport equations appropriate to a partially-blocked electrode, in which microscopic circular inert discs (“blocks”) are scattered over the macroscopic electrode in a regular manner.12 We showed that solution of these equations for the case of cubically- or hexagonally-packed blocking systems correlate well with the results obtained from experiment. The protocol employed in the computation of simple electron transfer processes at such electrodes allows the calculation of the dimensionless peak current ψmax, given by equation 3, from a knowledge of the dimensionless scan rate (v
dl, equation 4) and fractional coverage (θ,
Figure 5. Current | time transients for the oxidation of 2.0 mmol L-1
ferrocene in 0.1 mol L-1 TBAP/MeCN at micro-mesh B. Also shown
are the computed transients for a micro-ring and microband elec-trode (see text).
Figure 4. Schematic diagram of the micro-ring model: (a) illustrates the grid used for the numerical simulations; (b) illustrates the ap-proximation of a unit grid-square of the mesh to a micro-ring.
(a)
equation 5), which are related via the data in Table 2 of reference,12 reproduced in graphical form in Figure 6.
(3)
(4)
(5)
In the above equations i
p is the peak current, F is the
Faraday constant, DA is the diffusion coefficient of species A, of initial concentration c
A
bulk. N
block is the number of
“blocking “ discs exposed to the solution, R is the molar gas constant, and T is the absolute temperature. A
exposed is
the total electrode area that is exposed to the solution, R is the distance between two “wires” in the micro-mesh
electrode, and r corresponds to the diffusion domain of
the individual “blocks”, and through which no diffusional flux passes, given by:
(6)
where r
b is the radius of the circular inert disc. Given that
our cubically-packed mesh array is blocked with square units, we need to approximate r
b. This can be achieved in
two ways. First, if the square blocks have the same
Figure 6. Working surface illustrating the variation of the dimen-sionless current as a function of the dimendimen-sionless scan rate and fractional surface coverage for a regularly distributed partially-blocked electrode (see text).
Figure 7. Comparison of the experimentally determined (inferred from Figure 3) current against that predicted theoretically for a partially-blocked electrode. The ordinate axis is the real current, and the abscissa is the square root of the scan rate. Results are for (a) micro-mesh A, (b) micro-mesh B, and (c) mesh C. In each case, experimental points are labelled with crosses (×); theoretical points are depicted as circles (o) for points under the equal perimeter assumption, or as vertical crosses (+) for the equal area assumption (see text).
perimeter as the circular discs, r
b = 2R/√
–
π; if the area of the square and circular blocks were the same, rb = R/√π–.
Peak-to-peak potential separation data for mesh A were modelled with DIGISIM 2.0, and gave an approximate average value for the Butler-Volmer electron-transfer rate constant, k0, defined15 as the ratio of the observed rate constant from the numerical simulation of the vol-tammograms (kobs) to the fraction of the electrode surface that is not blocked, (1 – θ), viz. k0 = k
obs /(1 – θ), to be
0.2 cm s-1, which is close to that reported elsewhere.4 Hence, the material transport to a micro-mesh electrode is analogous to that of a regularly-distributed partially blocked electrode.
Analytical applications of the micro-mesh electrode
We have recently illustrated how gold disk micro-electrodes immersed in DMSO electrolyte solutions can be employed in the sensing of carbon dioxide,13 with the following mechanistic pathway.
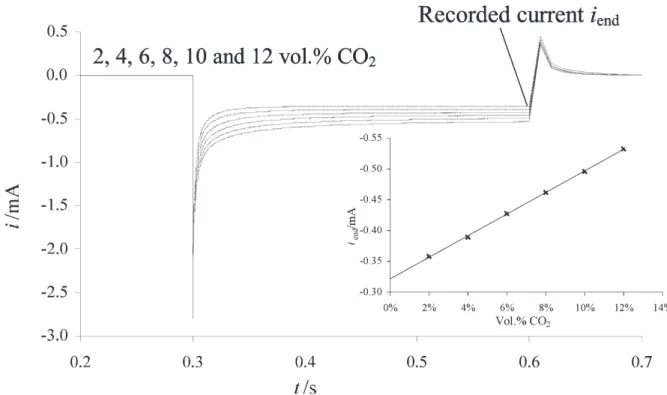
For a mesh electrode sensor to be viable, a voltammetric method of short duration must be used. To this end, a pulse technique was chose in which a single pulse, at a potential
of –2.5 V vs. Ag, was applied to the mesh working electrode
in 0.2 mol L-1 TEAP/DMSO solution for durations of 10,
50, 100 and 300 ms. For each pulse duration, the current was found to vary linearly with the solution concentration
of CO2, in the range 2-12 vol.% CO2. Figure 8 shows a
typical series of 300 ms pulses, the observed optimum duration, and the corresponding plot of i
end agains vol.%
CO2, with a Pearson’s Product Moment Correlation
Coefficient (R) of 0.9997.16
Conclusions
Voltammetry at a micro-mesh electrode has been explored. It has been shown that at short times, the mesh electrode first mimics an ensemble of microband electrodes, and then approximates an array of micro-ring electrodes with the same circumference as the perimeter of the square mesh. At longer times, the mesh electrode exhibits macroelectrode behaviour due to the overlap of the diffusion fields of individual mesh components. It is this behaviour that can be treated as a cubically-packed partially-blocked electrode.
The application of the micro-mesh electrode to the electrochemical determination of carbon dioxide in DMSO electrolyte solutions has been illustrated. The use of such systems in gas sensing units per se will be an interesting field.
Figure 8. Current | time responses for carbon dioxide reduction in 0.2 mol L-1 TEAP/DMSO using 300 ms potential pulses at a gold wire mesh
Acknowledgements
We thank the EPSRC for financial support via a studentship for JDW, Ben Brookes for assisting in the numerical simulation of the micro-ring electrode, Shelley Wilkins for helping take SEM images of the mesh
electrodes, and AµC Sensing, Ltd. for supporting this
project.
References
1. Wightman, R. M.; Wipf, D. O. In Electroanalytical Chemistry; Bard, A. J., ed.; Marcel Dekker: New York, 1989, vol. 15, pp. 267-353.
2. Amatore, C. In Physical Electrochemistry: Principles, Methods and Applications; Rubinstein, I., ed.; Marcel Dekker: New York, 1995, ch 4, pp.131-208.
3. Aoki, K.; Electroanalysis 1993, 5, 627.
4. Montenegro, M. I. In Research in Chemical Kinetics; Compton, R. G.; Hancock, G., eds.; Elseveir: Amsterdam, 1994, vol. 2, pp. 1-80.
5. Štulik, K.; Amatore, C.; Holub, K.; Marecek, V.; Kutner, W.; Pure Appl. Chem. 2000, 72, 1483.
6. Fleischmann, M.; Pons, S.; Rolison, D. R.; Schmidt, P. P., eds.; Ultramicroelectrodes, Datech Systems, Inc.: Morgantown, North Carolina, 1987.
7. Pilkington, M. B. G.; Coles, B. A.; Compton, R. G.; Anal. Chem. 1989, 61, 1787.
8. Neudeck, A.; Kress, L.; J. Electroanal. Chem. 1997, 437, 141. 9. Piovano, S.; Böhm, U.; J. Appl. Electrochem. 1987, 17, 123. 10. Piovano, S.; Böhm, U.; J. Appl. Electrochem. 1987, 17, 127. 11. Wragg, A. A.; Int. J. Heat Mass Transfer 1960, 11, 979. 12. Brookes, B. A.; Davies, T. J.; Fisher, A. C.; Evans, R. G.;
Wilkins, S. J.; Yunus, K.; Wadhawan, J. D.; Compton, R. G.; J. Phys. Chem. B 2003, 107, 1616.
13. Welford, P. J.; Brookes, B. A.;. Wadhawan, J. D.; McPeak, H. B.;. Hahn, C. E. W.; Compton, R. G.; J. Phys. Chem. B. 2001, 105, 5253.
14. Brookes, B. A. ; Gavaghan, D. J.; Compton, R. G.; J. Phys. Chem. B 2002, 106, 4886.
15. Amatore, C.; Savéant, J.-M.; Tessier, D.; J. Electroanal. Chem.
1983, 147, 39.
16. After prolonged electro-reduction, the PTFE case was ob-served to turn black where the mesh touched the PTFE. This is attributed to the reduction of carbon-fluorine bonds of PTFE to yield surface carbon - see Amatore, C.; Combellas, C.; Kanoufi, F.; Sella, C.; Thiébault, A.; Thouin, L.; Chem. Eur. J.
2000, 6, 820 and references cited therein.
Received: January 21, 2003