Article
0103 - 5053 $6.00+0.00*e-mail: [email protected]
Use of Doehlert Design for Optimizing the Digestion of Beans for Multi-Element
Determination by Inductively Coupled Plasma Optical Emission Spectrometry
Wagna Piler C. Dos Santos,
a,bDiogenes R. Gramacho,
aAlete P. Teixeira,
aAntônio Celso S. Costa
aand
Maria das Graças A. Korn*
,aaNúcleo de Excelência em Química Analítica (NQA-PRONEX), Grupo de Pesquisa em Química Analítica,
Instituto de Química, Universidade Federal da Bahia, Campus de Ondina, 40170-290 Salvador-BA, Brazil
bCentro Federal de Educação Tecnológica da Bahia, Barbalho, 40300-010 Salvador-BA
Neste trabalho a otimização de um procedimento rápido e de baixo custo para digestão ácida de feijão foi desenvolvida. Elementos essenciais (Ca, Cu, Fe, K, Mg, Mn, Ni, P, Zn) e não essenciais (Al, Ba, Sr) foram determinados por espectrometria de emissão óptica com plasma indutivamente acoplado (ICP OES). Foi utilizado planejamento fatorial de dois níveis fracionário com cinco fatores (volumes de HNO3 e H2O2, tempo, temperatura do bloco e tamanho de partícula). O fator temperatura foi o parâmetro mais importante e o planejamento Doehlert foi aplicado para determinar as condições ótimas, que foram obtidas quando se utiliza 3,5 mL de HNO3 concentrado e o tempo de 45 min. A exatidão foi demonstrada usando um material de referência certificado (folhas de espinafre NIST 1570a) e método oficial recomendado. Os resultados obtidos para todos os analitos foram concordantes com os valores certificados de acordo com o teste-t pareado para um nível de confiança de 95%.
In this work, the optimization of a fast and inexpensive acid wet digestion procedure for beans was developed. Essential (Ca, Cu, Fe, K, Mg, Mn, Ni, P, Zn) and non-essential (Al, Ba, Sr) elements were determined in beans degestates by inductively coupled plasma optical emission spectrometry (ICP OES). Experimental designs for five factors (HNO3 and H2O2 volume, digestion time, block temperature and particle size) were used for optimization of the digestion procedure, adopting a factorial experiment with 25-1 design. The factor block temperature was found to be the most important parameter and Doehlert designs were applied in order to determine the optimum conditions. Decomposition conditions were attained using 3.5 mL of concentrated HNO3 and lasts 45 min. The accuracy of the results was demonstrated using one certified reference material (spinach leaves NIST 1570a) and comparison with recommended official method. A paired t-test showed a good agreement for all analytes at 95% confidence values.
Keywords:experimental design, essential and non-essential elements, bean, sample digestion, ICP OES, response surface methodology, Doehlert design
Introduction
The mineral composition of food legumes is a more or less variable factor and influenced by a number of interrelated factors, such as genetic diversity, climate, soil characteristics (content of organic matter, pH and clay mineralogy), cropping strategies, transport, storage, and preparation. These factors vary from one region
to another and even within the same country.1-9 Food
legumes are crops of the family Leguminosae. They are
mainly grown for their edible seeds, and are also called
grain legumes.10 Common beans (Phaseolus spp.) are an
important food in Brazil, being responsible to improve the nutritional value of the Brazilian diet as a good source of protein (17.5 to 28.7%), carbohydrates (58.0 to 74.4%), lipids (1.0 to 4.3%), minerals (2.9 to 4.5%), hydro soluble
vitamins, soluble fibers, lectins and other vitamins.11-14
They are also considered staple food in many developing countries having great socio-economic importance and particularly in Brazil as they are cultivated and consumed in all regions. Other bean plants are also cultivated in Brazil,
such us Vigna unguiculata, L., known popularly as cowpea,
also named caupi or macaçar bean in Brazil. As well the
Cajanus cajan, L., know as pigeon pea and also called
popularlyandu, guando or guandu in Brazil.
Iron, copper, iodine, zinc, chromium, cobalt, molybdenum, manganese, nickel, selenium and fluorine are considered essential elements vitally important for human health. Lead is considered by the European and Brazilian legislations as the most important pollutant in foods and its poisoning effects are well known, as well
as those of mercury, barium and aluminum.15,16 Some
minerals essential for the normal metabolic functional of the human body can be found in beans. The most important ones among them are the macro-elements Ca, K, Mg and P, the micro-elements Cu, Fe, Mn and Zn, and the trace elements Mo, Cr and Co.
Dry ashing at 450-600 ºC has been used extensively as sample preparation procedure for the determination
of the mineral composition of grain legume,17-20 and it
is among the procedures approved by Official Methods
of Analysis of AOAC.21 However, the disadvantages of
this technique are numerous, it is very time consuming, there is the risk of losses of volatile analytes such as Zn, Cu, Fe, As, Cd, Hg and Pb, as well as a high
risk of contamination.22,23 Wet ashing has also been
described for the determination of minerals in bean seeds using mixtures of acids and other agents as oxidation
aids.7,10,24-30 Mubarak,2 using wet ashing by concentrated
nitric and perchloric acid (1:1, v/v), determined Na, K and Ca by flame photometry, Mg, Mn and Fe using atomic absorption spectrometry, and P was determined photometrically through the phosphorus molybdenite complex.
Several means can be used for the optimization of the extraction of metals from different matrices, but some of them are time-consuming: for instance, the study of each variable separately. Procedures for optimization of factors by multivariate techniques have been encouraged, as they are faster, more economical and efficient, and allow more
than one variable to be optimized simultaneously.31,32 In
order to determine the real function established among the analytical response and the significant factors, second order designs are used such as Central Composite,
Box-Behnken or Doehlert matrix.33,34 Central Composite is the
approach used most frequently but Doehlert and Box-Behnken designs require a smaller number of experiments
(N). For Doehlert (N = k2 + k + 1) and Box-Behnken
designs (N= 2k (k - 1) +1), where kis the number of
variables under study. Another advantage of the Doehlert designs over the Central Composite approach is its higher
efficiency value (I), which is determined by dividing the
coefficient number of the quadratic equation (p) by the
number of experiments (N) required for the design.35 For
Doehlert designs with k= 3, Nis equal to 13 and pis 10
yieldingI= 0.77. In turn, for central composite designs
with the same k= 3, Nis 15, pis 10 and then I= 0.67.
The optimization procedures based on these approaches are nowadays being applied to optimize sample pre-treatment and operating conditions for several analytical
techniques.36-42
The aim of this study was to develop a multi-element analytical method for bean samples using inductively coupled plasma optical emission spectrometry (ICP OES) after an appropriate wet digestion procedure with an open vessel technique. Fractional factorial and Doehlert design were applied for optimization of the experimental variables for Al, Ba, Ca, Cu, Fe, K, Mg, Mn, Ni, P and Zn determination in bean, using block digestion.
Experimental
Instrumentation and operating conditions
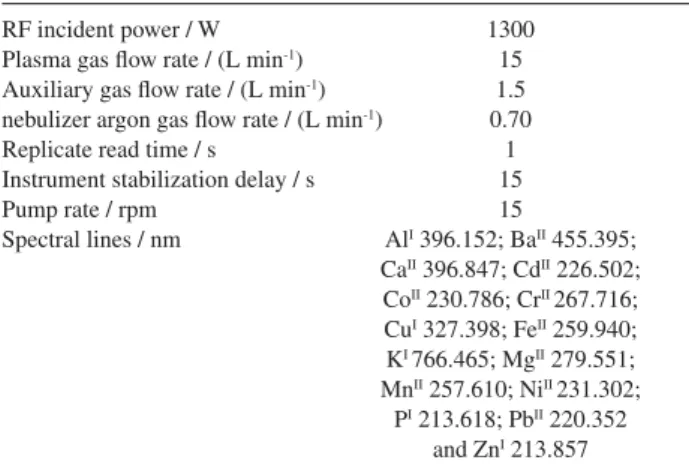
An inductively coupled plasma optical emission spectrometer with axially viewed configuration (VISTA PRO, Varian, Mulgrave, Australia) equipped with solid state detector, cyclonic spray chamber, and concentric nebulizer was employed for Al, Ba, Ca, Cd, Cr, Co, Cu, Fe, K, Mg, Mn, Ni, Pb, P and Zn determinations. The operating conditions (Table 1) were optimized in order to obtain both plasma robustness and greater
signal-to-background ratios, using MgII/MgI intensity
ratio. The emission lines were selected in order to include the most interesting elements for food analysis.
An aluminum heating block (Tecnal, Piracicaba, Brazil), a programmable muffle furnace (Quimis, São Paulo, Brazil) and hot plate have been used for sample
Table 1. Optimized instrumental conditions for multi-element ICP OES determinations in digested bean samples
RF incident power / W 1300
Plasma gas flow rate / (L min-1) 15
Auxiliary gas flow rate / (L min-1) 1.5
nebulizer argon gas flow rate / (L min-1) 0.70
Replicate read time / s 1
Instrument stabilization delay / s 15
Pump rate / rpm 15
Spectral lines / nm AlI 396.152; BaII 455.395;
CaII 396.847; CdII 226.502;
CoII 230.786; CrII267.716;
CuI 327.398; FeII 259.940;
KI766.465; MgII 279.551;
MnII 257.610; NiII231.302;
PI 213.618; PbII 220.352
mineralization and ashing. A Parr bomb (Model 4746, Parr Instrument Company, USA) and drying oven have been used for pressure digestion.
Dry beans were milled in knife micro-mill MA 630 (Marconi, Piracicaba, Brazil). Green and humid grains were triturated in a domestic processor and lyophilized in TERRONI FAUVEL LT 1000/8 lyophilizer (São Carlos, São Paulo) previous to digestion.
Reagents and solutions
until sample was completely ashed, i.e., the ash should be white/grey or slightly colored. The ashes were dissolved
with 5.0 mL of 6 mol L-1 HCl under careful heating on a
hot plate and the solution was transferred quantitatively to a 25.0 mL volumetric flask and diluted to volume with Milli-Q water.
Procedure B: acid-bomb digestion
Closed vessel steel-jacketed Teflon PTFE bombs have been traditionally employed in this laboratory for sample digestion in a conventional oven. About 0.25 g of sample was accurately weighed into dry, clean PTFE digestion
vessels, and 2.0 mL of concentrated HNO3 and 1.0 mL
30% (v/v) H2O2 were added. The bombs were closed and put
in an oven at 110 ± 10 oC for 12 h, which was the optimized
time to achieve complete dissolution. After cooling to room temperature the bombs were opened, the digested solution transferred to a 25.0 mL volumetric flask and diluted to volume with Milli-Q water. This procedure was used as reference for to obtain the response for experimental design, expressed as recovery percentages of de analytes.
Procedure C: acid wet digestion on heating block
After the optimization of the digestion conditions, the selected factors were applied to beans samples. About 0.50 g of sample was accurately weighed into glass
vessels and 3.5 mL of concentrated HNO3 was added.
The block temperature was adjusted to 150 ºC and the sample digested for 45 min. As the digestion was developed using only nitric acid the reaction mixture temperature was limited by boiling point of the concentrated acid at
atmospheric pressure (ca. 122 degrees). After cooling the
solution was filtered in quantitative filter paper and diluted to 25.0 mL with Milli-Q water.
Results and Discussion
Optimization of digestion factors
The recoveries obtained in the experiments of the
factorial plan 25-1for the digestion procedure in the
heating block was: Cu (74 to 115%), Mn (78 to 86%), Fe (58 to 100%), Ni (76 to 90%), Zn (102 to 117%), Ca (89 to 117%), K (98 to 119%), Mg (88 to 107%) and P (75 to 91%).
The results were evaluated using analysis of variance (ANOVA) and Pareto charts. The factor block temperature was statistically significant only for Zn, being affected by a positive sign (Figure 1). Also, the interactions between
temperature and particle size were significant for Mg, as shown in Figure 2. This comportment was similar for Cu, K and P and the interaction between volume of nitric acid and particle size was significant only for Cu. The interactions between volumes of nitric acid and peroxide and between temperature and time digestion were statistically significant for Mg and P.
Final optimization by Doehlert design
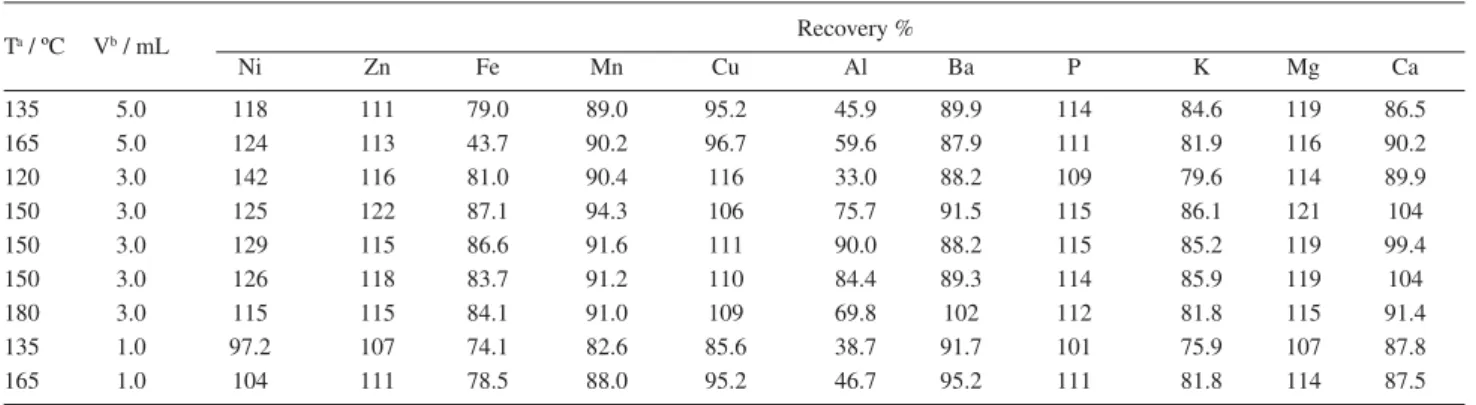
required by the Doehlert design are described in Table 3. The temperature of the heating block and volume of nitric acid varied from 120 to 180 ºC and 1.0 to 5.0 mL, respectively.
Critical points were obtained in the maximum area for micro-elements such as Al, Mn, Ni and Zn, and the macro-elements Ca, K, Mg and P. The application of Langrange‘s criterion indicated a saddle point for Ba, Cu and Fe; the results for these elements did not show a maximum within our experimental limits.
The data obtained for Al, Ca, K, Mg, Mn, Ni, P and Zn were used in the Doehlert matrix and Table 4 illustrates the relationship between the heating block temperature (T), the volume of nitric acid (V) and recovery % for these elements. The best conditions for Al, Ca, K, Mg, Mn, Ni, P and Zn were obtained within the range from 146 to 158 ºC and 3.0 to 4.0 mL of acid. This range is considered narrow could make possible a multi-element determination within the defined experimental condition of 150 ± 10 ºC and 3.5 mL of concentrated nitric acid. The corresponding surface response for Mn, Ca and P is shown in Figures 3 to 5; the profile of the surface response estimated for most of the elements was comparable to that of calcium.
Optimization of ICP OES parameters
Once the digestion conditions were fixed, the next step was to optimize the instrumental conditions for ICP OES. It is important that these parameters are defined in the presence of the sample matrix because the intensity of the element signals clearly depends on the matrix. In this study the instrumental conditions were usually adjusted
to accommodate the particular sample type, i.e. organic
materials and high dissolved solids, rather than to obtain the best limits of detection. Particularly the radio-frequency (rf) incident power and nebulizer argon gas flow rate were optimized using digested bean matrix rather than aqueous standard solutions. The rf incident power was optimized as it affects seriously the plasma temperature and improves atom excitation performance. It was studied in the range between 800 and 1400 W. The results indicated that the sensitivity and the linearity are better at 1300 W for almost all analytes with a few exceptional cases, and the stability of plasma was also improved. The effect of nebulizer
argon gas flow rate was studied from 0.5 to 0.9 L min-1 and
maximum intensity was observed at 0.7 L min-1 for almost
all analytes. Thus, a 0.7 L min-1 nebulizer argon gas flow
rate was adopted throughout this study, which provided
Table 3. Doehlert matrix and recoveries obtained for the analytes after acid digestion in heating block
Ta / ºC Vb / mL Recovery %
Ni Zn Fe Mn Cu Al Ba P K Mg Ca
135 5.0 118 111 79.0 89.0 95.2 45.9 89.9 114 84.6 119 86.5
165 5.0 124 113 43.7 90.2 96.7 59.6 87.9 111 81.9 116 90.2
120 3.0 142 116 81.0 90.4 116 33.0 88.2 109 79.6 114 89.9
150 3.0 125 122 87.1 94.3 106 75.7 91.5 115 86.1 121 104
150 3.0 129 115 86.6 91.6 111 90.0 88.2 115 85.2 119 99.4
150 3.0 126 118 83.7 91.2 110 84.4 89.3 114 85.9 119 104
180 3.0 115 115 84.1 91.0 109 69.8 102 112 81.8 115 91.4
135 1.0 97.2 107 74.1 82.6 85.6 38.7 91.7 101 75.9 107 87.8
165 1.0 104 111 78.5 88.0 95.2 46.7 95.2 111 81.8 114 87.5
Ta = block temperature ; Vb = volume of concentrated nitric acid.
Table 4. Surface response function for percent element recoveries and critical values of the heating block temperature (T) and volume of nitric acid (V) in optimized conditions
Element Surface response function (Recovery %) Critical values
Temperature / ºC HNO3 / mL
Zinc RZn = 14.5 + 1.07 T + 14.1V - 0.017T2 - 0.0033TV - 1.81V2 153 3.2
Manganese RMn = 15.1 + 0.704T + 13.1V - 0.035T2 - 0.002TV - 1.13V2 158 3.4
Aluminun RAl = -844 + 11.05T + 37.0V +0.047T2 - 0.035TV - 6.91V2 158 3.2
Nickel RNi = -208 + 3.85T +12.3V - 0.013T2 + 0.034TV - 2.862V2 150 3.2
Phosphorus RP= -63.8 + 1.79T + 24.4V - 0.11T2 - 0.005 TV - 1.09V2 148 3.8
Potassium RK = -89.7 + 1.94T + 17.0V -0.072T2 - 0.006TV - 0.856V2 150 3.7
Magnesium RMg = -67.1 + 2.00T + 20.8V -0.083 T2 - 0.006TV -1.09V2 146 4.0
high sensitivity and good precision. The optimum values for instrumental parameters are shown in Table 1.
Matrix effect and calibration techniques
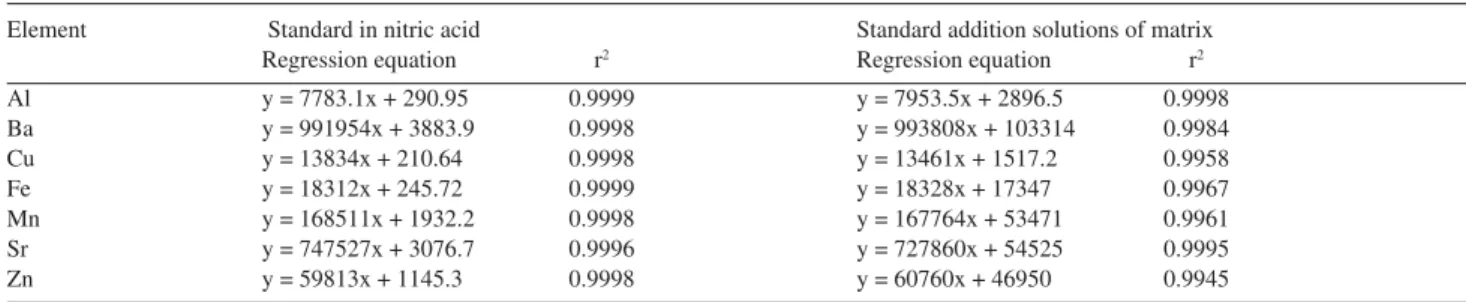
The comparison of the slopes obtained with the usual analytical curves and the curves using analyte addition indicated no significant differences at the 95%
confidence level, suggesting no detectable matrix effect for Al, Ba, Cu, Fe, Mn, Sr and Zn. As the experiments for attainment of the analytical curve they had been carried through in five levels of concentration and in third copy, it was possible to get the estimate of the random error and to calculate the lack of adjustment of the linear model. On the basis of the ANOVA it had been gotten the values of p for the lack of adjustment of the regression for the curves of calibration of the elements of Table 5. All the values of p for the adjustment lack had been greaters that 0.05, showing that the linear model is adjusted. The
regression equations and determination coefficient (r2)
of the regression lines was described in Table 5.
To evaluate the effects caused by macro-elements on the micro-elements analytical intensities, the spectral line profiles of analytes were measured on solutions containing various concentrations of the elements encountered in bean matrix such as Ca, Mg, P and K. The obtained results indicated that significant interferences were not observed on the analytical intensities (P>0.05).
The influence of the acidity of the solution obtained after the acid extraction on the analytical signal was also evaluated, considering that the volume of nitric acid was a factor studied in all of the accomplished experimental
Table 5. Comparison of the regression data using standard in nitric acid and standard addition solutions of digested bean matrix
Element Standard in nitric acid Standard addition solutions of matrix
Regression equation r2 Regression equation r2
Al y = 7783.1x + 290.95 0.9999 y = 7953.5x + 2896.5 0.9998
Ba y = 991954x + 3883.9 0.9998 y = 993808x + 103314 0.9984
Cu y = 13834x + 210.64 0.9998 y = 13461x + 1517.2 0.9958
Fe y = 18312x + 245.72 0.9999 y = 18328x + 17347 0.9967
Mn y = 168511x + 1932.2 0.9998 y = 167764x + 53471 0.9961
Sr y = 747527x + 3076.7 0.9996 y = 727860x + 54525 0.9995
Zn y = 59813x + 1145.3 0.9998 y = 60760x + 46950 0.9945
Figure 3. Surface response estimated from manganese recuperation (%). T: temperature (ºC); V: volume of 65 % (m/m) HNO3.
Figure 4. Surface response estimated from calcium recuperation (%). T: temperature (ºC); V: volume of 65% (m/m) HNO3.
design. The residual acidity for the solution corresponding to the experiment using minimum volume and temperature
and maximum time was 0.22 mol L-1. For the experiment
where was used maximum volume and time and minimum
temperature, the residual acidity was 1.8 mol L-1. Finally,
for the experiment where was used maximum volume and minimum time and temperature, the residual acidity was
2.5 mol L-1.
Thet-test at 95% confidence level was used to evaluate
the results. The analytical signal obtained for the analytes did not differ significantly (P>0.05) in the interval of acidity studied. Therefore, the analytical curve established with
1.5 mol L-1 of nitric acid was chosen.
Accuracy
Due to the lack of beans certified reference materials or more similar CRM, the accuracy of the proposed procedure was verified by the analysis of the certified reference material NIST 1570a (spinach leaves), which has been treated by the proposed procedure as well as by pressure bomb digestion, and analyzed by ICP OES. The mean values of analytes determined are shown in
Table 6. The paired t-test at 95% confidence level showed
that there was no significant difference between the means of the certified and obtained values for almost all analytes under investigation.
Moreover, all samples have been digested using the proposed open block digestion, the acid-bomb digestion and dry ashing using the official method AOAC
No. 999.11-1999.19 The results are showed in Table 7.
On the basis of an analysis of variance (ANOVA) test, the differences between the three sample preparation procedures, were found to be not significant at the 95% confidence level, considering the concentrations obtained for micro-elements Al, Cu, Fe, Mn and Ni and for the macro-elements Ca, K, Mg and P. The signals obtained for Cr, Cd, Co and Pb, with one exception, were lower than the LOD.
Figures of merit
The repeatability of the analytical procedure was obtained by taking replicate measurements of the digested
bean sample (n=10), which yielded relative standard
deviations for macro-elements between 1.05 and 2.3%. The estimative of relative standard deviations for trace elements were (%): Al (18), Ba (4.0), Cu (3.7), Fe (17), Mn (2.0), Ni (5.8), Zn (1.7).
The LOD for the block digestion procedure were calculated as the concentration equal to three times
the estimative of standard deviation of ten blanc mea-surements divided by the slope of the calibration line of
standard solutions in 1.0 mol L-1 HNO
3 The values obtained
40.0, respectively. The concentrations of micro-elements found in this work for the common bean (white, black and carioca) were in the interval from 10.3 to 106 for Al, 7.6 to 17.9 for Cu, 1.55 to 8.76 for Ba, 45.3 to 77.8 for Fe, 8.55 to 12.7 for Mn, 0.34 to 2.08 for Ni and 28.9 to 42.7 for Zn. These data demonstrate, as already stated in the Introduction, that the composition of the beans, regarding the micro-elements, varies largely with crop cultivars, soil and climatic conditions of the area, among other factors. For the macro-elements it is observed that the levels don’t
vary so much, except for P, considering the values in the literature. Therefore, it is important to study the mineral composition of food legumes for each area separately.
Conclusions
The application of a Doehlert matrix was a fast, economical and efficient way for the optimization of the proposed procedure. The developed wet digestion of bean samples, using heating block, for the multi-element
determination by ICP OES, is inexpensive, employs 3.5
mL of concentrated HNO3 and lasts 45 min. The proposed
method showed good accuracy when applied to CRM. Moreover, there were no significant difference between the results of the proposed method and the well established closed vessel and dry ashing methodologies, when applied the analysis of several commercially available beans.
Acknowledgments
The authors gratefully acknowledge Dr. Bernhard Welz for assistance with English in this manuscript and Fundação de Amparo a Pesquisa do Estado da Bahia (FAPESB), Conselho Nacional de Desenvolvimento Científico e Tecnológico (CNPq) and Coordenação de Aperfeiçoamento de Pessoal de Nível Superior (CAPES) for financial support. The authors are also grateful to Conselho Nacional de Desenvolvimento Científico e Tecnológico (CNPq) for fellowships to M. G. A. K., D. R. G. and A. P. T.
References
1. Shimelis, E. A.; Rakshit, S. K.; LWT2005,38, 331. 2. Mubarak, A. E.; Food Chem.2005,89, 489.
3. McItyre, B. D.; Boulding, D. R.; Urey, G. H.; Kizito F.;
Agricultural System2001,67, 105.
4. Sammán, N.; Maldonado, S.; Alfaro, M. E.; Farfan, N.; Gutierrez, J.; J. Agric. Food Chem.1999,47, 2685.
5. Ribeiro, H. J. S. S.; Prudencio-Ferreira, S. H.; Miyagui, D. T.;
Cienc. Tecnol. Aliment.2005,25, 165.
6. Sánchez-Mata, M. C.; Câmara, M.; Díez-Marqués, C.; Food Chem.2003,80, 317.
7. Moraghan, J. T.; Grafton, K.; J. Sci. Food Agric.2001,81, 404.
26. Ferreira, K. S.; Gomes, J. C.; Chaves, J. B. P.; Food Chem.2005,
92, 29.
27. Rivas-Vega, M. E.; Goytortúa-Bores, E.; Ezquerra-Brauer, J. M.; Salazar-García, M. G.; Cruz-Suárez, L. E.; Nolasco, H. ; Civera-Cerecedo, R.; Food Chem.2006,97, 41.
28. Koplík, R.; Mestek, O.; Komínková, J.; Borková, M.; Suchánek, M.;Food Chem.2004,85, 31.
29. Umoren, U. E.; Essien, A. I.; Ukorebi, B. A.; Essien, E. B.;
Food Chem.2005,91, 195.
30. Momen, A. A.; Zachariadis, G. A.; Anthemidis, A. N.; Stratis, J. A.; Anal. Chim. Acta2006,565, 81.
31. Ferreira, S. L. C.; Bezerra, M. A.; Dos Santos, W. N. L. ; Neto, B. B.; Talanta2003,61, 295.
32. Dos Santos, W. N. L.; Dos Santos, C. M. N.; Ferreira, S. L. C.;
Microchem. J.2003,75, 211.
33. Barros Neto, B.; Scarminio, I. S.; Bruns, R. E.; Como Fazer Experimentos, Editora da Unicamp: Campinas, 2001. 34. Montgomery, D. C.; Design and Analysis of Experiments, 4th
ed., Wiley: New York, 1997.
35. Ferreira, S. L. C., Dos Santos, W. N. L.; Quintella, C. M.; Neto, B. B.; Bosque-Sendra, J. M.; Talanta2004,63, 1061.
36. Korn, M. G. A.; Dos Santos, W. P. C.; Korn, M.; Ferreira, S. L. C.;Talanta2005,65, 710.
37. Ferreira, S. L. C., Dos Santos, H. C.; Fernandes, M. S.; De Carvalho, M. S.; J. Anal. At. Spectrom.2002,17, 115. 38. Ferreira, S. L. C., Dos Santos, W. N. L.; Bezerra, M. A.; Lemos,
V. A.; Bosque-Sendra, J. M.; Anal. Bioanal. Chem.2003,375, 443.
39. Amaro, J. A. de A.; Ferreira, S. L. C.; J. Anal. At. Spectrom. 2004,19, 246.
40. Dos Santos, W. N. L.; Dias, F. D. S.; Fernandes, M. S.; Rebouças, M. V.; Vale, M. G. R.; Welz, B.; Ferreira, S. L. C.;
J. Anal. At. Spectrom.2005,20, 127.
41. Cassella, R. J.; Sant’Ana, O. D.; Santelli, R. E.; Spectrochim. Acta, B2002,57, 1967.
42. Momen, A. A.; Zachariadis, G. A.; Anthemidis, A. N.; Stratis, J. A.; Talanta2007,71, 443.
43. Statistica for Windows, StatSoft Inc., 2300 East 14th Street,
Tulsa, OK 741014, USA, 2006.
Received: February 16, 2007