BEHAVIOUR OF COPPER AND
ALUMINIUM ELECTRODES ON EDM
OF EN-8 ALLOY STEEL
DHANANJAY PRADHAN
Department of Mechanical Engineering, Krishna Engineering College, Ghaziabad, Uttar Pradesh, 201007, INDIA
Dr. S. C. JAYSWAL
Department of Mechanical Engineering, Madan Mohan Malviya Engineering College, Gorakhpur, Uttar Pradesh, 273010, INDIA
Abstract
Electrical discharge machining (EDM) has been recognized as an efficient production method for precision machining of electrically conducting hardened materials. Copper and aluminium are used as electrode materials in this process with Kerosene oil as the dielectric medium. In this work, the behavior of copper and aluminium electrodes on electric discharge machining of EN-8 alloy steel had been studied. Keeping all other machining parameters same, the hardened work material was machined with the two electrodes at different values of peak current, pulse-on time & duty factor according to 23 full factorial design. It has been found that copper shows better results than aluminium in term of surface finish (µm) in same dielectric media. Therefore, copper is recommended as a good electrode material.
Keywords: EDM, peak current, pulse-on time, duty factor, factorial design. Nomenclature
I Current (A)
Ra Center line average surface roughness (μm) Ton Pulse-on time (μs)
Toff Pulse-off time (μs) t Pulse duty factor
1. Introduction
Electrical discharge machining (EDM) is a non-traditional concept of machining, which has been widely used to produce dies and molds. It is also used for finishing parts for aerospace and automotive industry and surgical component. The process is based on removing material from a part by means of a series of repeated electrical discharges between tool called the electrode and the work piece in the presence of a dielectric fluid. The electrode is moved toward the work piece until the gap is small enough so that the impressed voltage is great enough to ionize the dielectric. Short duration discharges are generated in a liquid dielectric gap, which separates tool and work piece. The material is removed with the erosive effect of the electrical discharges from tool and work piece. EDM does not make direct contact between the electrode and the work piece. Materials of any hardness can be cut as long as the material can conduct electricity. In this work, a study focused on the electric discharge machining of the EN-8 alloy steel, whose field of applications is in constant growth. Consequently, an analysis on the influence of current and pulse duration over surface roughness was performed. EDM is now unquestionably recognized as an important precisions machine tool forming process for producing internal shapes on work piece, traditionally the most difficult type of operation.
2. Literature Review
compelled to look for an alternative dielectric fluid to replace kerosene. In this regard, use of water is an attractive proposition especially, on account of its universal availability, low cost, good thermal characteristics, excellent wetting properties, low viscosity and pollution free working [1]. The most important parameters of EDM are the removal rate, the electrode wear, accuracy and surface texture, ‘P. M. Lonardo’ [2] showed the influence of electrode material, flushing, electrode dimension, depth of cut and planetary motion on EDM performance. Researches in the area of ceramics such as cemented carbide or hard metal had been done, a study was carried out on the influence of the factors of intensity, pulse time and duty cycle over the listed technological characteristics [3]. Optimization of the process parameters of powder mixed electrical discharge machining (PMEDM) through response surface methodology had been used to plan and analyze the experiments. Pulse on time, duty cycle, peak current and concentration of the silicon powder added into the dielectric fluid of EDM were chosen as variables to study the process performance in terms of material removal rate and surface roughness. The results identify the most important parameters to maximize material removal rate and minimize surface roughness. The recommended optimal process conditions have been verified by conducting confirmation experiments [4]. Comparative analysis of the performance of copper and aluminum electrodes for machining stainless steel and carbide has been done, showing that MRR (material removal rate) increases with increase in current and voltage, but MRR is higher during machining of stainless steel than that of carbide. Volumetric wear ratio i.e., the ratio of the material removed from the work to the same removed from the electrode decreases with increase of current or voltage. This shows comparatively more material is removed from the electrode than that removed from the work. Investigations on work surface finish show that aluminum electrodes produce smoother surface than copper electrodes during machining of both stainless steel and carbide. The surface was found to be smoother on carbide than on stainless steel [5].The behavior of non-metal and metal (graphite and copper) electrodes on EDM of AISI P20 Tool Steel were examined, the best results for mrr were reached when EDM with negative graphite electrodes. Graphite and copper tools presented similar results of MRR for positive polarity. For graphite and copper tools the lowest values of volumetric relative wear were achieved for positive polarity. The best surface roughness was obtained for copper electrodes under negative polarity [6]. Mathematical models for relating the Material Removal Rate (MRR), Tool Wear Ratio (TWR) and surface roughness (Ra) to machining parameters (current, pulse-on time and voltage) were developed. Furthermore, a study was carried out to analyze the effects of machining parameters in respect of listed technological characteristics. The results of analysis of variance (ANOVA) indicate that the proposed mathematical models, can adequately describe the performance within the limits of the factors being studied [7]. Several researchers had worked on the statistical and regression analysis using Design of Experiment Methodology to analyze the performance parameters of EDM [8, 9]. Thus, Design of Experiment Methodology is found to be very useful tool to analyze the performance parameters of EDM. Hence in the present work this methodology is used to study the behaviour of performance parameters on EN-8 alloy steel.
3. Design of Experiment
A designed experiment is a test or series of tests in which purposeful changes are made to the input variables of a process so that we may observe and identify corresponding change in the output response. Thus with the help of design of experiment statistical analysis of EDM parameters on performance parameter, there mathematical relations, effect of variables individually and there interaction effect can be derived. Here, experiment is designed according to 2k full factorial design to know the behaviour of copper and aluminium electrode on electrical discharge machining of EN-8 alloy steel assuming all changes to be linear in nature which is explained below.
3.1 2k full factorial design
Factorial design is widely used in experiments involving several factors where it is necessary to study the joint effect of these factors on a response. There are special cases of the general factorial design that are very important in the dissertation work. The first of these special cases that k factors each at only two levels. These levels may be quantitative, such as two values of current (I), pulse on-time (Ton) and pulse duty factor (t); they may be qualitative, such as two machines, two operators, the high and low levels of a factor, or perhaps the presence and absence of factor. A complete replicate of such design requires 2×2×2………×2=2k
observations, and is called a 2k factorial design. This experiment is designed according to 23 factorial design. The input parameter information is shown in the Table 1.
Table 1Input Parameter Information
Parameters Low level High level Range
Peak current (I) 8 A 24 A (0-50) A
Pulse on-time (Ton) 200 μs 750 μs (0.5, 0.75, 1,…….,4000) μs
3.2 Experimental matrix for 23 full factorial design
In experimental matrix it is convenient to represent the high level value of a factor as +1 and the low level value as -1, and transforming all the factors into the same [-1, 1] coded range. It is essential to incorporate statistical data analysis methods in the experimental design in order to draw statistically sound conclusions from the experiment.
Table 2 Experimental matrix for 23 full factorial design
S.No. Current (Amp) Ton (µs) Pulse duty factor
1 -1 -1 -1
2 +1 -1 -1
3 -1 +1 -1
4 +1 +1 -1
5 -1 -1 +1
6 +1 -1 +1
7 -1 +1 +1
8 +1 +1 +1
4. Results & Discussions
Based on experimental observations the surface roughness (Ra) for copper and aluminium electrode are calculated and summarized in the Table 3.
Table 3 Experiment matrix for Ra for Copper and Aluminium electrodes
S.No. CURRENT (A) Ton (µs) Pulse duty factor
Ra (Cu) (µm)
Ra (Al) (µm)
1 8 200 8 7.100 6.725
2 24 200 8 14.325 15.925
3 8 750 8 7.719 8.362
4 24 750 8 14.976 15.963
5 8 200 12 7.781 8.265
6 24 200 12 15.455 15.415
7 8 750 12 7.425 11.275
8 24 750 12 14.875 17.850
Based on calculations for different input parameters, the Ra is calculated and the result is analyzed according to two level full factorial design. ANOVA and Regression analysis is performed by using DOE++ software for Ra for copper and aluminium electrodes as below.
4.1 Regression Analysis of Ra for Copper electrode.
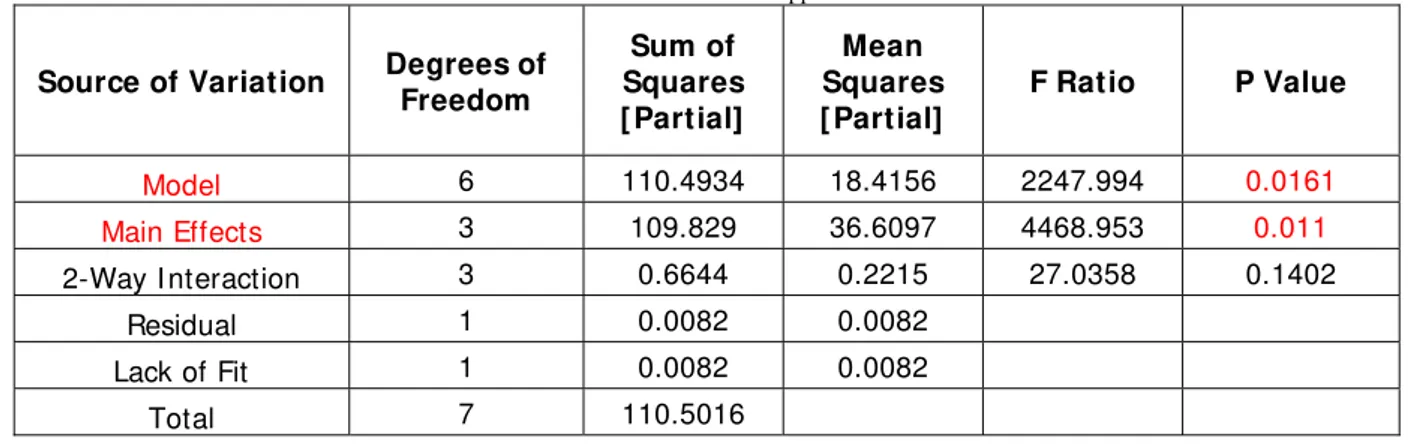
The regression statistics for the full two factor interaction model are shown in Table 4. The predicted R2 value and the adjusted R2 value were found to be in close agreement.
Table 4 ANOVA for Ra for Copper electrode
Source of Variation Degrees of
Freedom Sum of Squares [ Partial] Mean Squares [ Partial]
F Ratio P Value
Model 6 110.4934 18.4156 2247.994 0.0161
Main Effects 3 109.829 36.6097 4468.953 0.011
2-Way I nteraction 3 0.6644 0.2215 27.0358 0.1402
Residual 1 0.0082 0.0082
Lack of Fit 1 0.0082 0.0082
Total 7 110.5016
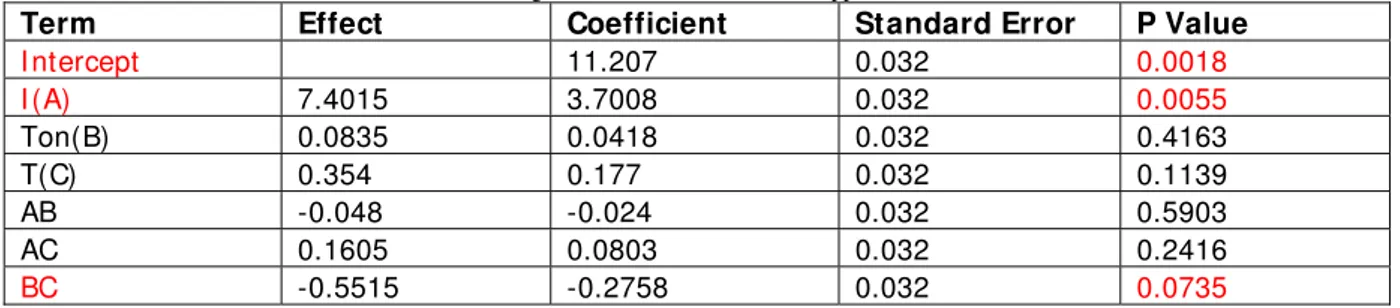
Table 5 Regression information Ra for Copper electrode
Term Effect Coefficient Standard Error P Value
I ntercept 11.207 0.032 0.0018
I (A) 7.4015 3.7008 0.032 0.0055
Ton(B) 0.0835 0.0418 0.032 0.4163
T(C) 0.354 0.177 0.032 0.1139
AB -0.048 -0.024 0.032 0.5903
AC 0.1605 0.0803 0.032 0.2416
BC -0.5515 -0.2758 0.032 0.0735
Adjusted R2 is a measure of the amount of variation about the mean which is explained by the model. 99.30% of the observed variation in the response can be explained by the model. When there is a large difference in the values of predicted R2 the adjusted R2, it indicates that some non-significant terms have been included in the model and the model would improve on excluding such terms.The ANOVA table for the reduced two factor interaction model is shown in Table 5.7. Values of probability less than 0.100 indicate model terms are significant. In this case I, Ton, t, I Ton, I t and Ton t; were significant model terms. Values greater than 0.100 indicates that the model terms are not significant, though probability corresponding to t has value 0.1139 which is very near to 0.100; so this value is also considered in the model.
The final regression equation for Ra in terms of the actual parameter values is: Ra=11.207+3.7008 I+0.177t-0.2758Tont
Where, Ra is in micro meter; I is in ampere; Ton is in micro second and t is dimensionless.
4.2 Main effect plot of Ra for Copper electrode
Based on above statistical analysis main effect plot Ra Vs Factors (current, pulse on time and pulse duty factor) is drawn. From the Fig.1, it is clear that peak current (I) peak current is the most influential factor and with the increase in the value of peak current leads to higher surface roughness due to increase in discharge heat energy at the point where the discharge takes place. At this point, a pool of molten metal is formed and is overheated. The overheated molten metal evaporates forming gas bubbles that explode when the discharge ceases, taking molten metal material away. The result is the formation of crater. Successive discharges that have a random nature will result in the formation of overlapped crater. Pulse duty factor influence surface roughness very little as it can be seen from the figure. The other factor, i.e. pulse-on time is constant.
4.3 Interaction Matrix of Ra for Copper electrode
The increasing peak current with increasing pulse on-time and pulse duty factor respectively at both the levels increases the value of surface roughness as shown in Fig.2.
Fig.2 Interaction Matrix of Ra for copper electrode
4.4 Regression Analysis of Ra for Aluminium electrode
Adjusted R2 is a measure of the amount of variation about the mean which is explained by the model. 99.30% of the observed variation in the response can be explained by the model.
Table 6 ANOVA for Ra for Aluminium electrode
Source of Variation Degrees of
Freedom
Sum of Squares
[ Partial]
Mean Squares [ Partial]
F Ratio P Value
Model 6 130.6151 21.7692 166.0857 0.0593
Main Effects 3 127.065 42.355 323.143 0.0409
2-Way I nteraction 3 3.5501 1.1834 9.0284 0.2388
Residual 1 0.1311 0.1311
Lack of Fit 1 0.1311 0.1311
S = 0.362, R-sq = 99.90%, R –sq(adj) = 99.30%
Table 7 Regression information Ra for Aluminium electrode
Term Effect Coefficient Standard Error P Value
I ntercept 12.4725 0.128 0.0065
I (A) 7.6315 3.8158 0.128 0.0213
Ton(B) 1.78 0.89 0.128 0.0909
t(C) 1.4575 0.7288 0.128 0.1107
AB -0.5435 -0.2717 0.128 0.2802
AC -0.769 -0.3845 0.128 0.2046
BC 0.9425 0.4713 0.128 0.1688
The final regression equation for Ra in terms of the actual parameter values is: Ra=12.4725+3.8158I+0.89Ton+0.7288t
Where, Ra is in micro meter; I is in ampere; Ton is in micro second and t is dimensionless.
4.5 Main effect plot of Ra for Aluminium electrode
Based on above statistical analysis main effect plot Ra Vs Factors (current, pulse on time and pulse duty factor) is drawn. From the Fig.3, it is clear that peak current (I) peak current is the most influential factor and with the increase in the value of peak current leads to higher surface roughness due to increase in discharge heat energy at the point where the discharge takes place. Pulse-on time and pulse duty factor influence surface roughness very little as it can be seen from the figure.
4.6 Interaction Matrix of Ra for Aluminium electrode
From the interaction plot we can conclude that with the increasing peak current with increasing pulse- on time and pulse duty factor respectively at both the levels, Ra increases as shown in Fig.4.
Fig.4 Interaction Matrix of Ra for Aluminium electrode
When pulse-on time is increased with current then there is increase in Ra at low level and severe increase in Ra at high level. With the increase in pulse duty factor with current, shows constant Ra at both levels. When pulse-on time is increased with pulse duty factor then there is slight increase in t Ra at low level and increases more at high level which is just opposite as in the case of Ra value for copper electrode. From the discussion it is clear that surface roughness increases with the increase in the value of current, pulse on-time and pulse duty factor. The surface roughness first increases slightly with the pulse duty factor and then increases severely with further increase of the pulse duty factor.
5. Conclusions
• The regression technique is an important tool for representing the relation between machining characteristic and EDM process input parameters, and the obtained mathematical models, indicate this correlation perfectly.
• Results show that the Design of Experiment (D.O.E.) is a powerful tool for providing experimental
diagrams and statistical-mathematical models, to perform the experiments appropriately and economically.
• Copper clearly distinguishes itself as a superior electrode material which gives good surface finish than
aluminium in all case of current and pulse on time.
• For all values of the peak current, surface roughness increases with the increase of the pulse-on time on both the electrodes.
• During the experimentation, it is observed that a black layer forms on the tool electrode surface and
machined surface when machining is carried out. This layer of carbon from the decomposition of the dielectric and some material may have come from the melted workpiece particles. This finding suggests that material deposition takes place during EDM process and it can be utilized for selective surface modification of the workpiece surface by selection of appropriate dielectric media and electrode tool material.
REFERENCES
[1] Jilani, S.T., Pandey, P.C., Experimental Investigation into the Performance of water as Dielectric in EDM (1984), International
Journal of Machine Tool Design and Research, 24,pp. 31-43.
[2] Lonardo, P.M., Bruzzone, A.A., Effect of Flushing and Electrode Material on Die Sinking EDM. (1999), Annals of CIRP, 48, p.p
123-126.
[3] Puertas, I, Luis, C.J., Alvarez, L., Analysis of the influence of EDM parameters on surface quality, MRR and EW of WC–Co
(2004), Journal of Materials Processing Technology, 123, p.p. 1026-1032.
[4] Kansal, H.K., Singh, S., Kumar, P., Parametric optimization of powder mixed electrical discharge machining by response surface
methodology (2005), Journal of Materials Processing Technology, 169, p.p. 427-436.
[5] Khan, A.A., Saifuddin, S.E., Wear Characteristics of Copper and Aluminum Electrodes During EDM of Stainless Steel and
Carbide (2005), Bangladesh, International Conference on Mechanical Engineering.
[6] Amorim, F.L., Weingaertner, W.L., The Behavior of Graphite and Copper Electrodes on the Finish Die-Sinking Electrical
Discharge Machining (EDM) of AISI P20 Tool Steel (2007),Journal of the Brazil Society of Mechanical Science & Engineering.
4, p.p. 366-371.
[7] Tebni, W., Boujelbene, M., Bayraktar, E., Salem, E.B., Parametric Approach Model for Determining Electrical Discharge
Machining (EDM) Conditions: Effect of Cutting Parameters on the Surface Integrity (2009), The Arabian Journal for Science and Engineering, 34, p.p. 101-114.
[8] Prabhu, S., Vinayagam, B.K., Effect of Graphite Electrode Material on EDM of AISI D2 Tool Steel with Multiwall Carbon
Nanotube Using Regression Analysis (2009), International Journal of Engineering Studies, 1, p.p. 93–104.
[9] Kumara, S., Singh, R., Singh, T.P., Sethi, B.L., Surface modification by electrical discharge machining: A review (2009), Journal