CPD
5, 1853–1882, 2009Sea level 400,000 years ago (MIS 11)
D. Q. Bowen
Title Page
Abstract Introduction
Conclusions References
Tables Figures
◭ ◮
◭ ◮
Back Close
Full Screen / Esc
Printer-friendly Version
Interactive Discussion
Clim. Past Discuss., 5, 1853–1882, 2009 www.clim-past-discuss.net/5/1853/2009/
© Author(s) 2009. This work is distributed under the Creative Commons Attribution 3.0 License.
Climate of the Past Discussions
Climate of the Past Discussionsis the access reviewed discussion forum ofClimate of the Past
Sea level 400 000 years ago (MIS 11):
analogue for present and future sea-level
D. Q. Bowen
School of Earth and Ocean Sciences, CardiffUniversity, Cardiff, CF10 3YE, UK Received: 29 April 2009 – Accepted: 7 May 2009 – Published: 13 July 2009 Correspondence to: D. Q. Bowen (bowendq@cardiff.ac.uk)
CPD
5, 1853–1882, 2009Sea level 400,000 years ago (MIS 11)
D. Q. Bowen
Title Page
Abstract Introduction
Conclusions References
Tables Figures
◭ ◮
◭ ◮
Back Close
Full Screen / Esc
Printer-friendly Version
Interactive Discussion Abstract
Comparison of sea-levels today and 400 000 years ago (MIS 11), when the Earth’s or-bital characteristics were similar, may provide indications of future sea-level during the present interglacial. Evidence for former sea-levels occur on uplifting coastlines where shorelines are preserved. The sea-level term and the uplift term may be separated 5
with an “uplift uplift correction” formula. This discovers the original sea-level at which the uplifted shoreline was fashioned. Estimates are based on average uplift rates of the “last interglacial” sea-level (MIS 5.5) using a range estimates for sea-level and age at that time and at different locations. These, with varying secular tectonic regimes in different ocean basins, provide a band of estimates for MIS 11. They show the MIS 11 10
sea-level was close to its present level and Greenland and West Antarctic ice volumes were similar to present.
1 Introduction
The importance of estimating the sea-level of oxygen isotope stage 11 (MIS 11) at
∼400 ka is because it may be an analogue for present and future sea-level. Then,
15
and now, orbital eccentricity was low and precession dampened (Berger and Loutre, 2002). Previous proposals of the MIS 11 sea-level at the land-ocean interface occur in two groups. A sea-level between 0 to 5 to m (Bender et al., 1979; Schellmann and Radtke, 2004a, b; Bowen, 2003b, c) which compares with inferences from oxygen isotope stratigraphy of a band between∼0 m (McManus et al., 2003) and∼6 m
(Wael-20
broeck, 2002). And a higher group of about+20 m (Pirrazoli et al., 1993; Howard, 1997; Hearty; 2002; Hearty et al., 1999; Olson and Hearty, 2009; Rohling et al., 1998). Given the potential analogue of MIS 11 sea-level for present and future ones it is desirable to resolve this difference.
An entirely new way of looking at past sea-level variability stemmed from the oxygen 25
be-CPD
5, 1853–1882, 2009Sea level 400,000 years ago (MIS 11)
D. Q. Bowen
Title Page
Abstract Introduction
Conclusions References
Tables Figures
◭ ◮
◭ ◮
Back Close
Full Screen / Esc
Printer-friendly Version
Interactive Discussion
tween oxygen isotope variability and classical continental stratigraphy. Subsequently, Fairbridge (1961) proposed correlations between sea-levels, marine oxygen isotope and solar variability. Whereas Emiliani (1955) placed greater emphasis on the tempera-ture term in the partitioning of16O and18O (δ18O), Shackleton (1967) argued that ben-thic foraminifera inhabited deep water where little if any temperature change occurred 5
thus eliminating the temperature term in theδ18O signal and leaving a continental ice volume signal as a surrogate for sea level. Shackleton and Opdyke (1973) explored this further when they suggested that 0.1‰ ofδ18O change was equivalent to a 100 m of sea-level change: thus 0.01‰ corresponded with 10 m of sea-level change. This is no longer the case because ocean bottom water temperatures changed in the past 10
and regional hydrological variability was also a factor in the partitioning of the oxygen isotope signal (e.g. Lea et al., 2002). Many clever attempts have been made to convert oxygen isotope variability to its sea-level equivalent by: for example, Chappell (1974), Shackleton and Chappell (1986), Shackleton (1987), Waelbroeck et al. (2002) and Mc-Manus et al. (2003). Presently it is generally believed that ocean core SITE 849 from 15
the NE Pacific may provide the closest approximation for sea levels (Mix et al., 1995). Evidence for former sea-levels is provided by: marine terraces, shoreline angles, ero-sional and bioeroero-sional notches, littoral and beach sediments, back-barrier deposits, fossil corals, and other marine organisms that indicate past water levels. Others in-clude a potential range of water levels: for example, corals grow up to mean low water 20
mark and may show variability up to 5 m water depth and with rising sea level some reefs are “keep up” (Barbados), “catch up” (Bermuda) or “give up” (Muhs et al., 2002). The most reliable indicators of former sea-levels these are shoreline angles, notches and back barrier deposits and these are addressed at different locations (Table 1).
2 Method
25
CPD
5, 1853–1882, 2009Sea level 400,000 years ago (MIS 11)
D. Q. Bowen
Title Page
Abstract Introduction
Conclusions References
Tables Figures
◭ ◮
◭ ◮
Back Close
Full Screen / Esc
Printer-friendly Version
Interactive Discussion
(Chappell, 1974). The “uplift correction” formula used in this study is based on Pillans et al. (1998):
S =H−Ut,withU =(H∗−S∗)/t∗ (1)
whereS is sea-level at time t relative to present sea-level, H is the elevation of the marine deposit with aget, and whereU is the average tectonic uplift rate at a location. 5
U is calculated from the heightH∗of a reference marine deposit of aget∗.
Relatively few age estimates are available from the MIS 11 (11.3) shoreline although some locations are dated by ESR, AAR, TL. Time t, however, is taken as event 11.3 (406 ka) on the Bassinott et al. (1994) timescale. It receives strong support from the 40
Ar/39Ar ages of 416±11 and 407±11 on tephra within estuarine sediments
down-10
stream from Rome (Karner and Marra, 2003). Time t* is used for estimating uplift age for uplift correction but there is no universal agreement for its precise age or elevation of its sea-level. Ages for MIS 5.5 range from∼132 to 116 ka and indicate a longer
inter-glacial than predicted by orbital theory (Muhs, 2002; Muhs and Sabot, 1994; Muhs et al., 2002; Stein et al., 1993). The global complexity of the climate system has resulted 15
in a long sea-level response for the last interglacial (Muhs et al., 2002) and different responses to earlier ones (Siddall et al., 2007). During the∼16 kyrs of the last
inter-glacial (MIS 5.5) some variability in sea-level occurred, on the one hand as inferred by Oppo et al. (2006) from ODP 980 west of Ireland; and on the other hand from the detailed geomorphological mapping and ESR ages on reefs and terraces in Barbados 20
(Schellmann and Radtke, 2004a, b). It has been suggested that the highest MIS 5.5 sea-level occurred late and precipitously during the interglacial and was caused by a catastrophic collapse of the West Antarctic ice sheet (Neumann and Hearty, 1996; Hearty et al., 2007), but this has received little support (Carew, 1997; Mylroie, 1997).
The elevation of the last interglacial MIS 5.5 sea level (H∗) has been commonly
25
CPD
5, 1853–1882, 2009Sea level 400,000 years ago (MIS 11)
D. Q. Bowen
Title Page
Abstract Introduction
Conclusions References
Tables Figures
◭ ◮
◭ ◮
Back Close
Full Screen / Esc
Printer-friendly Version
Interactive Discussion
fossil corals throughout the Pacific and Indian Oceans are found consistently between
+2 m and +m. Broecker et al. (1968); Chappell, (1974); Bloom et al. (1974) and many others have since used a+6 m reference as a de facto global eustatic sea-level for the last interglaciation” (Murray-Wallace and Belperio, 1991). They proposed that the Gawler craton coastline in South Australia was a better MIS 5.5 sea-level datum 5
because its shoreline runs for some 150 km at 2 m. Similarly a stable area of West Australia has proposed as an informal type area for the MIS 5.5 sea-level where TIMS ages of 128±1 to 116±1 on corals lie at about 3 m above sea-level (Stirling, et al.
1998).
Because of the range of ages and sea-level elevation for MIS 5.5 in the literature, a 10
range of values is used to explore possible uplift rates and calculations of the MIS 11 sea-level (Appendix, Table 2 and Fig. 1). Calculations based on the uplift rate for the MIS 5.5 sea-level at different locations are made with that sea-level at 2 m, 3 m and 6 m for ages of 116 ka, 124 ka and 132 ka which represent the earliest, latest, and median ages of MIS 5.5. An Appendix presents the raw data from which outliers, defined at or 15
greater than two standard deviations, have been removed and rounded up (Appendix, Table 2 and Fig. 1).
Viscoelastic Earth models have investigated glacio-hydro-isostatic processes that caused spatial and temporal variability in sea-level for Termination 1 at the MIS 2/1 transition (e.g. Peltier, 2004) and Termination 2 at the MIS 6/5.5 (Lambeck and Nakada, 20
1992; Potter and Lambeck, 2003;). Such models, however, require verification by field geology and a powerful argument against the glacio-hydro-isostatic model for T2 is the observation that MIS 5.5 marine deposits on apparently stable intermediate-field localities such as Bahamas, Bermuda, California and Baja California are: “not signifi-cantly higher than those of MIS 5.5 age in far-field apparently stable localities such as 25
CPD
5, 1853–1882, 2009Sea level 400,000 years ago (MIS 11)
D. Q. Bowen
Title Page
Abstract Introduction
Conclusions References
Tables Figures
◭ ◮
◭ ◮
Back Close
Full Screen / Esc
Printer-friendly Version
Interactive Discussion
Muhs et al. (2002) suggest that such a high sea level should be expected given com-plete deglaciation of the Laurentide Ice Sheet at a time when Baffin Island was warmer than the Holocene (Miller et al., 1999; Wolfe et al., 2000). Summer temperatures higher than present in northern Fennoscandia during MIS 5.1 also suggest complete deglacia-tion of the Fennoscandian ice sheet (Valiranta et al., 2009). Thus not only could the 5
MIS 5.1 sea level have been close to present, its effect on soft sediment coasts may have been significant and could account for the MIS 5.1 sea level at Gomez Pit, Virginia (Mirecki et al., 1995). For Termination V at the MIS 12/11 transition it is unlikely that that secular tectonic average has been overprinted by glacio-hydro-isostatasy.
3 Location
10
The locations are discussed in ascending order of average uplift rates (Table 1). The appendix, Table 2 and Fig. 1 show the estimated elevations for the MIS 11 shoreline based on different initial assumptions for the selected locations. Much importance is attached to age estimates and elevation of the MIS 5.5 sea-level on which the extrap-olated average uplift rate is calculated.
15
3.1 Charleston, South Carolina, USA
The Atlantic Coastal Plain between the Fall Line and the edge of the Continental Shelf is the inner edge of a passive continental margin and its marine sediments range from Miocene to Holocene (Cronin, 1981). Their study has been characterised by two approaches one geomorphic the other palaeontological. While the former recog-20
CPD
5, 1853–1882, 2009Sea level 400,000 years ago (MIS 11)
D. Q. Bowen
Title Page
Abstract Introduction
Conclusions References
Tables Figures
◭ ◮
◭ ◮
Back Close
Full Screen / Esc
Printer-friendly Version
Interactive Discussion
other and consist of burrowed, fine to medium-grained sand with interbedded mud and shells; well-sorted fine to medium-grained sand and back-barrier muddy fine to medium-grained sand, mud and shells as well as fluvial lithofacies. By comparison with modern and Holocene (Unit Q1) deposits McCartan (1988) believed that “The highest back-barrier deposits mark approximately the highest relative sea-level for each period 5
of deposition”. Back-barrier deposits up to 8 m occur in Unit Q2 (Wando Formation) and its late Pleistocene (5.5) age is based on U-series alpha ages on corals between 90 and 120 ka (McCartan et al., 1980; Szabo, 1985) and AAR as well as relatively fresh minerals (McCartan et al., 1982). The Ladson Formation (Unit Q4) of Malde (1959) has back-barrier deposits up to 15 m. It is correlated with the Canepatch Formation at Myr-10
tle Beach (SC) by a U-series alpha age of about 450 ka and by mollusc and ostracode faunas (Cronin in McCartan, 1988). The occurrence of the coccolithGephyrocapsa
supports an age ascribed to MIS 11 (Cronin et al., 1984). Uplift rates calculated from event MIS 5.5 back-barrier deposits do not differ greatly from those of Cronin (1981) who used shoreline datums that he related to lithospheric flexure of the Coastal Plain-15
offshore Carolina platform and Carolina Trough.
3.2 The Coorong Coastal Plain (SE South Australia)
SE South Australia has an uplifted Plio-Pleistocene record of back-barrier deposits (Murray-Wallace, 2002). Back-barrier lagoon and estuarine deposits are preserved in inter-dune corridors where largely unsorted facies with articulated inertial fauna are 20
used for determining sea-levels (Murray-Wallace, 2002). These are dated by U-series, amino acid racemization (AAR), ESR ages of molluscs and corals and TL dating of quartz sand from aeolianites on a transect from Robe to Naracoorte (Murray-Wallace, 2002). The MIS 5.5 sea-level is represented by the Woakwine barrier deposits at 1 m with a TL age of 132±9 ka. The higher East Avenue 11.3 barrier sea-level lies at 2 m
25
with a T L age of 414±29 (Murray-Wallace, 2002). Based on an uplift rate from an
CPD
5, 1853–1882, 2009Sea level 400,000 years ago (MIS 11)
D. Q. Bowen
Title Page
Abstract Introduction
Conclusions References
Tables Figures
◭ ◮
◭ ◮
Back Close
Full Screen / Esc
Printer-friendly Version
Interactive Discussion
3.3 Curacao (Netherlands Antilles)
The island of Curacao consists of off-lapping carbonate units forming marine terraces on a volcanic basement. Using TIMS age estimates Lundberg and McFarlane (2002) identified sea-levels related to the MIS 5.5 and MIS 11 events. The former has a well-preserved notch at 10.5 m with a TIMS age of 123.65±0.35 ka on coral. A TIMS age
5
of 412±14 ka on coral was obtained from “the base of the MIS 11 terrace” at 21 m
whereas the notch at the rear of the terrace is at 37 m.
4 Oahu (Hawaii)
The Waimanalo Formation, mapped by Stearns in 1939 (Stearns, 1966), was later remapped east of Kaena Point (Muhs and Szabo, 1994). TIMS age estimates on the 10
Waimanalo Formation confirm its MIS 5.5 age (Muhs et al., 2002). Along the west and northwest coasts of Oahu between Kaena Point and Waianae lie well exposed reefs and shoreline deposits between 0 and 28 m (Hearty, 2002). Those up to 12 m are believed to represent event MIS 5.5 as suggested by TIMS ages at Kahe Point (Muhs and Szabo, 1994).
15
At higher elevations (∼30 m) Stearns (1978) mapped the Kaena high stand of
sea-level for which Veeh estimated an age of 600±100 ka from infinitely aged alpha
sam-ples (Stearns, 1978). Muhs and Szabo (1994) who commented that the sedimentology of the deposits was not characteristic of a giant wave (unlike McMurtey et al., 2007) confirmed their general elevation. Those at 28 m have been ascribed to MIS 11 age 20
(Hearty, 2002) which is close to an ESR age of 468±136 (Jones, 1993). Hearty
de-scribed a section 2 km south-east of Kaena Point where a beach conglomerate, corre-lated with MIS 5.5 lies in a shoreline angle at∼11 m (Hearty, 2002). Above it at 29 m
is a similar deposit with amino acid ratios correlated with MIS 11. Similar field relations between the MIS 5.5 and MIS 11 sea level indicators also occur at the Waianae Health 25
CPD
5, 1853–1882, 2009Sea level 400,000 years ago (MIS 11)
D. Q. Bowen
Title Page
Abstract Introduction
Conclusions References
Tables Figures
◭ ◮
◭ ◮
Back Close
Full Screen / Esc
Printer-friendly Version
Interactive Discussion
and Szabo, 1994) and 0.06 m/ka (Grigg and Jones, 1997).
4.1 The Nome Coastal Plain (Alaska)
Six high stands of sea-level are found on the Nome Arctic Coastal Plain and consist of shorelines and superimposed shelf sequences with fossil evidence for climate that was as warm as or warmer than present. Beaches, barrier islands and spits of the 5
Pelukian marine transgression 12 m (Brigham-Grette and Hopkins, 1995) and are cor-related with event MIS 5.5 (Brigham-Grette, 1999). At 23 m above sea level lie shelf, beach and lagoonal sediments of the Karmuk Member of the Gubik Formation that is correlated with the Anvillian marine deposits of the Alaskan Coastal Plain (Kauf-man, 1992; Kaufman and Brigham-Grette, 1993). This has a U-series trend age of 10
540±60 ka (Brigham, 1985), AAR age estimates of about 475 ka. The deposits have
been correlated with the middle of theRhizosolenia barboi diatom zone between 430 and 360 ka Pushgar et al. (1999).
4.2 San Paulo Formation, Rome
Downstream from Rome fluviodeltaic sediments include the San Paulo Formation, silty 15
sand that includes ostracodes, foraminifera as well asCerastodermaand Tellina that indicate a brackish water environment (Karner and Marra, 1998). Its upper surface lies at 63 m (Karner and Marra, 1998; Karner and Renne, 1998; Karner and Marra, 2003) and40Ar/39Ar ages of 416±11 and 407±11 on tephra are part of the formation (Karner
and Marra, 2003). Downstream the 5.5 terrace with a shoreline angle 20 m (Giordana 20
et al., 2003) allows the calculation of uplift rates and the 11.3 sea-level.
4.3 Oceanside, San Diego County, California
CPD
5, 1853–1882, 2009Sea level 400,000 years ago (MIS 11)
D. Q. Bowen
Title Page
Abstract Introduction
Conclusions References
Tables Figures
◭ ◮
◭ ◮
Back Close
Full Screen / Esc
Printer-friendly Version
Interactive Discussion
“gently warped beach ridges and terraces” that show “long-term vertical structural sta-bility” (Lajoie et al., 1979). Some have age estimates provided by U-series and AAR. The most widespread terraces are related to the Nestor Terrace∼120 ka and the Bird
Rock Terrace∼80 ka that both run northwards along the coast (Lajoie et al., 1991; Kern
and Rockwell, 1992). Several marine terraces show lateral continuity up to 10 km, but 5
shoreline angles are frequently masked by varying thicknesses of colluvium that in-creases for higher and older terraces. Using uplift rates calculated from the elevation of the Nestor Terrace Kern and Rockwell (1992) predicted the ages of higher terraces. With a sea-level of 6 m, for the Nestor Terrace (5.5) uplift rates varied between 0.13 and 0.14 ka and they predicted that the Parry Grove Terrace at an average elevation of 10
55 m was 413 ka (MIS 11) in age.
4.4 Barbados
Barbados has long been the testing field for U-series ages (Alpha to TIMS using230Th and 231Pa/235Th ages) on coral terraces (Bender et al., 1979; Broecker et al., 1968; Mesolella et al., 1969; Edwards et al., 1997). ESR ages on coral samples from sites 15
determined by detailed geomorphological field mapping of former sea cliffs, erosional notches, reef crests, and wave cut terraces to an accuracy of 1 m demonstrated 18 separate stands of sea-level compared with only 11 previously recognised (Schellmann and Radtke, 2004a, b). The highest MIS 5.5 elevation is 39 m with an ESR age of 132 ka. Estimated elevations for the MIS 11 shoreline are shown on Table 1, Appendix 20
and Fig. 1. The preferred estimate for the MIS 5.5 sea-level is 2 m which subject to uplift rate determination gives sea-level elevations for 398 ka (Terrace T-12) of −2 m
and for 410 ka (Terrace T-13) of 5 m (Schellmann and Radtke, 2004a, b).
4.5 Westport, South Island New Zealand
Seawards of the Paparoa Range and south of Westport in the northwest of South Island 25
CPD
5, 1853–1882, 2009Sea level 400,000 years ago (MIS 11)
D. Q. Bowen
Title Page
Abstract Introduction
Conclusions References
Tables Figures
◭ ◮
◭ ◮
Back Close
Full Screen / Esc
Printer-friendly Version
Interactive Discussion
by way of Westport and Greymouth to Hokitika and are gently warped by a series of west to east folds that run more or less normal to the coastline. Suggate (1992) used traverses across the terraces, a 5.5 sea-level of+6 m, and uplift correction to propose the elevation of sea-levels from events 5.1 to 14. The terrace identified as 400 ka in age was ascribed to a sea-level of 0 m compared with the present (Suggate, 1992). 5
4.6 Sumba Island, Indonesia
Jouannic et al. (1988) mapped a flight of marine terraces at Cape Laundi on the north-ern side of Sumba Island Indonesia (map in Bard et al., 1996), the oldest of which was correlated with MIS 27 (Pirazzoli et al., 1993). ESR ages on corals correlated with MIS 15 and MIS 9 showed an “uplift trend” of 0.49 m/ka (Pirazzoli et al., 1993). Bard et 10
al. (1996) used TIMS and AMS ages that identified the 5.1, 5.3, 5.5 (between 119 and 132 ka) and MIS 9 (∼305 ka). They suggested that the average uplift rate lies between
0.2 to 0.5 m/ka, but the data of Pirazzoli et al. (1993, Fig. 9) provide an uplift rate of 0.49 m/ka. The 5.5 sea-level lies at 60 m.
4.7 Autaro Island, Indonesia
15
Chappell and Veeh (1978) who established an uplift rate of 0.47 m/ka based on the in-ner margins of the terraces mapped well-preserved marine terraces at Berau in south-ern Autaro Island. Alpha U-series ages suggest that reef 2 marks the 5.5 sea level. Its inner margin of reef 2 lies at 63 m.
4.8 Chala Bay, Southern Peru
20
CPD
5, 1853–1882, 2009Sea level 400,000 years ago (MIS 11)
D. Q. Bowen
Title Page
Abstract Introduction
Conclusions References
Tables Figures
◭ ◮
◭ ◮
Back Close
Full Screen / Esc
Printer-friendly Version
Interactive Discussion
Hall et al., 2008). Goy et al. (1992) identified the highest 5.5 terrace (III) at 68 m and the 11.3 terrace at 200 m.
5 Bermuda and the Bahamas
High MIS 11 sea-levels have been proposed for the apparently stable carbonate plat-forms of Bermuda (21 m) and Eluthera Island in The Bahamas (18 m) (Hearty, 1998, 5
2002; Hearty and Kaufman, 2000; Hearty et al., 1999; Kindler and Hearty, 2000; Olson and Hearty, 2009). These have been widely adopted in the literature (e.g. Howard, 1997; Rohling et al., 1998).
5.1 Bermuda
Fossiliferous deposits described as typical of a foreshore assemblage lie in within 10
karstic features in Government Quarry at 21 m (Hearty, 1998, 2002; Hearty and Kauf-man, 2000; Hearty et al., 1999; Kindler and Hearty, 2000; Olson and Hearty, 2009). At the Calonectris Quarry (Government Quarry) at 21.3 m they consist of a conglomerate with rounded and flattened cobbles of limestone overlain by poorly sorted calcarenite with marine and terrestrial shells, coral fragments and an extensive avifauna. (Olsson 15
and Hearty, 2009). TIMS ages on a “flowstone” of 312±30 and 360±30 ka and from
its base 364±24, 405±28 and 409±15 ka. The mean age of these ages is 399±11 ka
(McMurty et al., 2007; Olson and Hearty, 2009). McMurty et al. (2007), howver, at-tributed the deposits to a mega tsumani. In describing the “foreshore” assemblage of fossiliferous deposits from the fissure at Calonectris Quarry at 21.3 m Olsson and 20
CPD
5, 1853–1882, 2009Sea level 400,000 years ago (MIS 11)
D. Q. Bowen
Title Page
Abstract Introduction
Conclusions References
Tables Figures
◭ ◮
◭ ◮
Back Close
Full Screen / Esc
Printer-friendly Version
Interactive Discussion
for emplacement in a phreatic system. The present position of the Calonectris quarry, some distance landwards from the Holocene shoreline because of quarrying opera-tions, lends support to this “hurricane-phreatic” hypothesis
Other marine and aeolian deposits for former sea-levels lie in a zone within only a few meters of present sea-level with an MIS 5.5 sea-level of about 6 m. The definitive 5
paper of Land et al. (1967) provided the stratigraphical scheme subsequently modified by Vacher (1981). Alpa U-series age estimates (Harmon et al., 1983) clustered into two groups: 228 to 220 ka from the Belmont and 134±8 to 118±+6 ka with a mean age of
125±4 ka from the Devonshire Formation (Rocky Bay Formation). Muhs et al. (2002)
provided TIMS ages: two of 200 and 198 ka for the Belmont Formation; six further 10
ages between 125 and 113 ka for the Rocky Bay (5.5) Formation; and seventeen for the Southampton Formation at Fort St. Catherine of∼80 ka.
5.2 The Bahamas
Eluthera lies in the path of the NE trade winds and consists of carbonate aeolianite blown onshore during times of low sea-levels (Carew and Mylroie, 1995, 1999); the ae-15
olianite is subdivided by palaeosols that formed during warmer times (Mylroie, 2008). It has been claimed that MIS 11 marine sands with ooids and fenestral structures in sands on Eluthera lie at ∼18 m (Hearty, 1998; Hearty et al., 1999). No
geochrono-logical ages are available despite some textual ambiguity in Hearty et al. (1999). Myl-roie (2008) however showed that at the proposed MIS 11 site on the east coast of 20
Eluthera consists of the infilling of a small bench in an older aeolianite by modern Holocene sands with a fenestral porosity characteristic of many such Holocene de-posits that look like such beaches although they are less than one year old and were emplaced during storm events at present sea-level (Mylroie, 2008).
Raised marine deposits in situ only occur up to 3 m (Mylroie, 2008) represent the 25
CPD
5, 1853–1882, 2009Sea level 400,000 years ago (MIS 11)
D. Q. Bowen
Title Page
Abstract Introduction
Conclusions References
Tables Figures
◭ ◮
◭ ◮
Back Close
Full Screen / Esc
Printer-friendly Version
Interactive Discussion
5.5 peak sea-level occurred late in the interglacial (Neumann and Hearty, 1996; Hearty et al., 2007) but field geologists on the islands (Carew, 1997; Mylroie, 1997; Carew and Mylroie, 1999) do not support this.
Evidence for high MIS sea-levels at ∼20 m in Bermuda and The Bahamas is
con-troversial (McMurty et al., 2007; Mylroie, 2008) and is not supported by evidence from 5
uplifted global shorelines (Appendix, Table 2, Fig. 1). Both islands lie within the hur-ricane belt and both have phreatic drainage systems within the calcareous aeoliante deposits that, in the case of Bermuda, may have been influential in simulating evidence for marine deposits in situ.
6 Discussion
10
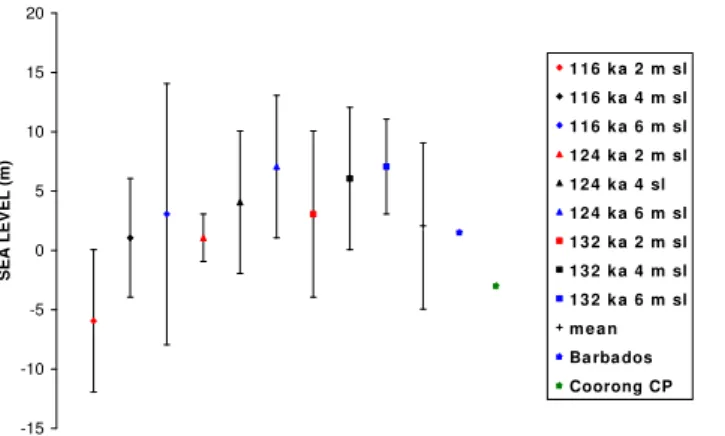
Figure 1 shows the range of possible sea-levels for MIS 11.3 from uplift correction calculations based on different assumptions (Appendix, Table 2, and Fig. 1). Also included in Fig. 1 are estimates from Barbados and The Coorong Coastal Plain. The preferred calculation of Schellmann and Radtke (2004a, b) is 1.5 m (average of 5 m for Terrace T 13 at 410 ka and−2 m sea-level for Terrace T 12 at 398 ka) based on uplift
15
correction using an MIS 5.5 sea-level at 2 m. The Coorong Coastal Plain calculation of
−3 m sea-level at 420 ka is also based on a 2 m sea-level for MIS 5.5 (Murray-Wallace,
2002). The mean value of these is 0±4 m. Because of their detailed geomorphology
and geochronological age estimates these are arguably the most important locations under consideration. Both lie within a band defined by 2 m±7 from the raw data from
20
uplift correction and in particular close to the 124 ka at 2 m sea-level of 1 (−0.8)±2 m
(Appendix, Table 2). Schellmann and Radtke (2004a, b) found that the Barbados data best fitted with the MIS 5.5 sea-level of 2 from the Gawler Craton (above) of Murray-Wallace and Belperio (1991) and not with estimates based on an MIS 5.5 sea-level of 6 m (see also Appendix). Estimates of the MIS 11 sea-level based on uplift correction 25
CPD
5, 1853–1882, 2009Sea level 400,000 years ago (MIS 11)
D. Q. Bowen
Title Page
Abstract Introduction
Conclusions References
Tables Figures
◭ ◮
◭ ◮
Back Close
Full Screen / Esc
Printer-friendly Version
Interactive Discussion
If the MIS 11 sea-level was at∼20 m then the sea-level rise from the MIS 12 low stand
of – 140 m (Rohling et al., 1998) saw it rise 160 m which compares with only 130 m at the MIS 2/1 sea-level rise. Where did the extra 30 m of sea-level come from? What melted? Could it happen again (Chappell, 1998)? Hearty et al. (1999) suggested that the melting of Antarctic ice caused the MIS 11 high sea-level although the potential 5
to raise present sea-levels with contributions of meltwater from the Greenland and Antarctic ice sheets is dominated by uncertainties (Alley, et al., 2005).
An MIS 11 sea-level at or close to present does not require melting of the West Antarctic and Greenland ice sheets because only 140 m of sea-level rise is required. This is only 10 m more than the MIS 2/1 (Termination I) rise in sea-level, a quantity 10
readily accounted for by the melting of mid-latitude northern hemisphere ice sheets that were at their greatest extent of the last 0.5 Ma in MIS 12 (Sibrava et al., 1986). Indeed the survival of MIS 7 ice in Greenland precludes complete melting even during MIS 5.5 (Suwa et al., 2006). It is also pertinent to note that Chappell (1974) calculated the 400 000 sea- level close to 0 m on the Huon Peninsula, New Guinea.
15
7 Conclusions
The sea-level of MIS 11 was close to present. There is no need to invoke additional melting of the West Antarctic and Greenland ice sheets for the rise in sea-level from the MIS 12 low stand at 140 m. The melting of northern hemisphere mid-latitude ice-sheets at their greatest extent during MIS 12 yielded the greatest transfer of continental 20
ice volume to the oceans of the last 0.5 Ma.
An MIS 11 sea-level close to present concurs with inferences drawn from benthic oxygen isotope stratigraphy (McManus et al., 2003) and lies well within the band of sea-levels estimated by Waelbroeck (2002).
Data from uplifted shorelines and inferences from benthic oxygen isotope stratigra-25
CPD
5, 1853–1882, 2009Sea level 400,000 years ago (MIS 11)
D. Q. Bowen
Title Page
Abstract Introduction
Conclusions References
Tables Figures
◭ ◮
◭ ◮
Back Close
Full Screen / Esc
Printer-friendly Version
Interactive Discussion
analogue for the present and future of the current interglacial. Neither of these data sets supports the notion of an MIS 11 sea-level at∼20 m.
As proposed by Berger and Loutre (2002) the MIS 11 interglacial was the longest of the last 0.5 Ma and they believed it was an analogue for the present interglacial. The implication for future sea-level is that any changes will be forced by natural variability 5
caused by millennial and orbital forcing.
Acknowledgements. I thank the Leverhulme Trust for an Emeritus Fellowship (2005–2007) for international travel. John Mercer inspired me with his ideas on the relations between the last interglacial sea-level and the West Antarctic ice-sheet as we watched fireflies in his Columbus Ohio garden in 1969. Pat Suggate introduced me to the Westport New Zealand marine terraces
10
on an INQUA trip in 1973 – whence I returned in 1980; Brad Pillans introduced me to the shorelines of the Wanganui area North Ireland New Zealand in 1986; John Wehmiller and Ken Lajoie introduced me to the marine terraces in California between San Diego and Ventura in 1979 and Kathryn Hanson generously provided me with data and maps of the mid-California coastal section for field work in the 1990s. John Wehmiller and Tom Cronin took me to the
15
Gomez Pit in Virginia. Len Vacher and John Wehmiller introduced me to Bermuda on the GSA Penrose meeting in Bermuda in 1977 – whence I later returned. I also thank the South Carolina State Geological Survey who provided information, Julie Brigham-Grette, John Hollin, Jerry McManus, Colin Murray-Wallace, John Mylroie, Dan Muhs, Chronis Tzedakis, Linda York and Steve Walsh for their comments that helped this project along its way.
20
References
Alley,R. B., Clark, P. U., Huybrechts, P., and Joughin, I.: Ice-Sheet and Sea-Level Changes, Science, 310, 456–460, 2005.
Bard, E., Jounnic, C., Hamelin, B., Pirazzoli, P., Arnold, M., Faure, G., and Sumosusastro, S.: Pleistocene sea-levels and tectonic uplift based on dating of corals from Sumba Island,
25
Geophys. Res. Lett., 23, 1473–1476, 1996.
CPD
5, 1853–1882, 2009Sea level 400,000 years ago (MIS 11)
D. Q. Bowen
Title Page
Abstract Introduction
Conclusions References
Tables Figures
◭ ◮
◭ ◮
Back Close
Full Screen / Esc
Printer-friendly Version
Interactive Discussion
Berger, W. H. and Loutre, M. F.: An exceptionally long interglacial ahead, Science, 297, 1287– 1288, 2002.
Bloom, A. L., Broecker, W. S., Chappell, J., Matthews, R. L., and Mesolella, K. J.: Quater-nary sea-level fluctuations on a tectonic coast: New 230Th/238U U-series dates from Huon Peninsula, New Guinea, Quaternary Res., 4, 185–205, 1974.
5
Bowen, D. Q.: Uncertainty in oxygen isotope stage 11 sea-level: an estimate 13±2 m above low water from Great Britain, In: Droxler, A., Poore, R. Z., and Burkle, L. H.: Earth’s Cli-mate and Orbital Eccentricity: The Marine Isotope Stage 11, Geophysical Monograph 137, American Geophysical Union, 131-144, 2003a.
Bowen, D. Q. : In search of the stage 11 sea level: traces on the global shore, Published
10
abstract: XVI INQUA Congress, Reno, Nevada, 126, 2003b.
Bowen, D. Q.: Sea level and the “stage 11 problem”, Eos, Transactions American Geophysical Union, 84(46), 2003c.
Brigham, J. K.: Marine stratigraphy and amino acid geochronology of the Gubik Formation western Arctic Coastal Plain, Alaska, US Geological Survey Open-file report, 85–381, 1985.
15
Brigham-Grette, J. K.: Marine isotopic stage 11 high sea-level record from northwest Alaska, In: Poore, R. Z., Burkle, L., Droxler, A., and McNulty, W. E.: Marine Oxygen Isotope Stage 11 and associated Terrestrial Records, US, Department of the Interior Open-File Report, 99–312, 19–21, 1999.
Brigham-Grette, J. K. and Hopkins, D. M.: Emergent marine record and paleoclimate of the last
20
interglaciation along the northwest Alaskan coast, Quaternary Res., 43, 154–173, 1995. Broecker, W. S., Thurber, D. L., Goddard, J., Ku, T. L., Matthews, R. K., and Mesolella, K. J.:
Milankovitch hypothesis supported supported by precise dating of coral reefs and deep sea sediments, Science, 159, 297–310, 1968.
Carew, J. L.: Comment on Neumann and Hearty (1996), Geology, 572–573, 1977.
25
Carew, J. L. and Mylroie, J. E.: Depositional model and stratigraphy for the Quaternary geology of the Bahama Islands, In: Curran, H. A., and White, B. (eds): Terrestrial and Shallow Marine Geology of the Bahamas and Bermuda, Special Paper 300, Geol. Soc. Am., 5–32, 1995. Carew, J. L. and Mylroie, J. E.: A review of the last interglacial sea-level highstand (oxygen
isotope substage 5e): Duration, magnitude and variability from Bahamian Data, in:
Proceed-30
CPD
5, 1853–1882, 2009Sea level 400,000 years ago (MIS 11)
D. Q. Bowen
Title Page
Abstract Introduction
Conclusions References
Tables Figures
◭ ◮
◭ ◮
Back Close
Full Screen / Esc
Printer-friendly Version
Interactive Discussion
Chappell, J.: Geology of coral terraces, Huon Peninsula, New Guinea: a study of Quaternary tectonic movements and sea-level changes, Geol. Soc. Am. Bull., 85, 553–570, 1974. Chappell, J.: Jive talking, Nature, 394, 130–131, 1998.
Chappell, J. and Veeh, H. H.: Late Quaternary tectonic movements and sea-level changes at Timor and Atauro Island, Geol. Soc. Am. Bull., 89, 356–368, 1978.
5
Chen, J. H. Curran, H. A., White, B., and Wasserberg, G. J.: Precise geochronology of the last interglacial period: 234U–230Th data from fossil coral reefs in the Bahamas, Geol. Soc. Am. Bull., 103, 312–321, 1991.
Colquhoun, D. J.: Terrace sediment complexes in central South Carolina, Columbia, University of South Carolina, 1–62, 1965.
10
Colquhoun, D. J., Johnson, G. H., Peebles, P. C., Huddlestun, P. F., and Scott, T.: Quaternary geology of the Atlantic coastal plain, in: Quaternary nonglacial geology: Conterminous US, edited by: Morrison, R. B., The Geology of North American Vol. K-2, Boulder, USA, 629–650, 1991.
Cronin, T. M.: Vertical crustal movements Atlantic Coastal Plain, Geol. Soc. Am. Bull., 92,
15
812–833, 1981.
Cronin, T. M., Szabo, B. J., Ager, T. A., Hazel, J. E., and Owens, J. P.: Quaternary climates and sea levels of the US, Atlantic coastal plain, Science, 211, 233–240, 1981.
Cronin, T. M., Bybell, L. M., Poore, R. Z., Blackwelder, B. W., Liddicoat, J. C., and Hazel, J. E.: Age and correlation of emerged Pliocene and Pldeposits, U.S., Atlantic Coastal Plain,
20
Palaeogeography, Palaeoclimatology and Palaeoecology, 47, 21–51, 1984.
Edwards, R. L., Cutler, K. B., Cheng, H., and Gallup, C. D.: Geochemical Evidence for Qua-ternary Sea-level Changes, Chapter 17, Vol. 6, in: Treatise on Geochemistry, edited by: Holland, H. D., Turekian, K. K., and Elderfield, H., 6, 343–364, 2004.
Emiliani, C.: Pleistocene temperatures, J. Geology. 63, 538–578, 1955.
25
Fairbridge, R. W.: Eustatic changes in sea-level, Phys. Chem. Earth, 4, 99–185, 1961.
Hall, S. R., Farber, D. L., Audin, L., Finkel, R. C., and M ´eriaux, A. S.: Geochronology of ped-iment surfaces in southern Peru: implications for Quaternary deformation of the Andean forearc, Tectonophysics, 459, 186–205, 2008.
Giordana, G., Esposito, A., De Rita, D., Fabbri, M., Mazzini, I., Trigari, A., Carlo Rosa, C.,
30
CPD
5, 1853–1882, 2009Sea level 400,000 years ago (MIS 11)
D. Q. Bowen
Title Page
Abstract Introduction
Conclusions References
Tables Figures
◭ ◮
◭ ◮
Back Close
Full Screen / Esc
Printer-friendly Version
Interactive Discussion
Goy, J. L., Machare, J., Ortlieb, L., and Zazo, C.: Quaternary shorelines in Southern Peru: a record of global sea-level fluctuations and tectonic uplift in Chala Bay, Quatern. Int., 15/16, 99–112, 1992.
Grigg, R. W. and Jones, A. T.: Uplift caused by lithospheric flexure in the Hawaiian Archipelago as revealed by elevated coral deposits, Mar. Geol., 141, 11–25, 1997.
5
Hearty, P. J.: The geology of Eluthera Island, Bahamas: a Rosetta Stone of Quaternary stratig-raphy and sea-level history, Quaternary Sci. Rev., 17, 333–355, 1998.
Hearty, P. J.: The Kaena highstand of Oahu, Hawaii: further evidence of Antarctic ice collapse during the Middle Pleistocene, Pacific Science, 56, 65–81, 2002.
Hearty, P. J. and Kaufman, D. S.: Whole-Rock aminostratigraphy and Quaternary sea-level
10
history of the Bahamas, Quatern. Res., 54, 163–173, 2000.
Hearty, P. J., Kindler, P., Cheng, H., and Edwards, R. L.: A+20 m middle Pleistocene sea-level highstand (Bermuda and the Bahamas) due to partial collapse of Antarctic ice, Geology, 27, 375–378, 1999.
Hearty, P. J., Hollin, J. T., and Neumann, A. C.: Global sea-level fluctuations during the Last
15
Interglaciation (MIS 5e), Quaternary Sci. Rev., 26, 2090–2112, 2007. Howard, W.: A warm future in the past, Nature, 388, 418–419, 1997.
Kindler, P. and Hearty, P. J.: Elevated marine terraces from Eluthera (Bahamas) and Bermuda: sedimentological, petrographic and geochronological evidence for important deglaciation events during the middle Pleistocene, Global Planet. Change, 24, 41–58, 2000.
20
Jones, A. T.: Review of the chronology of the marine terraces in the Hawaiian Archipelago, Quaternary Sci. Rev., 12, 811–823, 1993.
Jouannic, C., Hantoro, W. S., Hoang, C. T., Fournier, M., Lafont, R., and Ichtam, M. L.: Quater-nary raised reef terraces at cape Laundi, Sumba, Indonesia: geomorphological analysis and first radiometric Th/U and 14C age determinations, in: 6th Proceedings International coral
25
reef symposium, edited by: Choat, J. H., Bellwood, D., Clements, K., Townsville, Australia, 2, 441–447, 1988.
Karner, D. B. and Marra, F.: Correlation of fluviodeltaic aggradationsal sections with glacial climate history: a revision of the Pleistocene stratigraphy of Rome, Geol. Soc. Am. Bull., 110, 748–758, 1998a.
30
CPD
5, 1853–1882, 2009Sea level 400,000 years ago (MIS 11)
D. Q. Bowen
Title Page
Abstract Introduction
Conclusions References
Tables Figures
◭ ◮
◭ ◮
Back Close
Full Screen / Esc
Printer-friendly Version
Interactive Discussion
American Geophysical Union, 61–68, 2003.
Karner, D. H. and Renne, P. R.: 40Ar/39Ar geochronology of Roman volcanic province tephra in the Tiber river valley: age calibration of middle Pleistocene sea-level changes, Geol. Soc. Am. Bull., 110, 740–747, 1998.
Kaufman, D. S.: Aminostratigraphy of Pliocene-Pleistocene high sea-level deposits, Nome
5
coastal plain and adjacent near shore are, Alaska, Geol. Soc. Am. Bull., 104, 40–52, 1992. Kaufman, D. S. and Brigham-Grette, J. K.: Aminosratigraphic correlations and
paleotempera-ture implications, Piocene-Pleistocene high sea-level deposits northwestern Alaska, Quater-nary Sci. Rev., 12, 21–33, 1993.
Kern, J. P. and Rockwell, T. K.: Chronology and deformation of Quaternary marine shorelines,
10
San Diego County, in: Quaternary coasts of the United States: marine and lucustrine sys-tems, edited by: Fletcher III., C. H., Wehmiller, J. F., Society for Sedimentary Geology Special Publication, 48, Tulsa, Oklahoma, 377–384, 1992.
Ku, T. L., Kimmel, M. A., Easton, W. H., and O’Neil, T. J.: Eustatic sea-level 120 000 years ago on Oahu, Hawaii, Science, 183, 959–962, 1974.
15
Land, L. S., Mackenzie, F. T., and Gould, S. J.: The Pleistocene history of Bermuda, Geological Society America Bulletin, 78, 993–1006, 1967.
Lajoie, K. R., Kern, J. P., Wehmiller, J. F., Kennedy, G. L., Mathieson, S. A., Sarna-Wojcicki, A. M., Yerkes, R. F., and McCrory, P. F.: Quaternary marine shorelines and crustal deformation, San Diego to Santa Barbara, California, in: Geological Excursions to the Califfornia area,
20
edited by: Abbott, P. L., GSA meeting San Diego, 3–15, 1979.
Lajoie, K. R., Ponti, D. J., Powell, C. L., Mathieson, S. A., and Sarna-Wojcicki, A. M.: Emergent marine strandlines and associated sediments, coastal California: a record of Quaternary sea-level fluctuations, vertical tectonic movements, climatic changes and coastal processes, in: Quaternary nonglacial geology: Conterminous US, edited by: Morrison, R. B., The
Geol-25
ogy of North American Vol. K-2, Boulder, USA, 190–196, 1991.
Lambeck, K. and Nakada, M.: Constraints on the age and duration of the last interglacial period and on sea-level variations, Nature, 357, 125–128, 1992.
Lea D. W., Martin P. A., Pak D. K., and Spero H. J.: Reconstructing a 350 ky history of sea-level using planktonic Mg/Ca and oxygen isotopic records from a Cocos Ridge core, Quaternary
30
Sci. Rev., 21(1–3), 283–293, 2002.
CPD
5, 1853–1882, 2009Sea level 400,000 years ago (MIS 11)
D. Q. Bowen
Title Page
Abstract Introduction
Conclusions References
Tables Figures
◭ ◮
◭ ◮
Back Close
Full Screen / Esc
Printer-friendly Version
Interactive Discussion
Malde, H.: Geology of the Charleston phosphate area, South Carolina, US, Geological Survey Bulletin, 1–105, 1959.
McManus, J., Oppo, D., Cullen, J., and Healey, S.: Marine Isotope Stage 11 (MIS 11): analog for Holocene and future climate in: Earth’s Climate and Orbital Eccentricity: The Marine Isotope Stage 11, edited by: Droxler, A., Poore, R. Z., and Burkle, L. H., Geophysical Monograph
5
137, American Geophysical Union, 69–85, 2003.
McCartan, L.: Studies related to the Charleston, South Carolina, Earthquake of 1886 – Neo-gene and Quaternary lithostratigraphy and biostratigraphy, US, Geological Survey, 1988. McCartan, L., Weems, R. E., and Lemon Jr., E. M.: The Wando Formation (upper Pleistocene)
in the Charleston, S. C. area, in Contributions to stratigraphy, US, Geological Survey Bulletin,
10
1502-A, A110–A116, 1980.
McCartan, L., Owens, J. P., Blackwelder, B. W., Szabo, B. J., Belknap, D. F., Kriausakul, N., Mit-terer, R. M., and Wehmiller, J. F.: Comparison of amino acid racemization geochronometry with lithostratigraphy, biostratigraphy, uranium-series coral dating and magnetostratigraphy in the Atlantic Coastal Plain of the southeastern United States, Quatern. Res., 18, 337–359,
15
1982.
McCartan, L., Lemon Jr., E. M., and Weems, R. E.: Geologic map of the area between Charleston and Orangeburg, South Carolina, US, Geological Survey Map I-1472, 1984. McMurtry, G. M., Tappin, D. R., Sedwick, P. N., Wilkinson, I., Fietzke, J., and Sellwood, B.:
Elevated marine deposits in Bermuda record a late Quaternary Megatsunami, Sediment.
20
Geol., 200(3–4), 155–165, 2007.
Mesolella, K. J., Matthews, R. K., Broecker, W. S., and Thurber, D. L.: The astronomical theory of climatic change: data, J. Geology, 77, 250–274, 1969.
Mirecki, J., Wehmiller, J. F., and Skinner, A. F.: Geochronology of Quaternary Coastal Plain deposits, Southeastern Virginia, US, J. Coastal Res., 11, 1135–1144, 1995.
25
Miller, G. H., Mode, W. N., Wolfe, A. P., Sauer, P. E., Bennike, O., Forman, S. L., Short, S. K., and Stafford Jr., T. W.: Stratified interglacial lacustrine sediments from Baffin Island, Arctic Canada: chronology and paleoenvironmental implications, Quaternary Sci. Rev., 18, 789– 810, 1999.
Mix, A. C., Pisias, N. G., Rugh, W., Wilson, J., Morey, A., and Hagelberg, T. K.: Benthic
30
CPD
5, 1853–1882, 2009Sea level 400,000 years ago (MIS 11)
D. Q. Bowen
Title Page
Abstract Introduction
Conclusions References
Tables Figures
◭ ◮
◭ ◮
Back Close
Full Screen / Esc
Printer-friendly Version
Interactive Discussion
Muhs, D. R.: Evidence for the timing and duration of the last interglacial period from high precision uranium series ages of corals on tectonically stable coastlines, Quatern. Res., 58, 36–40, 2002.
Muhs, D. R., Simmons, K. R., Kennedy, G. L., and Rockwell, T. K.: The last interglacial period on the Pacific Coast of North America: timing and paleoclimate, Geol. Soc. Am. Bull., 114,
5
569–592, 2002.
Muhs, D. R. and Szabo, B. J.: New uranium-series ages of the Waimanalo Limestone, Oahu, Hawaii: implications for sea-level during the last interglacial period, Mar. Geol., 118, 315– 326, 1994.
Muhs, D. R., Simmons, K. R., and Steinke, B.: Timing and warmth of the last interglacial
10
period: new U-series evidence from Hawaii and Bermuda and a new fossil compilation for North America, Quaternary Sci. Rev., 21, 1355–1383, 2002.
Muhs, D. R., Rockwell, T. K., and Kennedy, G. L.: Late Quaternary uplift rates of marine terraces on the Pacific Coast of North America, Southern Oregon to Baja California Sur, Quatern. Int., 15/16, 121–133, 1992.
15
Muhs, D. R., Wehmiller, J. F., Simmons, K., and York, L. L.: Quaternary sea-level history of the United States, in: The Quaternary Period in the United States, edited by: Gillespie, A. R., Porter, S. C., and Atwater, B. F., Elsevier, Amsterdam, 147–184, 2004.
Murray-Wallace, C. V.: Pleistocene coastal stratigraphy, sea-level highstands and neotectonism of the southern Australian passive continental margin – a review, J. Quatern. Sci., 17, 469–
20
489, 2002.
Murray-Wallace, C. V. and Belperio, A. P.: The last interglacial shoreline in Australia – a review, Quaternary Sci. Rev., 10, 441–461, 1991.
Mylroie, J. E.: Comment on Neumann and Hearty (1966), Geology, 573–574, 1997.
Mylroie, J. E.: Late Quaternary sea-level position: Evidence from Bahamian carbonate
deposi-25
tion and dissolution cycles, Quatern. Int., 183, 61–75, 2008.
Neumann, A. C. and Hearty, P. J.: Rapid sea-level changes at the close of the Last Interglacial (stage 5e) recorded in Bahamian Island geology, Geology, 24, 775–778, 1996.
Olson, S. L. and Hearty, P. L.: A sustained+21 m sea-level highstand during MIS 11 (400 ka): direct fossil and sedimentary evidence from Bermuda, Quaternary Sci. Rev., 28, 271–285,
30
2009.
CPD
5, 1853–1882, 2009Sea level 400,000 years ago (MIS 11)
D. Q. Bowen
Title Page
Abstract Introduction
Conclusions References
Tables Figures
◭ ◮
◭ ◮
Back Close
Full Screen / Esc
Printer-friendly Version
Interactive Discussion
Ortlieb, L., Guzman, N., and Marquardt, C.: A longer lasting and warmer interglacial episode during isotopic stage 11: marine terrace evidence in tropical Western Americas, in: Earth’s Climate and Orbital Eccentricity: The Marine Isotope Stage 11, edited by: Droxler, A., Poore, R. Z., and Burkle, L. H., Geophysical Monograph 137, merican Geophysical Union, 157–180, 2003.
5
Peltier, W. R.: Global glacial isostasy and the surface of the ice-age Earth, Annu. Rev. Earth Pl. Sc., 32, 111–149, 2004.
Pillans, B., Chappell, J. W. C., and Naish, T. R.: A review of the Milankovitch climatic beat: template for Plio-Pleistocene sea-level changes and sequence stratigraphy, Sediment. Geol., 122, 5–21, 1998.
10
Pirazzoli, P. A., Radtke, U., Hantoro, W. S., Jouannic, C., Hoang, C. T., Causse, C., and Borel Best, M.: A one-million-year-long sequence of marine terraces on Sumba Island, Indonesia, Mar. Geol., 109, 221–236, 1993.
Potter, E. K. and Lambeck, K.: Reconciliation of sea-level observations in the western North Atlantic during the last glacial cycle, Earth Planet. Sc. Lett., 217, 171–181, 2003.
15
Pushgar, V. S., Roof, S. R., Hopkins, D. M., and Brigham-Grette, J.: Paleogeographic and paleoclimatic significance of diatoms from Middle Pleistocene marine and glaciomarine de-posits on Baldwin Peninsula, northwestern Alaska, Palaeogeography, Palaeoclimatology and Palaeoecology, 152, 67–85, 1999.
Rohling, E. J., Fenton, M., Jorissen, F. J., Bertrand, P., Ganssen, G., and Caulet, J. P.:
Magni-20
tudes of sea-level lowstands of the past 500 000 years, Nature, 394, 162–165, 1998. Schellmann, G. and Radtke, U.: A revised morpho- and chronostratigraphy of the Late and
Middle Pleistocene coral reef terraces on Southern Barbados (West Indies), Earth Sci. Rev., 64, 157–187, 2004a.
Schellman, G. and Radtke, U.: The marine Quaternary of Barbados, K ¨olner Geographische
25
Arbeiten, 81, 1–137, 2004b.
Shackleton, N. J.: The last interglacial in the marine and terrestrial record, Proceedings Royal Society of London, 215, 135–154, 1967.
Shackleton, N. J. and Chappell, J.: Oxygen isotopes and sea level, Nature, 324, 137–140, 1986.
30
Shackleton, N. J.: Oxygen isotopes, ice volume and sea-level, Quaternary Sci. Rev., 6, 183– 190, 1987.
CPD
5, 1853–1882, 2009Sea level 400,000 years ago (MIS 11)
D. Q. Bowen
Title Page
Abstract Introduction
Conclusions References
Tables Figures
◭ ◮
◭ ◮
Back Close
Full Screen / Esc
Printer-friendly Version
Interactive Discussion
Equatorial Pacific core V28-238: oxygen isotope temperatures and ice volumes on a 105 year and 106year scale, Quaternary Res., 3, 39–55, 1973.
Sibrava V., Bowen D. Q., and Richmond, G. M.: Glaciations in the Northern Hemisphere, (Project 24 International Geological Correlation Programme), Quaternary Sci. Rev., 5, 511 pp., 1986.
5
Siddall, M., Chappell, J., and Potter, E. K.: Eustatic sea-level during past interglacials, in: Sirocko, F., Claussen, M., S ´anchez Go ˜ni, M. F., and Litt T.: The Climate of Past Interglacials, Elsevier, Amsterdam, 75–92, 2007.
Stearns, H. T.: Geology of the State of Hawaii, Pacific Books, Palo Alto, 1966.
Stearns, H. T.: Quaternary shorelines in the Hawaian Islands, Bernice P. Bishop Museum
10
Bulletin, 237, 1–57, 1978.
Stein, M., Wasserburg, G. J., Aharon, P., Chen, J. H., Zhu, Z. R., Bloom, A., and Chappell, J.: TIMS U-series dating and stable isotopes of the last interglacial event in Papua New Guinea, Geochimma et Cosmochimica Acta, 57, 2541–2554, 1993.
Stirling, C. H. Esat, T. M. Lambeck, K., and McCulloch, M. T.: Timing and duration of the last
15
interglacial: evidence for a restricted interval of widespread coral reef growth, Earth Planet. Sci., 160, 745–762, 1998.
Stone, G. W., Walker, N. D., Hsu, S. A., Babin, A., Liu, B., Keim, B. D., Teague, W., Mitchell, D., and Leben, R.: Hurricane Ivan‘s Impact along the northern Gulf of Mexico, EOS, Transactions of the American Geophysical Union, 86(48), 497–501, 2005.
20
Suggate, P.: Differential uplift of middle and late Quaternary shorelines northwest South Island, New Zealand, Quaternary International, 15/16, 47–59, 1992.
Suwa, M., von Fischer, J. C., and Bender, M. L.: Chronology reconstruction for the disturbed bottom section of the GISP2 and the GRIP ice cores: Implications for Termination II in Green-land, J. Geophys. Res., 111, D02101, doi:10.1029/2005JD006032, 2006.
25
Szabo, B. J.: Uranium-series dating of fossil corals from marine sediments of southeastern United States Atlantic coastal plain, Geol. Soc. Am. Bull., 96, 398–406, 1985.
Szabo, B. J., Ludwig, K. R., Muhs, D. R., and Simmons, K. R.: Thorium-230 ages of corals and duration of the last interglacial sea-level high stand on Oahu, Hawaii, Science, 266, 93–96, 1994.
30
CPD
5, 1853–1882, 2009Sea level 400,000 years ago (MIS 11)
D. Q. Bowen
Title Page
Abstract Introduction
Conclusions References
Tables Figures
◭ ◮
◭ ◮
Back Close
Full Screen / Esc
Printer-friendly Version
Interactive Discussion
Veeh, H. H.: Th230/U238 and U234/U238 ages of Pleistocene high sea level stand, J. Geophys. Res., 71, 3379–3386, 1966.
Waelbroeck, C., Laberyie, L., Michel, E., Duplessy, J. C., McManus, J. F., Lambeck, K., Bal-bon, E., and Labracherie, M.: Sea-level and deep water temperatures derived from benthic foraminifera isotopic records, Quaternary Sci. Rev., 21, 295–306, 2002.
5
Wehmiller, J. F., Simmons, K. R., Cheng, H., Edwards, R. L., Martin-McNaughton, J., York, L. L., Krantz, D. E., and Shen, C. C.: Uranium series coral ages from the US Atlantic Coastal Plain – the “80 ka problem” revisited, Quatern. Int., 120, 3–14, 2008.
Wolfe, A. P., Frechette, B., Richard, P. J .H., Miller, G. H., and Forman, S. L.: Paleoecology of a
>90,000-year lacustrine sequence from Fog Lake, Baffin Island, Arctic Canada, Quaternary
10
CPD
5, 1853–1882, 2009Sea level 400,000 years ago (MIS 11)
D. Q. Bowen
Title Page
Abstract Introduction
Conclusions References
Tables Figures
◭ ◮
◭ ◮
Back Close
Full Screen / Esc
Printer-friendly Version
Interactive Discussion
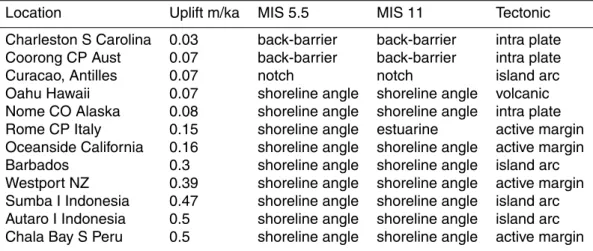
Table 1.Locations arranged in order of increasing uplift rates (example for an MIS 5.5 sea-level at 2 m), evidence for MIS 5.5 and MIS 11 shorelines and tectonic style of locations.
Location Uplift m/ka MIS 5.5 MIS 11 Tectonic
CPD
5, 1853–1882, 2009Sea level 400,000 years ago (MIS 11)
D. Q. Bowen
Title Page
Abstract Introduction
Conclusions References
Tables Figures
◭ ◮
◭ ◮
Back Close
Full Screen / Esc
Printer-friendly Version
Interactive Discussion
Table 2. Sea-levels calculated from different MIS 5.5 ages and sea-level at those times for uplift correction (see Appendix for detail). Sea-level calculations are based on the removal of outliers (bold) identified at or beyond two standard deviations. Calculated MIS 11 sea-levels are rounded up.
Age (ka) 116 ka 124 ka 132 ka S
MIS 5.5. SL 2 4 6 2 4 6 2 4 6
Charleston –5 3 7 –5 3 7 –5 3 10 2±6
Coorong CP –2 6 14 –2 6 14 2 6 14 4±6
Curacao 5 13 –21 9 13 21 9 17 21 4±6
Oahu, Hawaii –3 5 13 1 5 13 9 9 13 –2±16
Nome CP Alaska –14 5 3 –9 5 13 3 –1 3 3±6 Rome CP Italy –2 6 14 2 10 22 6 14 17 6±6
Oceanside –1 3 11 3 7 15 7 11 19 5±5
Barbados –10 –2 6 –2 6 10 6 10 19 3±7
Westport NZ –8 –4 4 0 8 16 12 16 24 2±7
Sumba I –13 –5 –1 –1 7 11 11 19 15 1±9
Autaro I –3 –5 3 –1 7 15 15 19 27 4±11
Chala Bay –31 –3 –15 –3 –11 –3 –3 –3 9 –4±7
S –6 1 3 1 4 7 3 6 7
CPD
5, 1853–1882, 2009Sea level 400,000 years ago (MIS 11)
D. Q. Bowen
Title Page Abstract Introduction Conclusions References Tables Figures ◭ ◮ ◭ ◮ Back Close
Full Screen / Esc
Printer-friendly Version
Interactive Discussion
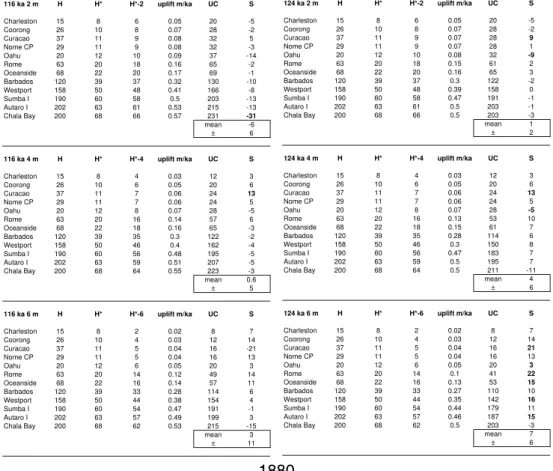
Table A1. Calculations for estimates for the MIS 11.3 sea-level from MIS 5.5 average uplift rates under different assumptions. S (1) is the sealevel for MIS 11.3 from all locations. H: elevation of MIS 11.3 high sealevel; H*: elevation of the MIS 5.5 sea-level on which uplift rate will be based; H*-2 elevation of the MIS 5.5 sea-level minus the estimated elevation of the MIS 5.5 sea-level at that time; uplift rate m/ka; UC: uplift correction elevation; S MIS 11.3 sea-level (UC H).
116 ka 2 m H H* H*-2 uplift m/ka UC S
Charleston 15 8 6 0.05 20 -5
Coorong 26 10 8 0.07 28 -2
Curacao 37 11 9 0.08 32 5
Nome CP 29 11 9 0.08 32 -3
Oahu 20 12 10 0.09 37 -14
Rome 63 20 18 0.16 65 -2
Oceanside 68 22 20 0.17 69 -1
Barbados 120 39 37 0.32 130 -10
Westport 158 50 48 0.41 166 -8
Sumba I 190 60 58 0.5 203 -13
Autaro I 202 63 61 0.53 215 -13
Chala Bay 200 68 66 0.57 231 -31
mean -6
± 6
116 ka 4 m H H* H*-4 uplift m/ka UC S
Charleston 15 8 4 0.03 12 3
Coorong 26 10 6 0.05 20 6
Curacao 37 11 7 0.06 24 13
Nome CP 29 11 7 0.06 24 5
Oahu 20 12 8 0.07 28 -5
Rome 63 20 16 0.14 57 6
Oceanside 68 22 18 0.16 65 -3
Barbados 120 39 35 0.3 122 -2
Westport 158 50 46 0.4 162 -4
Sumba I 190 60 56 0.48 195 -5
Autaro I 202 63 59 0.51 207 -5
Chala Bay 200 68 64 0.55 223 -3
mean 0.6
± 5
116 ka 6 m H H* H*-6 uplift m/ka UC S
Charleston 15 8 2 0.02 8 7
Coorong 26 10 4 0.03 12 14
Curacao 37 11 5 0.04 16 -21
Nome CP 29 11 5 0.04 16 13
Oahu 20 12 6 0.05 20 3
Rome 63 20 14 0.12 49 14
Oceanside 68 22 16 0.14 57 11
Barbados 120 39 33 0.28 114 6
Westport 158 50 44 0.38 154 4
Sumba I 190 60 54 0.47 191 -1
Autaro I 202 63 57 0.49 199 3
Chala Bay 200 68 62 0.53 215 -15
mean 3
± 11
124 ka 2 m H H* H*-2 uplift m/ka UC S
Charleston 15 8 6 0.05 20 -5
Coorong 26 10 8 0.07 28 -2
Curacao 37 11 9 0.07 28 9
Nome CP 29 11 9 0.07 28 1
Oahu 20 12 10 0.08 32 -9
Rome 63 20 18 0.15 61 2
Oceanside 68 22 20 0.16 65 3
Barbados 120 39 37 0.3 122 -2
Westport 158 50 48 0.39 158 0
Sumba I 190 60 58 0.47 191 -1
Autaro I 202 63 61 0.5 203 -1
Chala Bay 200 68 66 0.5 203 -3
mean 1
± 2
124 ka 4 m H H* H*-4 uplift m/ka UC S
Charleston 15 8 4 0.03 12 3
Coorong 26 10 6 0.05 20 6
Curacao 37 11 7 0.06 24 13
Nome CP 29 11 7 0.06 24 5
Oahu 20 12 8 0.07 28 -5
Rome 63 20 16 0.13 53 10
Oceanside 68 22 18 0.15 61 7
Barbados 120 39 35 0.28 114 6
Westport 158 50 46 0.3 150 8
Sumba I 190 60 56 0.47 183 7
Autaro I 202 63 59 0.5 195 7
Chala Bay 200 68 64 0.5 211 -11
mean 4
± 6
124 ka 6 m H H* H*-6 uplift m/ka UC S
Charleston 15 8 2 0.02 8 7
Coorong 26 10 4 0.03 12 14
Curacao 37 11 5 0.04 16 21
Nome CP 29 11 5 0.04 16 13
Oahu 20 12 6 0.05 20 3
Rome 63 20 14 0.1 41 22
Oceanside 68 22 16 0.13 53 15
Barbados 120 39 33 0.27 110 10
Westport 158 50 44 0.35 142 16
Sumba I 190 60 54 0.44 179 11
Autaro I 202 63 57 0.46 187 15
Chala Bay 200 68 62 0.5 203 -3
mean 7
CPD
5, 1853–1882, 2009Sea level 400,000 years ago (MIS 11)
D. Q. Bowen
Title Page
Abstract Introduction
Conclusions References
Tables Figures
◭ ◮
◭ ◮
Back Close
Full Screen / Esc
Printer-friendly Version
Interactive Discussion
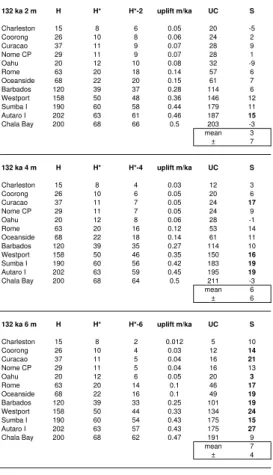
Table A1.Continued.
132 ka 2 m H H* H*-2 uplift m/ka UC S
Charleston 15 8 6 0.05 20 -5
Coorong 26 10 8 0.06 24 2
Curacao 37 11 9 0.07 28 9
Nome CP 29 11 9 0.07 28 1
Oahu 20 12 10 0.08 32 -9
Rome 63 20 18 0.14 57 6
Oceanside 68 22 20 0.15 61 7
Barbados 120 39 37 0.28 114 6
Westport 158 50 48 0.36 146 12
Sumba I 190 60 58 0.44 179 11
Autaro I 202 63 61 0.46 187 15
Chala Bay 200 68 66 0.5 203 -3
mean 3
± 7
132 ka 4 m H H* H*-4 uplift m/ka UC S
Charleston 15 8 4 0.03 12 3
Coorong 26 10 6 0.05 20 6
Curacao 37 11 7 0.05 24 17
Nome CP 29 11 7 0.05 24 9
Oahu 20 12 8 0.06 28 -1
Rome 63 20 16 0.12 53 14
Oceanside 68 22 18 0.14 61 11
Barbados 120 39 35 0.27 114 10
Westport 158 50 46 0.35 150 16
Sumba I 190 60 56 0.42 183 19
Autaro I 202 63 59 0.45 195 19
Chala Bay 200 68 64 0.5 211 -3
mean 6
± 6
132 ka 6 m H H* H*-6 uplift m/ka UC S
Charleston 15 8 2 0.012 5 10
Coorong 26 10 4 0.03 12 14
Curacao 37 11 5 0.04 16 21
Nome CP 29 11 5 0.04 16 13
Oahu 20 12 6 0.05 20 3
Rome 63 20 14 0.1 46 17
Oceanside 68 22 16 0.1 49 19
Barbados 120 39 33 0.25 101 19
Westport 158 50 44 0.33 134 24
Sumba I 190 60 54 0.43 175 15
Autaro I 202 63 57 0.43 175 27
Chala Bay 200 68 62 0.47 191 9
mean 7
CPD
5, 1853–1882, 2009Sea level 400,000 years ago (MIS 11)
D. Q. Bowen
Title Page
Abstract Introduction
Conclusions References
Tables Figures
◭ ◮
◭ ◮
Back Close
Full Screen / Esc
Printer-friendly Version
Interactive Discussion -15
-10 -5 0 5 10 15 20
SEA LEVEL (m)
1 1 6 k a 2 m sl 1 1 6 k a 4 m sl 1 1 6 k a 6 m sl 1 2 4 k a 2 m sl 1 2 4 k a 4 sl 1 2 4 k a 6 m sl 1 3 2 k a 2 m sl 1 3 2 k a 4 m sl 1 3 2 k a 6 m sl m e a n Ba rba dos Coorong CP