José Alexandre de Andrade(a) Magda Feres(b)
Luciene Cristina de Figueiredo(c) Sérgio Luiz Salvador(d)
Sheila Cavalca Cortelli(e)
(a) DDS, MS; (b)DDS, DMSc; (c)DDS, PhD –
Department of Periodontology, Dental Research Division, Guarulhos University, Guarulhos, SP, Brazil.
(d) PhD, Department of Clinical Analysis
– Microbiology, School of Pharmaceutical Sciences, University of São Paulo, Ribeirão Preto, SP, Brazil.
(e) DDS, PhD, Department of Dentistry, Taubaté
University, Taubaté, SP, Brazil.
Corresponding author: Magda Feres
Rua Nilo Peçanha, 81 - Prédio U - 6° andar Guarulhos - SP - Brazil
CEP: 07011-040 E-mail: [email protected]
Received for publication on Feb 12, 2009 Accepted for publication on May 10, 2010
The ability of the BANA Test to detect
different levels of
P. gingivalis
,
T.
denticola
and
T. forsythia
Abstract: The aim of this study was to evaluate the ability of the BANA Test to detect different levels of Porphyromonas gingivalis, Treponema denticola and Tannerella forsythia or their combinations in subgingival samples at the initial diagnosis and after periodontal therapy. Periodontal sites with probing depths between 5-7 mm and clinical attachment lev-el between 5-10 mm, from 53 subjects with chronic periodontitis, were sampled in four periods: initial diagnosis (T0), immediately (T1), 45 (T2) and 60 days (T3) after scaling and root planing. BANA Test and Check-erboard DNA-DNA hybridization identiied red complex species in the subgingival bioilm. In all experimental periods, the highest frequencies of score 2 (Checkerboard DNA-DNA hybridization) for P. gingivalis, T. denticola and T. forsythia were observed when strong enzymatic activ-ity (BANA) was present (p < 0.01). The best agreement was observed at initial diagnosis. The BANA Test sensitivity was 95.54% (T0), 65.18% (T1), 65.22% (T2) and 50.26% (T3). The speciicity values were 12.24% (T0), 57.38% (T1), 46.27% (T2) and 53.48% (T3). The BANA Test is more effective for the detection of red complex pathogens when the bac-terial levels are high, i.e. in the initial diagnosis of chronic periodontitis.
Descriptors: DNA probes; Enzyme assays; Microbiology; Diagnosis, oral; Periodontal diseases.
Introduction
Porphyromonas gingivalis, Treponema denticola and Tannerella forsythia have been implicated in periodontal disease by cultural,1
im-munological2 and DNA probe3 studies. These species are
Gram-nega-tive anaerobes which, in vivo, have an enzyme capable of hydrolyzing the synthetic trypsin substrate, N-benzoyl-DL-arginine-2-naphthylam-ide (BANA). Based on this enzymatic proile, Loesche et al.4 (1990)
de-scribed a microbiological test denominated the BANA Test, which uses a chromophore added to a synthetic peptidase as a substrate (Benzoyl-DL-Arginine-Naphthylamide). The presence of at least 104 cells of T.
denticola,P. gingivalisand/orT. forsythia results in a blue color on the card. These considerations indicate that detection of the BANA enzyme in plaque samples most likely relects the presence of these pathogens in the samples.5
In 1994, Socransky et al.6 (1994) described the Checkerboard
identiication and the quantiication of as many as 45 bacterial species in up to 28 clinical samples per test. This technique has showed better results in comparison with other microbiological tests.7-11
Socransky et al.3 (1998) described the presence of
ive, and subsequently six microbial groups12 within
subgingival bioilm. A group of species denominated the red complex consisted of three species: P. gingi-valis, T. forsythia and T. denticola. This complex is strongly related to probing depth (PD) and bleeding on probing.3,12
The BANA Test has been used in several stud-ies.13-17 The results of the BANA Test have been
previously compared with other microbiological techniques, such as ELISA (enzyme-linked immu-noabsorbent assay) reaction18 and PCR.19 However,
these studies compared only the bacterial enzymatic activity with the presence or absence of the micro-organisms. Additionally, it is not clear whether a BANA-positive reaction is associated with isolated or simultaneous presence of the red complex spe-cies. The aim of this study was to evaluate the abil-ity of the BANA Test to detect different levels of P. gingivalis, T. denticola and T. forsythia or their combinations in subgingival samples at the initial diagnosis and after periodontal therapy.
Materials and Methods
Study population and periodontal procedures
Sixty subjects with at least 30 years of age and 15 teeth, diagnosed with generalized chronic peri-odontitis were selected for the study. Measurements (mm) of PD and clinical attachment level (CAL) and the presence (1) or absence (0) of plaque, gingival in-lammation and bleeding on probing were obtained at six sites per tooth by two calibrated examiners (inter-examiner, Kappa = 92% and intra-exam-iner, Kappa = 91%-93%) using a manual periodon-tal probe (Hu-friedy Mfg Co. Inc. Chicago, IL, USA). All subjects included in this study presented at least 6 interproximal, non contiguous sites, dis-tributed in different quadrants, with 5-7 mm of PD and 5-10 mm of CAL. Exclusion criteria were: to-bacco; pregnancy; lactation; orthodontic devices;
months; any systemic condition that could affect the progression of periodontal disease; need for antibi-otic coverage for routine dental therapy. All subjects signed an Informed Consent, which was previously approved by the Institutional Committee for Re-search Involving Human Subjects.
Periodontal therapy was conducted by two trained periodontists. Scaling and root planing (SRP) were performed in six visits of 1 hour each, in a period of 21 days using manual instruments (Hu-friedy Mfg Co. Inc. Chicago, IL, USA). All partici-pants were given toothbrushes, dental loss and den-tifrice with triclosan (Colgate Total, Anakol Ind. Com. Ltda. – Kolynos do Brasil – Colgate Palmolive Co., São Bernardo do Campo, SP, Brazil).
Microbiological examination
Sample collection
After the removal of supragingival plaque, sub-gingival plaque samples were collected from the bot-tom of six interproximal periodontal pockets. These previously selected sites were non contiguous and presented PD of 5-7 mm and CAL of 5-10 mm. Ster-ilized mini-ive (#11/12) Gracey curettes (Hu-friedy Mfg Co. Inc. Chicago, IL, USA) were inserted in the base of the pocket, and the subgingival plaque was collected. The sample was divided in two portions, one designated for the BANA Test and the other one for the Checkerboard DNA-DNA hybridization. The microbiological analysis was done in four ex-perimental periods: initial diagnosis (T0), after SRP (T1 – immediately after the 6th visit of SRP), 45 days
(T2) and 60 days after the 6th visit of SRP (T3).
BANA
The BANA Test (Knöwell Therapeutic Technolo-gies Inc., Toronto, Ontario, Canada) was done as described by Loesche et al.4 (1990). Results were
registered as score 0 - negative result (no blue color); score 1 - weak-positive result (faint blue color) and score 2 - strong-positive result (deinite blue color). The weak enzymatic reaction (score 1) correspond-ed to about 104-105 colony forming units and the
Checkerboard DNA-DNA hybridization Counts of three bacterial species were determined in each sample, using the Checkerboard DNA-DNA hybridization technique6 as previously described by
Matarazzo et al. (2008).8 The assay adjusted the
sen-sitivity of the assay to permit detection of 104 cells
of a given species by adjusting the concentration of each DNA probe. Signals were converted to absolute counts by comparison with the standard lanes on the membrane. Score 0 was registered when there was no signal detection; score 1 when the signal was less intense than the control at 105 cells; score 2 similar
to 105 cells; score 3, between 105 and 106 cells; score
4 similar to 106 cells and score 5, over 106 cells.
Statistical analysis
The Checkerboard DNA-DNA hybridization scores were submitted to a new codiication to allow a better comparison with the BANA Test results. The score 0 was maintained as a negative result (≤ 104
bacteria), scores 1 and 2 were reclassiied as score 1 (104 – 105 bacteria) and scores 3, 4 and 5 were
re-classiied as score 2 (> 105 bacteria). The second new
codiication was applied to both diagnostic tests to estimate sensitivity and speciicity values. The score 0 represented negative results and the score 1 posi-tive results, including scores 1, 2, 3, 4 and 5 of the Checkerboard DNA-DNA hybridization and scores 1 and 2 of the BANA Test. The frequencies of BANA Test results according to the different bacteria levels determined by Checkerboard DNA-DNA hybridiza-tion were analyzed by Chi-Square test. The sensitiv-ity and speciicsensitiv-ity values of the BANA Test related to Checkerboard DNA-DNA hybridization were de-termined by Chi-Square test. The signiicance level was established at 5% (p < 0.05) and the data were analyzed using software Bioestat 5.0 (Pará Univer-sity, Belém, Pará, Brazil) and SPSS 11.5 (IBM Com-pany, Chicago, Illinois, USA).
Results
Out of the sixty subjects included in the study, seven did not complete the experimental phase. Fifty-three subjects (34 females and 19 males; 30 to 61 years of age) participated in this study. The full-mouth mean clinical parameters are summarized in
Table 1.
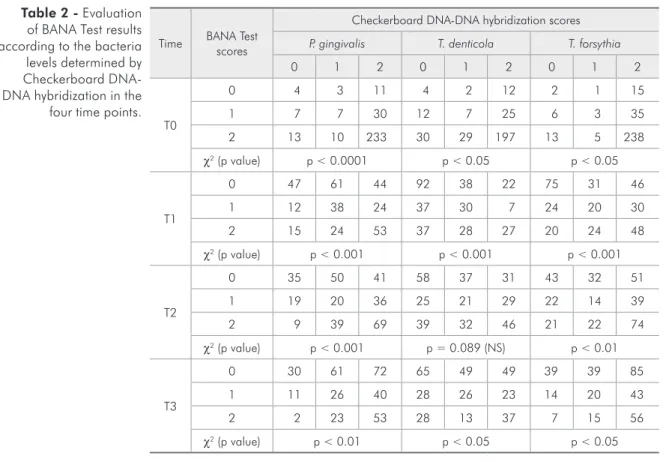
The possible combinations between each indi-vidual bacterial species related to each pattern of enzymatic activity of the BANA Test are presented in Table 2. In all experimental periods, the highest frequencies of score 2 (Checkerboard DNA-DNA hybridization) for P. gingivalis, T. denticola and T. forsythia were observed when strong enzymatic ac-tivity was present (Chi-Square test, p < 0.05). The best agreement was at time T0 [P. gingivalis (fre-quency = 233), T. denticola (frequency = 197) and T. forsythia (frequency = 238)]. On the other hand, the absence of enzymatic activity was not followed by absence of the DNA bacterial detection at all time points. In T1, T2 and T3 the score 0 of T. den-ticola was the most frequent result associated with the score 0 of the BANA Test. In experimental peri-ods T2 and T3, detection of BANA Test score 0 was associated with high frequencies of Checkerboard DNA-DNA hybridization score 2, for T. forsythia and P. gingivalis.
The BANA results were compared with the pres-ence of each of the red complex species detected by Checkerboard DNA-DNA hybridization (Table 3). The distribution of the scores showed an association for P. gingivalis in all experimental periods, for T. denticola in T1 and T2; and for T. forsythia in T1, T2 and T3. A signiicant association between the BANA Test and Checkerboard DNA-DNA hybrid-ization was observed for red complex detection in the initial diagnosis (T0). The sensitivity values ranged between 94.61% - 95.24% for the species separately and was 95.54% considering the red complex. At 60 days after SRP (T3) there was a decrease in
sensi-Table 1 - Mean full-mouth clinical parameters of the 53 subjects at initial diagnosis (T0) of chronic periodontitis.
Clinical parameter Mean ± Standard deviation
Probing depth (mm) 3.66 ± 1.77
Clinical attachment level (mm) 4.15 ± 2.17
% of sites with
Plaque 82.30 ± 12.40
Gingival inflammation 35.20 ± 19.40
Time BANA Test scores
Checkerboard DNA-DNA hybridization scores
P. gingivalis T. denticola T. forsythia
0 1 2 0 1 2 0 1 2
T0
0 4 3 11 4 2 12 2 1 15
1 7 7 30 12 7 25 6 3 35
2 13 10 233 30 29 197 13 5 238
χ2 (p value) p < 0.0001 p < 0.05 p < 0.05
T1
0 47 61 44 92 38 22 75 31 46
1 12 38 24 37 30 7 24 20 30
2 15 24 53 37 28 27 20 24 48
χ2 (p value) p < 0.001 p < 0.001 p < 0.001
T2
0 35 50 41 58 37 31 43 32 51
1 19 20 36 25 21 29 22 14 39
2 9 39 69 39 32 46 21 22 74
χ2 (p value) p < 0.001 p = 0.089 (NS) p < 0.01
T3
0 30 61 72 65 49 49 39 39 85
1 11 26 40 28 26 23 14 20 43
2 2 23 53 28 13 37 7 15 56
χ2 (p value) p < 0.01 p < 0.05 p < 0.05
T0: initial diagnosis; T1: immediately after scaling and root planing; T2: 45 days and T3: 60 days after scaling and root planing. NS= not significant (p > 0.05); χ2 = Chi-Square test. Scores: 0 = < 104 cells, 1 = 104
- 105 cells, 2 = ≥ 106 cells. Table 2 - Evaluation
of BANA Test results according to the bacteria levels determined by Checkerboard DNA-DNA hybridization in the
four time points.
Table 3 - Sensitivity and specificity of BANA Test in the 4 experimental periods. [continued on next page] Checkerboard DNA-DNA hybridization scores
Time BANA Test scores
P. gingivalis (P.g.) T. denticola (T.d.) T. forsythia (T.f.) Red complex (P.g. and T.d. and T.f.)
P.g. and/or T.d. and/or T.f.
0 1 0 1 0 1 0 1 0 1
T0 0 4 14 4 14 2 16 6 12 2 16
1 20 280 42 258 19 281 43 257 14 286
χ2 (p value) 5.89 (0.015) NS NS 4.70 (0.03) NS
Sensitivity 95.24% 94.85% 94.61% 95.54% 94.71%
Specificity 16.67% 8.7% 9.52% 12.24% 12.50%
T1 0 47 105 92 60 75 77 105 47 37 115
1 27 139 74 92 44 122 78 88 20 146
χ2 (p value) 9.55 (0.002) 8.09 (0.004) 17.67 (0.000) 15.85 (0.0001) 8.15 (0.004)
Sensitivity 56.97% 60.53% 61.31% 65.18% 55.94%
Specificity 63.51% 55.42% 63.03% 57.38% 64.91%
T0: initial diagnosis; T1: immediately after scaling and root planing; T2: 45 days and T3: 60 days after scaling and root planing. Scores: 0 = ≤ 104 cells
tivity for the species separately (50.25% - 51.94%), and was 50.26% for the red complex. Considering that the BANA Test will be positive if any of the three red complex species are present in according with the levels of detection, the last column to the right of Table 3 shows the relationship between a positive Checkerboard DNA-DNA hybridization result for at least one species and the BANA Test results. The highest and the lowest sensitivity levels were observed at initial diagnosis (T0) and 60 days after SRP (T3), respectively.
Discussion
In the present study, there was a good correla-tion between the BANA scores 0, 1 and 2 and the DNA scores 0, 1 and 2 for each of the three bacte-rial species evaluated at the initial time point (T0, Table 2). This was especially true when the results were condensed to presence or absence of enzyme activity and the presence or absence of the DNA from red complex species (Table 3). In this case, at initial diagnosis (T0) the values for sensitivity were high (between 94.61% and 95.24%). Eighty six per-cent (257/300) of BANA positive samples contained all three red complex species and 95.3% (286/300) contained one or more of the three species. In
agree-ment with our data, others have also found a good correlation between DNA probes and the BANA Test in untreated subjects, i.e comparable with time T0. Loesche et al.5 (1992) compared the BANA Test
to commercially available whole chromosomal DNA probes to P. gingivalis and T. denticola (no probe to T. forsythia was available), and immunological re-agents in their ability to detect the red complex spe-cies in patients scheduled for periodontal treatment. When the DNA probes were used as the primary ref-erence the BANA Test had a sensitivity of 90% and an accuracy of 83%. Takaishi et al.19 (2003) found
a signiicant correlation between BANA activity and the presence of the red complex species using a PCR method and commercially obtained probes.
No one has reported on comparisons between the DNA probes and the BANA Test in plaque sam-ples taken after treatment as was done in the present study. At the time periods post-therapy (T1, T2 and T3) the correlations between BANA activity and the DNA detection were also signiicant for most analy-ses (Table 3). However, it should be noted that the good sensitivity values observed at T0 were reduced over the course of the study, showing values lower than 70%. This was primarily due to the DNA de-tection of the red complex species in BANA
nega-Table 3 [continued] - Sensitivity and specificity of BANA Test in the 4 experimental periods.
Time
Checkerboard DNA-DNA hybridization scores
BANA Test scores
P. gingivalis (P.g.) T. denticola (T.d.) T. forsythia (T.f.) Red complex (P.g. and T.d. and T.f.)
P.g. and/or T.d. and/or T.f.
0 1 0 1 0 1 0 1 0 1
T2 0 35 91 58 68 43 83 62 64 27 99
1 28 164 64 128 43 149 72 120 17 175
χ2 (p value) 8.34 (0.004) 5.19 (0.023) 5.31 (0.021) 4.27 (0.039) 10.09 (0.001)
Sensitivity 64.31% 65.31% 64.22% 65.22% 63.87%
Specificity 55.56% 47.54% 50.0% 46.27% 61.36%
T3 0 30 133 65 98 39 124 69 94 25 138
1 13 142 56 99 21 134 60 95 6 149
χ2 (p value) 6.82 (0.009) NS 5.59 (0.018) NS 11.87 (0.001)
Sensitivity 51.64% 50.25% 51.94% 50.26% 51.91%
Specificity 69.77% 53.72% 65.0% 53.48% 80.64%
T0: initial diagnosis; T1: immediately after scaling and root planing; T2: 45 days and T3: 60 days after scaling and root planing. Scores: 0 = ≤ 104 cells
negative sites contained the red complex species and 88.8% (16/18) contained one or more of the three species. This might relect that the DNA probes are more sensitive than the BANA Test in detecting low levels of these pathogens. Alternatively, it could also mean that the probes were cross-reacting with one or more of the over 500 species that are known to inhabit the oral lora.20 However, this last possibility
is unlikely since it has been reported by Socransky et al.21 (2004) that whole genomic DNA probes for
T. forsythia, P. gingivalis and T. denticola showed essentially no cross-reactions to 80 oral bacterial species at the level > 10% of the homologous probe signal.
The speciicity values were low in all experimen-tal periods (Table 3). About 13% of the samples at T0 had a BANA positive score of 1 or 2 in the ab-sence of detectable red complex species. This num-ber increased to 24% at T1, and 23% at T2 but declined to 18% at T3. Thus it would appear that about 13 to 24% of the BANA activity in plaque samples may be due to unidentiied BANA positive species. The BANA activity in subgingival plaque samples has been associated with the red complex species, because in the development of the BANA
were the only species out of over 50 oral microor-ganisms tested that were always BANA positive.4
Nevertheless, it is likely that other BANA positive species exist in the oral cavity. A recent analysis of oral microbial ribosomal sequences has found new bacterial species possibly associated with chronic periodontitis22 whose enzymatic proile has not yet
been determined.
It should also be noted that the speciicity of the BANA Test increased after SRP, especially at T3 (80.64%), when the number of healthy sites also in-creased. These indings suggest that the inclusion of only diseased periodontal sites (PD 5-7 mm) in this study might have inluenced the results for speciic-ity. Therefore, studies using the same methodology as the present one and including healthy periodontal sites could help to clarify this issue.
Conclusion
The BANA Test was shown to be an effec-tive technique for the detection of the red complex pathogens in the initial diagnosis of chronic peri-odontitis; however, its application for post-therapy monitoring has limitations.
References
1. Dzink JL, Socransky SS, Haffajee AD. The predominant cul-tivable microbiota of active and inactive lesions of destructive periodontal diseases. J Clin Periodontol. 1988 May;15(5):316-23.
2. Grossi SG, Genco RJ, Machtei EE, Ho AW, Koch G, Dun-ford R, et al. Assessment of risk for periodontal disease. II. Risk indicators for alveolar bone loss. J Periodontol. 1995 Jan;66(1):23-9.
3. Socransky SS, Haffajee AD, Cugini MA, Smith C, Kent Jr RL. Microbial complexes in subgingival plaque. J Clin Periodontol. 1998 Feb;25(2):134-44.
4. Loesche WJ, Bretz WA, Kerschensteiner D, Stoll J, Socran-sky SS, Hujoel P, et al. Development of a diagnostic test for anaerobic periodontal infection based on plaque hydrolysis of Benzoyl-DL-Arginine-Naphthlamide. J Clin Microbiol. 1990 Jul;28(7):1551-9.
5. Loesche WJ, Lopatin DE, Giordano J, Alcoforado G, Hujoel P. Comparison of the benzoyl-DL-arginine-naphthylamide (BANA) test, DNA probes, and immunological reagents for
ability to detect anaerobic periodontal infections due to
Por-phyromonas gingivalis, Treponema denticola, and
Bacteroi-des forsythus. J Clin Microbiol. 1992 Feb;30 (2):427-33.
6. Socransky SS, Smith C, Martin L, Paster BJ, Dewhirst FE, Levin AE. “Checkerboard” DNA-DNA Hybridization. Bio-techniques 1994 Oct;17(4):788-92.
7. Colombo AP, Teles RP, Torres MC, Souto R, Rosalem J, Mendes MC, et al. Subgingival microbiota of Brazilian sub-jects with untreated chronic periodontitis. J Periodontol. 2002 Apr;73(4):360-9.
8. Matarazzo F, Figueiredo LC, Cruz SE, Faveri M, Feres M. Clinical and microbiological benefits of systemic metronida-zole and amoxicillin in the treatment of smokers with chronic periodontitis: a randomized placebo-controlled study. J Clin Periodontol. 2008 Oct;35(10):885-96.
sub-gingival microbiota. J Clin Periodontol. 2000 Sep;27(9):637-47.
10. Leonahrdt A, Bergstrom C, Lekholm U. Microbiologic diag-nostics at titanium implants. Clin Implant Dent Relat Res. 2003 Dec;5(4):226-32.
11. Papapanou PN, Mandianos PN, Dahlén G, Sandros J. “Check-erboard” versus culture: a comparison between two methods for identification of subgingival microbiota. Eur J Oral Sci. 1997 Oct;105(5 Pt 1):389-96.
12. Socransky SS, Haffajee AD. Dental biofilms: difficult thera-peutic targets. Periodontol 2000. 2002 Jan;28:12-55. 13. Figueiredo LC, Toledo BE, Salvador SL. The relationship
between place BANA reactivity and clinical parameters in subjects with mental disabilities. Spec Care Dentist. 2000 Oct;20(5):195-8.
14. Lee Y, Straffon LH, Welch KB, Loesche WJ. The transmission of anaerobic periodontopathic organisms. J Dent Res. 2006
Feb;85(2):182-6.
15. Grisi DC, Salvador SL, Figueiredo LC, Souza SL, Novaes AB, Grisi MF. Effect of a controlled-release chlorhexidine chip on clinical and microbiological parameters of periodontal syndrome. J Clin Periodontol. 2002 Oct;29(10):875-81. 16. Vergani SA, Barbosa e Silva E, Vinholis AH, Marcantonio
RAC. Systemic use of metronidazole in the treatment of
chronic periodontitis: A pilot study using clinical, microbio-logical, and enzymatic evaluation. Braz Oral Res. 2004 Apr-Jun;18(2):121-7.
17. Peruzzo DC, Salvador SL, Sallum AW, Nogueira-Filho GR. Flavoring agents present in a dentifrice can modify volatile sulphur compounds (VSCs) formation in morning bad breath. Braz Oral Res. 2008 Jul-Sep;22(3):252-7.
18. Bretz WA, Eklund SA, Radicchi R, Schork MA, Schork N, Schottenfeld D, et al. The use of a rapid enzymatic assay in the field for the detection of infections associated with adult peri-odontitis. J Public Health Dent.1993 Dec;53(4):235-40. 19. Takaishi Y, Morri H, Miki T. The benzoyl-DL
arginina-naphthylamide (BANA) test and polymerase chain reaction measurement of pathogenic bacteria can assess the severity of periodontal disease. Int J Tissue React. 2003;25(1):19-24. 20. Paster BJ, Boches SK, Galvin JL, Ericson RE, Lau CN,
Leva-nos VA, et al. Bacterial diversity in human subgingival plaque. JBacteriol. 2001 Jun;183(12):3770-83.
21. Socransky SS, Haffajee AD, Smith C, Martin L, Haffajee JA, Uzel NG, et al. Use of checkerboard DNA-DNA hybridiza-tion to study complex microbial ecosystems. Oral Microbiol Immunol. 2004 Dec;19(6):352-62.