*Correspondence: R. B. Bazotte. Universidade Estadual de Maringá, Depar-tamento de Farmacia e Farmacologia. Avenida Colombo, 5790 -, 87020-900 - Maringá - PR, Brasil. E-mail: rbbazotte@uem.br
A
rti
Pharmaceutical Sciences vol. 47, n. 3, jul./sep., 2011
Comparative performance of lab tests and blood testing device
to monitor glucose, total cholesterol and triacylglycerol in type 2
diabetic patients
Arnaldo Zubioli
1, Marcia Regina Batista
2, Talitha Fernandes Stefanello
2, Marcia Aparecida
Carrara
1,
Roberto Barbosa Bazotte
1,*1Department of Pharmacy and Pharmacology, State University of Maringá, 2Department of Clinical Analysis,
State University of Maringá
The performance of lab tests (LT) and blood testing devices (BTD) to monitor glycemia vs. glycated hemoglobin A1c (A1c) were compared. In addition, the performance of blood glucose, total cholesterol (TC) and triacylglycerol measured by LT and BDT were compared. All parameters were measured based on the same blood samples from overnight fasted type 2 diabetic patients (T2DP). Linear regression analysis was used for all comparisons. The results showed that A1c correlated better with LT-glucose (r = 0.58) than BTD-glucose (r = 0.42). Moreover, LT vs. BTD showed r values of 0.90, 0.82 and 0.92 for glucose, TC and triacylglycerol, respectively. It was concluded that the performance of LT-glucose was better than BDT-glucose. Moreover, since triacylycerol and TC measured by BTD correlated better with LT compared to BDT-glucose vs. LT-glucose, the inclusion of BTD-TC and BTD-triacylglycerol for detecting and monitoring hyperlipidemia in T2DP should be considered.
Uniterms: Laboratory tests. Glycated hemoglobin. Glycemia. Total cholesterol. Triacylglycerol. Type 2 diabetes.
Comparou-se a performance de avaliação da glicemia através de dosagens laboratoriais (DL) ou dispositivo para teste de sangue capilar (DTSC) vs. hemoglobina glicada A1c (A1c). Comparou-se ainda a performance de avaliação da glicemia, colesterol total (CT) e triacilglicerol (DL vs. DTSC). Avaliou-se estes parametros a partir das mesmas amostras de sangue coletadas em pacientes diabéticos tipo 2 (PDT2) em jejum noturno, sendo as comparações realizadas através de análise de regressão linear. A A1c correlacionou-se melhor com a glicemia-DL (r = 0,58) em relação a glicemia-DTSC (r = 0,42). Comparou-se DL vs. DTSC obtendo se r = 0,90, 0,82 e 0,92 para glicemia, CT e triacilglicerol, respectivamente. Concluiu-se que houve melhor performance da glicose-DL em relação a glicose-DTSC. Além disso, considerando que o triacilglicerol e TC avaliado através de DTSC correlaciona-se melhor com DL em comparação a DTSC-glicose vs.DL-glicose, a inclusão de DTSC-TC e DTSC-triacilglicerol visando detectar e monitorar hyperlipidemia in PDT2 deve ser considerada.
Unitermos: Exames laboratoriais. Hemoglobina glicada. Glicemia. Colesterol total. Triacilglicerol. Diabetes tipo 2.
INTRODUCTION
Glycemic control is fundamental in the management of type 2 diabetes. The United Kingdom Prospective Dia-betes Study (UKPDS), a prospective, randomized, control-led trial of intensive versus standard glycemic control in
type 2 diabetic patients, showed deinitively that improved glycemic control is associated with signiicantly decreased rates of diabetic complications (UK Prospective diabetes study group (1998).
al., 2000). This study also suggested that further lowering of glycated hemoglobin A1c from 7 to 6% was associated with signiicant reduction of diabetic complications. In agreement, the American Diabetes Association sugges-ted glycasugges-ted hemoglobin A1c of less than7% to prevent chronic complications (American Diabetes Association, 2010).
However, in spite the fact that glycated hemoglo-bin A1c is considered the cornerstone of clinical mana-gement of diabetes, (American Diabetes Association, 2010)fasting glycemia is the most widely used lab test to evaluate the glycemic status of people with diabetes (Al-Lawati, Al-Lawati, 2007; Correr et al., 2009; Silva
et al., 2004).
Furthermore, in recent years a clear tendency for evaluating blood glucose, total cholesterol and triacyl-glycerol with blood testing devices has emerged (Laguna
et al., 2009; Nathan et al., 2008; Cassani et al., 2009; Pon-gwecharak, Treeranurat, 2010). However, the performance of these methods in comparison with classical lab tests is not yet well established.
In the present investigation, the performance of blood glucose measurements from lab tests and blood testing devices for glycated hemoglobin A1c levels was compared. Moreover, the performance of lab tests and blood testing devices was also compared for glucose, total cholesterol and triacylglycerol measurements.
PATIENTS AND METHODS
Written consent to participate in this investigation was obtained from each patient and the study was appro-ved by the Ethics Committee of the State University of Maringá (COPEP - CAAE 0133-06).
Exclusion criteria were pregnancy, gestational dia-betes, type 1 diabetes and other speciic types of diabetes. Eligibility criteria were: age over 30 years, confirmed diagnosis of type 2 diabetes and use of at least one pres-cribed anti-diabetic drug.
The patients, recruited from a pharmacy school, were interviewed and information on medical history, socio-demographic characteristics, pharmacotherapeutic proile and lifestyle were collected. After the interview, blood pressure (BP) and body mass index (BMI) were evaluated. BP (mmHg) was measured as described else-where (Ferri et al., 2006).
Immediately after the interview the patients received instructions for blood collection at a laboratory accredited by the Brazilian Society of Clinical Analysis.
Venous blood was collected from overnight fasted patients for analysis of glucose, total cholesterol and
triacylglycerol by a blood testing device (BTD) and lab tests (LT). In addition, glycated hemoglobin A1c was measured. All analyses were done from the same blood sample.
Immediately after blood collection, part of the fresh blood was immediately used to measure glycated hemo-globin A1c (Metus et al., 1999), glucose, total cholesterol and triacylglycerol by BTD (Accutrend GCT® - Roche
Company). The normal values of glycated hemoglobin A1c, glucose, total cholesterol and triacylglycerol were < 7%, 70-130 mg/dL, < 200 mg/dL and < 200 mg/dL, respectively.
Moreover, part of the blood was transferred to a tube containing sodium luoride/EDTA, which was imme-diately centrifuged and the plasma separated to measure glucose (Bergmeyer, Bernt, 1974), total cholesterol (Allain
et al., 1974) and triacylglycerol (Bucolo, David, 1973) by LT. The normal values of blood glucose, total cholesterol and triacylglycerol were < 100 mg/dL, < 200 mg/dL, and < 150 mg/dL, respectively. These values were based in the position statement of the Clinical Practice Recommenda-tion of the American Diabetes AssociaRecommenda-tion (2010).
Linear regression analysis using GraphPad Prism (version 5) was done to investigate the relationship be-tween glycated hemoglobin A1c vs. glucose (LT), A1c vs. glucose (BTD), glucose (LT vs. BTD), total cholesterol (LT vs. BTD) and triacylglycerol (LT vs. BTD).
Some results were expressed as percentage (%) and others as mean ± standard deviation (SD).
RESULTS
A total of 32 volunteers, 16 (50%) men and 16 (50%) women, were assessed. The values for all biochemical parameters did not differ between men and women (data not shown).
Among these patients, whose mean age was 57.8 ± 7.3 years ranging from 48 to 74 years, the time of diag-nosis was 12.0 ± 9.0 years, ranging from 1 to 37 years.
Most patients had one or more comorbidities asso-ciated with diabetes, with a prevalence of hypertension (93.8%) and overweight or obesity (68.8%).
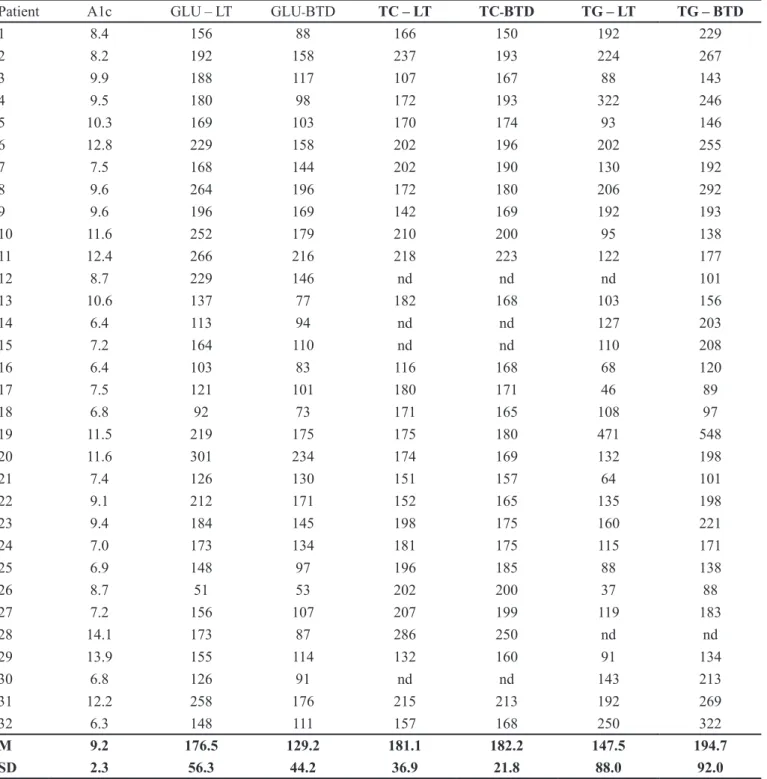
The value of glycated hemoglobin A1c, glucose (LT), glucose (BTD), total cholesterol (LT), total choleste-rol (BTD), triacylglycecholeste-rol (LT) and triacylglycecholeste-rol (BTD) were 9.2 ± 2.3%, 176.5 ± 56.3 mg/dL, 129.2 ± 44.2 mg/dL, 181.1 ± 36.9 mg/dL, 182.2 ± 21.8 mg/dL, 147.5 ± 88.0 mg/dL and 194.7 ± 90.0 mg/dL, respectively.
triacyl-glycerol (LT) and triacyltriacyl-glycerol (BTD) were 25 (78.1%), 24 (75.0%), 14 (43.8%), 9 (32%), 4 (14.3%), 10 (33.3%) and 13 (41.9%), respectively (Table I).
As can be seen in Figure 1A and 1B, glycated hemoglobin A1c correlated better with glucose
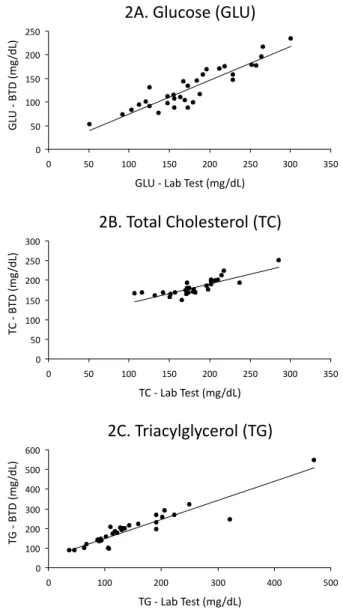
measu-red by LT (r = 0.58) than BTD (r = 0.42). On the other hand, the comparison of LT and BTD show r values of 0.90, 0.82, 0.92 and glucose (Figure 2A), total cho-lesterol (Figure 2B) and triacylglycerol (Figure 2C), respectively.
TABLE I - Individual and mean (M) ± standard deviation (SD) of glycated hemoglobin A1c (A1c), blood, glucose (GLU), total cholesterol (TC) and triacylglycerol (TG). GLU, TC and TG were measured by Lab test (LT) and blood testing device (BTD). A1c was expressed as % and all other parameters were expressed as mg/dL. Blood was collected from overnight fasted type 2 diabetic patients. nd: not determined
Patient A1c GLU – LT GLU-BTD TC – LT TC-BTD TG – LT TG – BTD
1 8.4 156 88 166 150 192 229
2 8.2 192 158 237 193 224 267
3 9.9 188 117 107 167 88 143
4 9.5 180 98 172 193 322 246
5 10.3 169 103 170 174 93 146
6 12.8 229 158 202 196 202 255
7 7.5 168 144 202 190 130 192
8 9.6 264 196 172 180 206 292
9 9.6 196 169 142 169 192 193
10 11.6 252 179 210 200 95 138
11 12.4 266 216 218 223 122 177
12 8.7 229 146 nd nd nd 101
13 10.6 137 77 182 168 103 156
14 6.4 113 94 nd nd 127 203
15 7.2 164 110 nd nd 110 208
16 6.4 103 83 116 168 68 120
17 7.5 121 101 180 171 46 89
18 6.8 92 73 171 165 108 97
19 11.5 219 175 175 180 471 548
20 11.6 301 234 174 169 132 198
21 7.4 126 130 151 157 64 101
22 9.1 212 171 152 165 135 198
23 9.4 184 145 198 175 160 221
24 7.0 173 134 181 175 115 171
25 6.9 148 97 196 185 88 138
26 8.7 51 53 202 200 37 88
27 7.2 156 107 207 199 119 183
28 14.1 173 87 286 250 nd nd
29 13.9 155 114 132 160 91 134
30 6.8 126 91 nd nd 143 213
31 12.2 258 176 215 213 192 269
32 6.3 148 111 157 168 250 322
M 9.2 176.5 129.2 181.1 182.2 147.5 194.7
DISCUSSION
Type 2 diabetes is now a major public health pro-blem in Brazil. The estimated number of 5.2 million suffe-rers in 2000 is expected to double by the year 2030 (Wild
et al., 2004). However, glycemic control is lower than 50% (Gomes et al., 2006; Assunção, Santos, Valle, 2005), which inevitably contributes to the increasing occurrence of chronic complications in type 2 diabetic patients.
Furthermore, type 2 diabetes is normally asymp-tomatic, but if the disease is not adequately treated a range of chronic complications can result in reduced quality of life and premature death (Assunção, Santos, Valle, 2005).
Therefore, monitoring the treatment of type 2 dia-betes has important implications for individual health and public health policy and for this purpose fasting glycemia is the most commonly used exam (Silva, Bazotte, 2010; Pimentel et al., 2010). Moreover, considering the high
risk of cardiovascular disease, the control of blood lipid proile must be considered (Colagiuri, 2010).
Our results showed that the majority of the patients did not exhibit suitable control of glycemia and lipid pro-ile (Table I). These results are in line with the indings of several other studies, in which the majority of type 2 diabetic patients exhibited poor blood glucose and lipid
control (Kemp et al., 2005; Saydah, Fradkin, Cowie, 2004; McFarlane et al., 2002; Grant, Buse, Meigs, 2005; Silva, Bazotte, 2010).
Linear regression analysis to investigate the rela-tionship between glycated hemoglobin A1c vs. fasting glycemia (LT and BTD) revealed that glycated hemoglo-bin A1c correlated better with LT than with BTD (Figure 1A, B). Furthermore, in the case of patients 1,4,13,26 and 28 (Table I), fasting glycemia obtained by BTD, i.e., ≤ 100 mg/dL, could yield misleading information of good glycemic control since results contrasted with the elevated values of glycated hemoglobin A1c. For LT, this problem is limited to patient 26 (Table I). Therefore, in spite of the fact that glycemia measured by BTD has become faster and more accurate over the past 3 decades and now allows
FIGURE 1 - Relationship between glycated hemoglobin A1c (HbA1c) and fasting glycemia measured by Lab test (1A) and blood testing device (BTD) (1B). Number of patients: 32.
1A. HbA1c vs. Glycemia (Lab test)
0 2 4 6 8 10 12 14 16
0 50 100 150 200 250 300 350
Glycemia (mg/dL)
HbA1c (%)
1B. HbA1c vs. Glycemia (BTD)
0 2 4 6 8 10 12 14 16
0 50 100 150 200 250
Glycemia (mg/dL)
HbA1c (%)
FIGURE 2 - Relationship between lab test and blood testing device (BTD) for glycemia (2A), total cholesterol (2B) and triacylglycerol (2C). Number of patients: 32.
2A. Glucose (GLU)
0 50 100 150 200 250
0 50 100 150 200 250 300 350
GLU - Lab Test (mg/dL)
GL
U - B
TD (mg
/dL)
2B. Total Cholesterol (TC)
0 50 100 150 200 250 300
0 50 100 150 200 250 300 350
TC - Lab Test (mg/dL)
T
C - B
TD (mg
/dL)
2C. Triacylglycerol (TG)
0 100 200 300 400 500 600
0 100 200 300 400 500
TG - Lab Test (mg/dL)
T
G - B
TD (mg
for better glycemic control by diabetics than in the past, this test is no substitute for fasting glycemia values obtai-ned by lab tests.
There is consensus on continuous monitoring of lipid profile in type 2 diabetes. This question acquires greater relevance considering that diabetes is a signiicant cardiovascular risk and given that blood lipid targets are not attained by the majority of type 2 diabetic patients (Gomes et al., 2006; Grant, Buse, Meigs, 2005; Silva, Bazotte, 2010). In this context, our results showed that, in spite of the fact that BTD for measuring total cholesterol and triacylglycerol were introduced into clinical practice later than glycemia, they show good correlation with laboratory results. In the speciic case of triacylglycerol, the r value (r = 0.92) for comparison of BTD vs. LT was higher than that obtained for glucose (r = 0.90).
CONCLUSION
Congruent with the well-established role of BTD in the detection and self-monitoring of glycemia, the Brazi-lian Government approved RDC 44/ANVISA (Resolução da Diretoria Colegiada, 2009) in which capillary glycemia was established as a pharmaceutical service care for diabe-tes screening and glucose monitoring. However, conside-ring that glycated hemoglobin A1c correlated better with LT than BTD, device tests are no substitute for the fasting glycemia values obtained by lab tests. Finally, since BTD-TC and BTD-triacylglycerol showed good correlation with LT, the inclusion of BTD-TC and BTD-triacylglycerol in the detection and monitoring of hyperlipidemia in T2DP should be considered.
Finally, any analysis of the results must consider the limited number of patients investigated, i.e., 32 volunteers. However, this limitation was overcome, partly at least, by the fact that all biochemical parameters were evaluated based on the same blood sample. This experimental ap-proach, in which each patient served as their own control, rules out the interference of several factors such as age, duration of diabetes, gender, BMI and variability owing to blood collection on different days. However, future studies involving a higher number of patients are necessary to conirm the conclusions of this study.
ACKNOWLEDGMENTS
We are grateful to Carlos Eduardo de Oliveira and Solidalva Caruso de Oliveira for their technical assis-tance. This research received inancial support from the Brazilian government (CNPq, CAPES and Araucaria Foundation).
Conlict of Interest
The authors declare that they have no proprietary, inancial, professional, or other personal interest that may inluence the conclusions of this study.
Statement
I hereby conirm that all patients/personal identi-iers have been removed or masked to ensure the patient/ person(s) described are not identifiable and cannot be identiied through the details of the study.
REFERENCES
ALLAIN, C.C.; POON, L.S.; CHAN C.S.; RICHMOND, W.; FU, P.C. Enzymatic determination of serum cholesterol. Clin. Chem., v.20, n.4, p.470-475, 1974.
AL-LAWATI, J.A.; AL-LAWATI, A.M. The utility of fasting plasma glucose in predicting glycosylated hemoglobin in type 2 diabetes. Ann. Saudi Med., v.27, n.5, p.347-351, 2007.
AMERICAN DIABETES ASSOCIATION – CLINICAL PRACTICE RECOMMENDATIONS 2010. Diabetes Care, v.33, n.1, p.S1-S61, 2010.
ASSUNÇÃO, M.C.; SANTOS, I.S.; VALLE, N.C. Blood glucose control in diabetes patients seen in primary health care centers. Rev. Saúde Publica, v.39, n.2, p.183-190, 2005.
BERGMEYER, H.U.; BERNT, E. Determination of glucose with glucose-oxidase and peroxidase. In: BERGMEYER, H.U. (Ed.). Methods of enzymatic analysis. New York: Verlag Chemie-Academic Press, 1974. p.1205-1215.
BUCOLO, G.; DAVID, H. Quantitative determination of serum triglycerides by the use of enzymes. Clin. Chem., v.19, n.5, p.476-482, 1973.
CASSANI, R.S.; NOBRE, F.; PAZIN FILHO, A.; SCHMIDT, A. Prevalence of cardiovascular risk factors in a population of Brazilian industry workers. Arq. Bras. Cardiol., v.92, n.1, p.16-22, 2009.
CORRER, C.J.; PONTAROLO, R.; SOUZA, R.A.P.; VENSON, R.; MELCHIORS, A.C.; WIENS, A.Effect of a Pharmaceutical Care Program on quality of life and satisfaction with pharmacy services in patients with type 2 diabetes mellitus. Braz. J. Pharm. Sci., v.45, n.4, p.809-817, 2009.
FERRI, L.A.F.; ALVES-DO-PRADO, W.; YAMADA, S.S.; GAZOLA, S.; BATISTA, M.R.; BAZOTTE, R.B. Investigation of the antihypertensive effect of oral crude stevioside in patients with mild essential hypertension. Phytotherapy Res., v.20, n.9, p.732-736, 2006.
GOMES, M.B.; GIANELLA, D.; FARIA, M.; TAMBASCIA, M.; FONSECA, R.M.; RÉA, R.; MACEDO, G.; MODESTO FILHO, J.; SCHMID, H.; BITTENCOURT, A.V.; CAVALCANTI, S.; RASSI, N.; PEDROSA, H.; ATALA DIB, S. Prevalence of Type 2 diabetic patients within the targets of care guidelines in daily clinical practice: a multi-center study in Brazil. Rev. Diabet. Stud., v.3, n.2, p.82-87, 2006.
GRANT, R.W.; BUSE, J.B.; MEIGS, J.B. University Health System Consortium (UHC) Diabetes Benchmarking Project Team. Quality of diabetes care in U.S. academic medical centers: low rates of medical regimen change. Diabetes Care, v.28, n.2, p.337-442, 2005.
KEMP, T.M.; BARR, E.L.; ZIMMET, P.Z.; CAMERON, A.J.; WELBORN, T.A.; COLAGIURI, S.; PHILLIPS, P.; SHAW, J.E. Glucose, lipid, and blood pressure control in Australian adults with type 2 diabetes: the 1999-2000 AusDiab. Diabetes Care, v.28, n.6, p.1490-1492, 2005.
LAGUNA NETO, D.; ROBLES, F.C.; DIAS, F.G.; PIRES, A.C. Analysis of ingerstick capillary glycemia versus alternative site: Results and patients preferences. Arq. Bras. Endocrinol. Metabol., v.53, n.3, p.344-347, 2009.
MCFARLANE, S.I.; JACOBER, S.J.; WINER, N.; KAUR, J.; CASTRO, J.P.; WUI, M.A.; GLIWA, A.; VON GIZYCKI, H.; SOWERS, J.R. Control of cardiovascular risk factors in patients with diabetes and hypertension at urban academic medical centers. Diabetes Care, v.25, n.4, p.718-723, 2002.
M E T U S , P. ; R U Z Z A N T E , N . ; B O N V I C I N I , P. ; MENEGHETTI, M.; ZANINOTTO, M.; PLEBANI, M. Immunoturbidimetric assay of glycated hemoglobin. J. Clin. Lab. Anal., v.13, n.1, p.5-8, 1999.
NATHAN, D.M.; KUENEN, J.; BORG, R.; ZHENG, H.; SCHOENFELD, D.; HEINE, R.J. A1c-Derived Average Glucose Study Group. Translating the A1C assay into estimated average glucose values. Diabetes Care, v.31, n.8, p.1473-1478, 2008.
PIMENTEL, G.D.; PORTERO-MCLELLAN, K.C.; OLIVEIRA, E.P.; SPADA, A.P.; OSHIIWA, M.; ZEMDEGS, J.C.; BARBALHO, S.M. Long-term nutrition education reduces several risk factors for type 2 diabetes mellitus in Brazilians with impaired glucose tolerance. Nutr. Res., v.30, n.3, p.186-190, 2010.
PONGWECHARAK, J.; TREERANURAT, T. Screening for pre-hypertension and elevated cardiovascular risk factors in a Thai community pharmacy. Pharm. World Sci., 32, n.3, p.329-333, 2010.
RESOLUÇÃO da Diretoria Colegiada – RDC Nº 44. August 17, 2009. Available at: <http://www.anvisa. gov.br/divulga/noticias/2009/pdf/180809_rdc_44.pdf>. Accessed on: 15 jul. 2010.
SAYDAH, S.H.; FRADKIN, J.; COWIE, C.C. Poor control of risk factors for vascular disease among adults with previously diagnosed diabetes. JAMA. v.291, n.3, p.335-342, 2004.
SILVA, G.E.C.; BAZOTTE, R.B. Development and evaluation of a pharmaceutical care program to reduce modiiable risk of chronic complications in Brazilian type 2 diabetic patients. Lat. Am. J. Pharm., v.30, n. 1, p. 154-160, 2011.
STRATTON, I.M.; ADLER, A.I.; NEIL, H.A.; MATTHEWS, D.R.; MANLEY, S.E.; CULL, C.A.; HADDEN, D.; TURNER, R.C.; HOLMAN, R.R. Association of glycaemia with macrovascular and microvascular complications of type 2 diabetes (UKPDS 35): prospective observational study. BMJ, v.321, n.7258, p.405-412, 2000.
UK PROSPECTIVE DIABETES STUDY (UKPDS) GROUP. Intensive blood-glucose control with sulphonylureas or insulin compared with conventional treatment and risk of complications in patients with type 2 diabetes (UKPDS 33). Lancet, v.352, n.9131, p.837-853, 1998.
WILD, S.; ROGLIC, G.; GREEN, A.; SICREE, R.; KING, H. Global prevalence of diabetes: estimates for the year 2000 and projections for 2030. Diabetes Care, v.27, n.5, p.1047-1053, 2004.
Received for publication on 11th August 2010