Research Article
Iron Dextran Increases Hepatic Oxidative Stress and
Alters Expression of Genes Related to Lipid Metabolism
Contributing to Hyperlipidaemia in Murine Model
Maísa Silva,
1Joyce Ferreira da Costa Guerra,
2Ana Flávia Santos Sampaio,
3Wanderson Geraldo de Lima,
2,4Marcelo Eustáquio Silva,
2,5and Maria Lucia Pedrosa
2,41Basic Department-Health Area, Federal University of Juiz de Fora, Campus Universit´ario s/n, 36036-900 Juiz de Fora, MG, Brazil 2Research Center in Biological Sciences (NUPEB), Federal University of Ouro Preto, Campus Morro do Cruzeiro s/n,
35400-000 Ouro Preto, MG, Brazil
3Program of Health and Nutrition, Federal University of Ouro Preto, Campus Morro do Cruzeiro s/n,
35400-000 Ouro Preto, MG, Brazil
4Department of Biological Sciences, Federal University of Ouro Preto, Campus Morro do Cruzeiro s/n,
35400-000 Ouro Preto, MG, Brazil
5Department of Foods, Federal University of Ouro Preto, Campus Morro do Cruzeiro s/n, 35400-000 Ouro Preto, MG, Brazil
Correspondence should be addressed to Maria Lucia Pedrosa; [email protected]
Received 22 May 2014; Revised 17 September 2014; Accepted 25 September 2014
Academic Editor: Paul M. Tulkens
Copyright © 2015 Ma´ısa Silva et al. This is an open access article distributed under the Creative Commons Attribution License, which permits unrestricted use, distribution, and reproduction in any medium, provided the original work is properly cited.
The objective of this study was to investigate the effects of iron dextran on lipid metabolism and to determine the involvement of oxidative stress. Fischer rats were divided into two groups: the standard group (S), which was fed the AIN-93M diet, and the standard plus iron group (SI), which was fed the same diet but also received iron dextran injections. Serum cholesterol and triacylglycerol levels were higher in the SI group than in the S group. Iron dextran was associated with decreased mRNA levels ofppar𝛼, and its downstream genecpt1a, which is involved in lipid oxidation. Iron dextran also increased mRNA levels ofapoB-100,MTP, and L-FABPindicating alterations in lipid secretion. Carbonyl protein and TBARS were consistently higher in the liver of the iron-treated rats. Moreover, a significant positive correlation was found between oxidative stress products,lfabpexpression, and iron stores. In addition, a negative correlation was found betweenppar𝛼expression, TBARS, carbonyl protein, and iron stores. In conclusion, our results suggest that the increase observed in the transport of lipids in the bloodstream and the decreased fatty acid oxidation in rats, which was promoted by iron dextran, might be attributed to increased oxidative stress.
1. Introduction
Iron is a first-line prooxidant that modulates the clinical man-ifestation of various systemic diseases, including diabetes, steatosis, and subclinical inflammation, which has been rec-ognized as the dysmetabolic iron overload syndrome (DIOS)
[1]. This effect may result from the ability of free iron to
catalyze the formation of highly reactive radicals, such as the
hydroxyl radical from superoxide and hydrogen peroxide [2].
The generation of free radicals might be involved in dyslipi-demia and consequently in the pathogenesis of hepatic
steato-sis [3] and cardiovascular disease [4]. Previous data suggests
a link between lipids and iron metabolism and that this
relationship is influenced by oxidative stress [5–7]. However,
despite a considerable amount of data indicating an increase
of both O2−and iron content in tissue leads to increased OH−
formation, the mechanism of involvement and the role of iron in early stage dyslipidemia remain to be elucidated.
In the liver, a complex network of nuclear receptors coordinately regulates the expression of enzymes involved in different steps of lipid metabolism, from fatty acid (FA) oxida-tion and uptake to triacylglycerol (TAG) synthesis,
accumula-tion, and/or secretion [8]. Sterol regulatory element-binding
proteins (SREBPs) are a family of transcription factors that
regulate lipid homeostasis by controlling the expression of a range of enzymes required for endogenous cholesterol, fatty acid, TAG, and phospholipid synthesis. Cholesterol biosynthesis is partially governed at the transcriptional level by srebp-2 [9], which preferentially activates many of the
genes in the cholesterol biosynthesis pathway [10].srebp-2
can regulate cholesterol homeostasis via its ability to bind and activate the promoters of genes encoding LDL receptor (LDL-R) and HMG-CoA reductase (HMG CoA-(LDL-R).
Peroxisome proliferator-activated receptor 𝛼 (ppar𝛼) is
a transcription factor involved in liver FA degradation. It is expressed in the liver where it accelerates the transcription of proteins and enzymes for FA catabolism. It plays an important role in the metabolic homeostasis of FAs through the regula-tion of target genes encoding enzymes for FA oxidaregula-tion and transport, such as carnitine palmitoyltransferase 1 (CPT1),
which controls mitochondrial𝛽-oxidation. A growing body
of evidence supports a role forppar𝛼 in the development
of liver disease, and disabling theppar𝛼 gene is known to
increase hepatic triglyceride accumulation, especially under
fasting conditions [11,12]. In addition, an increase in oxidative
stress can also cause changes in the expression ofppar𝛼[13].
Triglyceride release as very low-density lipoprotein (VLDL) requires the coordinated functions of apolipoprotein B-100 (apoB-100) and microsomal triglyceride transfer
pro-tein (MTP) [14]. ApoB-100 is an essential protein required
for the assembly and secretion of VLDL from the liver [15].
MTP acts as both a lipid transfer protein [16] and a facilitator
of apoB folding and translocation [17, 18]. MTP facilitates
the transfer of four major lipid classes (free cholesterol, phospholipids, triglycerides, and cholesterol esters) to the
nascent apoB-containing lipoprotein particle [19]. In
addi-tion, liver fatty acid binding protein (L-FABP), which is highly abundant in the cytosol of liver parenchymal cells,
facilitates FA transport and utilization [20]. Variations in
hepatic expression levels of both L-FABP [21] and MTP [22]
control the flux of FAs into glycerolipid biosynthesis and VLDL assembly and secretion. However, the expression of these proteins can be altered with an increase in oxidative
stress, resulting in dyslipidemia [23,24].
To further investigate the hyperlipidemic effect of iron dextran and the possible underlying mechanism, we first focused on its effects on serum cholesterol and triacylglycerol levels. To identify the mechanisms of the hyperlipidemic effects at the molecular level, we determined mRNA expres-sion of genes involved in lipid oxidation and triglyceride and cholesterol release from the liver and the association with enhanced oxidative stress.
2. Materials and Methods
2.1. Animals. Eight-week-old male Fischer rats (𝑛 = 14), weighing approximately 180 g, were obtained from the School of Nutrition, Federal University of Ouro Preto, MG, Brazil. Animals were individually housed in wire-bottomed metabolic cages and kept in a room with controlled
condi-tions and food and water providedad libitum. The standard
group (S) was fed a standard diet (AIN-93M). The standard plus iron group (SI) was fed the standard diet and was given
intraperitoneal injections of 100 g/L iron dextran (Sigma, St. Louis, MO, USA). For all experiments, injections were given at a total dose of 40 mg, divided into 10 mg/d dose,
according the protocol by Miron et al. [25], S group received
saline solution. On experimental day 28, fasting rats of 12 h were anesthetized and euthanized by total brachial plexus bleeding. Blood samples were collected and centrifuged at
10,000×g for the measurement of serum components. The
liver was removed, weighed, and stored in liquid nitrogen or buffered formaldehyde for subsequent biochemical and histopathological analysis, respectively. All procedures were approved by the UFOP Ethics Committee on Animal Use (CEUA; OF 034/2008).
2.2. Assay Methods. The liver concentration of nonheme iron was analyzed after digestion in 2 mL of acid solution
(3 mol/L HCl and 10% trichloroacetic acid) for 20 h at 65∘C.
Digested samples were mixed with chromogen reagent
con-taining orthophenanthroline [26]. Serum triacylglycerol and
cholesterol levels were measured enzymatically using Labtest kits 59—4/50 and 60—2/100, respectively (Lagoa Santa, MG, Brazil). After the precipitation of low-density lipoprotein cholesterol (LDL-C) and VLDL cholesterol with
phospho-tungstic acid/MgCl2, high-density lipoprotein cholesterol
(HDL-C) level was determined from the supernatant using Labtest kit number 13. The level of other cholesterol fractions was calculated as the difference between the levels of total and HDL cholesterol. In addition, Labtest kits 53, 42, and 84 were used to measure the activities of serum alanine aminotransferase (ALT), aspartate aminotransferase (AST), and glucose concentration, respectively.
2.3. Lipid Peroxidation and Protein Oxidation Analysis. Liver samples from all rats were homogenized in 0.1 M Tris-HCl buffer (pH 7.4). Peroxy lipid content was measured according
to Buege and Aust [27] and was calculated using the molar
extinction coefficient of the complex TBA-MDA (1.56 ×
105 L/mol/cm). Values are expressed in nmol/mg of protein. Carbonyl protein was measured using a modified version of
the method by Levine et al. [28]. The carbonyl content was
calculated based on the molar extinction coefficient of DNPH (22,000 L/mol/cm) and expressed as nmol/mg of protein. The total liver protein content was determined according to
Lowry et al. [29].
2.4. Histopathological Evaluation. Liver fragments not exceeding 4 mm in diameter were fixed in 10% formaldehyde solution and then dehydrated, diaphanized, and embedded
in paraffin. Paraffin sections of approximately 4𝜇m were
obtained by sectioning embedded fragments on a rotary microtome. Sections were mounted on glass slides previously cleaned and degreased. Slides were stained with hematoxylin and eosin for the visualization of histological changes and with Perls’ technique for determination of tissue iron pools.
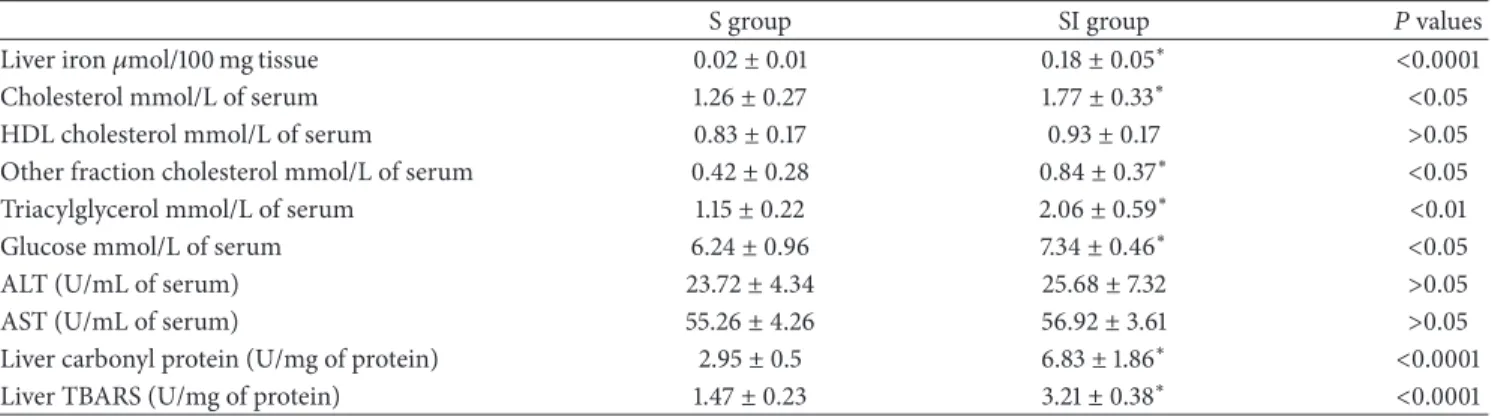
Table 1: Iron status in liver, glycemic and lipids profile, oxidant/antioxidant status in liver of rats offered a standard diet (S) and rats that received injections of iron dextran (SI).
S group SI group 𝑃values
Liver iron𝜇mol/100 mg tissue 0.02±0.01 0.18±0.05∗ <0.0001
Cholesterol mmol/L of serum 1.26±0.27 1.77±0.33∗ <0.05
HDL cholesterol mmol/L of serum 0.83±0.17 0.93±0.17 >0.05
Other fraction cholesterol mmol/L of serum 0.42±0.28 0.84±0.37∗ <0.05
Triacylglycerol mmol/L of serum 1.15±0.22 2.06±0.59∗ <0.01
Glucose mmol/L of serum 6.24±0.96 7.34±0.46∗ <0.05
ALT (U/mL of serum) 23.72±4.34 25.68±7.32 >0.05
AST (U/mL of serum) 55.26±4.26 56.92±3.61 >0.05
Liver carbonyl protein (U/mg of protein) 2.95±0.5 6.83±1.86∗ <0.0001
Liver TBARS (U/mg of protein) 1.47±0.23 3.21±0.38∗ <0.0001
HDL, high-density lipoprotein;
Values are shown as the mean±standard deviation (𝑛 = 8). Data were analyzed by𝑡-test. Statistical differences are shown by∗.
purity were determined by spectrophotometric analysis at 260 and 280 nm on a NanoVue spectrophotometer (GE Healthcare, United Kingdom). cDNA was synthesized from total RNA using GeneAmp RNA PCR (Applied Biosystems,
Foster City, USA). Briefly, cDNA was prepared in a 20𝜇L
reaction using MultiScribe (50 U/𝜇L) Reverse Transcriptase
and Oligo d(T)16 primers (Applied Biosystems, Foster City,
USA). Gene expression was analyzed using SYBR Green PCR Master Mix (Applied Biosystems). The primers used
to amplify ppar𝛼, srebp-2, HMG CoA reductase, the LDL
receptor, and the reference gene 18S have been previously
described by Li et al. [30], Xiong et al. [31], and Reena et al.
[32]. The primer sequences for apoB-100 (forward primer 5
-AGTAGTGGTGCGTCTTGGATCCA-3and reverse primer
5-ACTCTGCAGCAAGCTGTTGAATGT-3) were derived
from the Rattus norvegicus genome (National Center for
Biotechnology Information GenBank, accession number NM 019287) and were constructed using the Primer-BLAST
Program (http://www.ncbi.nlm.nih.gov/tools/primer-blast/).
The primer sequence for MTTP (forward primer 5
-CGA-CGGTGACGATGATCAACT-3 and reverse primer 5
-TGACCCGCATTTTCGACATT-3) was also derived from
theR. norvegicusgenome (National Center for Biotechnology Information GenBank, accession number NM 001107727.1).
The primer sequence for L-FABP (forward primer 5
-CATCCAGAAAGGGAAGGACA-3and reverse primer 5
-CACGGACTTTATGCCTTTGAA-3) was derived from the
R. norvegicus genome (National Center for Biotechnology Information GenBank, accession number NM 012556.2).
The primer sequence for cpt-1a (forward primer 5
-ATA-TTGGGCACAGTCCCCTG-3and reverse primer 5
-TGT-GAAGAAACAACCCCCAGA-3) was derived from the
R. norvegicus genome (National Center for Biotechnology Information GenBank, accession number NM 031559.2).
Primers were previously tested in conventional reverse transcription PCR, in which a single band of the expected amplicon size was obtained. Quantitative (q)PCR was per-formed using an ABI 7300 Real Time PCR Instrument
(Applied Biosystems) for 40 cycles at 95∘C for 15 sec and
at 60∘C for 60 sec. Melting curve analysis of amplification
products was performed at the end of each PCR reaction to confirm that a single PCR product was detected. Each sample was run in triplicate, and PCR reactions without the addition of the template were used as blanks. The results were normalized to the reference gene, and fold changes in expression were calculated using threshold cycle (Ct) values.
2.6. Statistical Analysis. Data are expressed as the means± standard deviation (SD). All data were analyzed using the Kolmogorov-Smirnov normality test and were normally dis-tributed. Statistical comparisons were made using Student’s
𝑡-test. Correlation calculations were done using the Pearson
correlation coefficient. In all tests, the results were considered
significant with𝑃values≤0.05.
3. Results
3.1. Iron Status. The parameters related to iron status were measured to evaluate the effectiveness of iron dextran treatment in increasing the hepatic iron concentration. As expected, hepatic nonheme iron concentration was increased (𝑃 < 0.0001) in group SI relative to group S (Table 1).
3.2. Effect of Iron Overload on Serum Lipid and Glucose Profiles and on Hepatic Function. As can be observed inTable 1, the
serum level of total cholesterol was higher (𝑃 < 0.05) in
group SI than in group S. The same profile was observed for the concentration of cholesterol in other fractions. HDL-C levels in group S and group SI were not significantly different. Regarding triacylglycerol concentrations, again the rats in group SI showed higher levels compared with group S, and a similar profile was observed for glucose concentration. No difference between the groups was detected in aminotrans-ferase activities.
3.3. Effect of Iron Overload on Lipid Peroxidation and Protein Oxidation in the Liver. As shown inTable 1, the level of liver
TBARS of SI-fed animals was 2.18-fold higher (𝑃 < 0.0001)
(a) (b)
(c) (d)
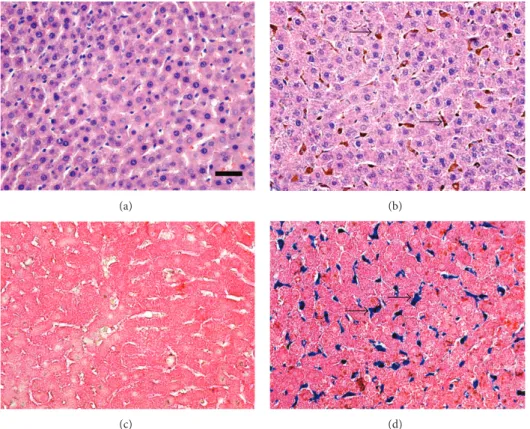
Figure 1: Photomicrographs of histological liver sections. (a) Standard group showing normal histology. (b) Standard group receiving the diet iron injections (group SI) featuring ballooned hepatic cells suggesting a hydropic degenerative process and focal granulomatous inflammation, cytoplasmic iron store in hepatocyte and Kupffer cell (arrow). (c) Control group showing normal histology. (d) Iron group receiving iron injections and featuring iron deposits in hepatocytes (arrow). ((a) and (b)) Hematoxylin & Eosin staining. ((c) and (d)) Perls staining. Bar = 50𝜇M.
0.0001) in protein oxidation caused by iron overload was seen in group SI compared with group S.
3.4. Histopathological Evaluation of Liver Tissue. Histological analysis showed that, generally, the liver of animals in group
S was normal (Figure 1(a)). The animals in group SI showed
a moderate presence of ballooned hepatic cells, which were diffuse throughout the parenchymal tissue. This is usually associated with granulomatous inflammatory foci, and tissue iron stores were located primarily in hepatocytes and Kupffer
cells (Figure 1(b)). Histological analysis with Perls’ technique
showed iron deposits in group SI (Figure 1(d)), whereas none
were observed in group S (Figure 1(c)).
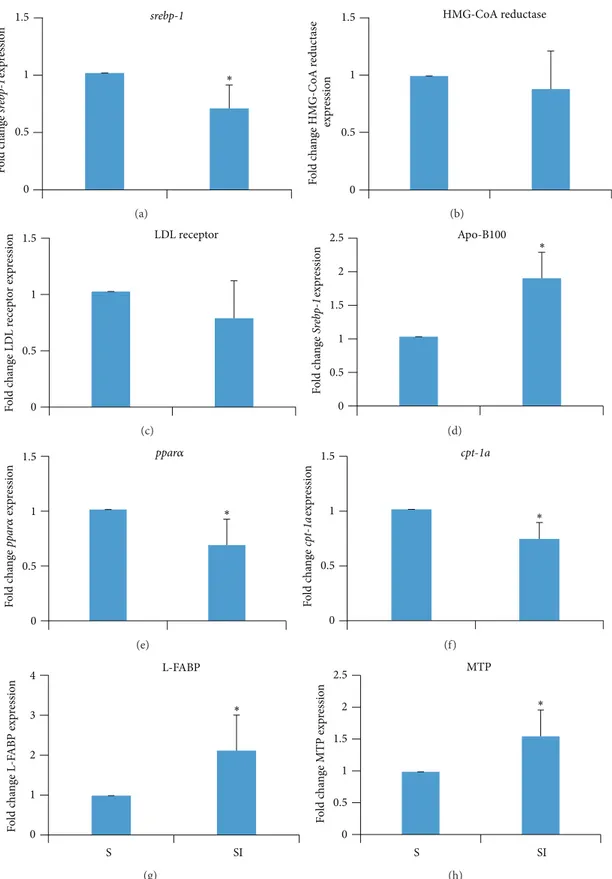
3.5. Effect of Iron Overload on Hepatic Gene Expression. Liver
expression ofsrebp-2was lower (𝑃 > 0.01) in group SI than
in group S (Figure 2(a)). There was no statistically significant
difference between groups with respect to the expression levels of HMG-CoA reductase and the LDL receptor in the
liver (Figures 2(b) and 2(c)). However, liver expression of
apoB100was higher (𝑃 > 0.01) in group SI than in group
S (Figure 2(d)). The expression ofppar𝛼andcpt1awas lower
in the SI than in the S group (𝑃 > 0.05and𝑃 > 0.01, resp.,
Figures2(e)and2(f)), and expression ofL-FABPandMTP
was higher in the SI than in the S group (𝑃 > 0.05for both,
Figures2(g)and2(h)).
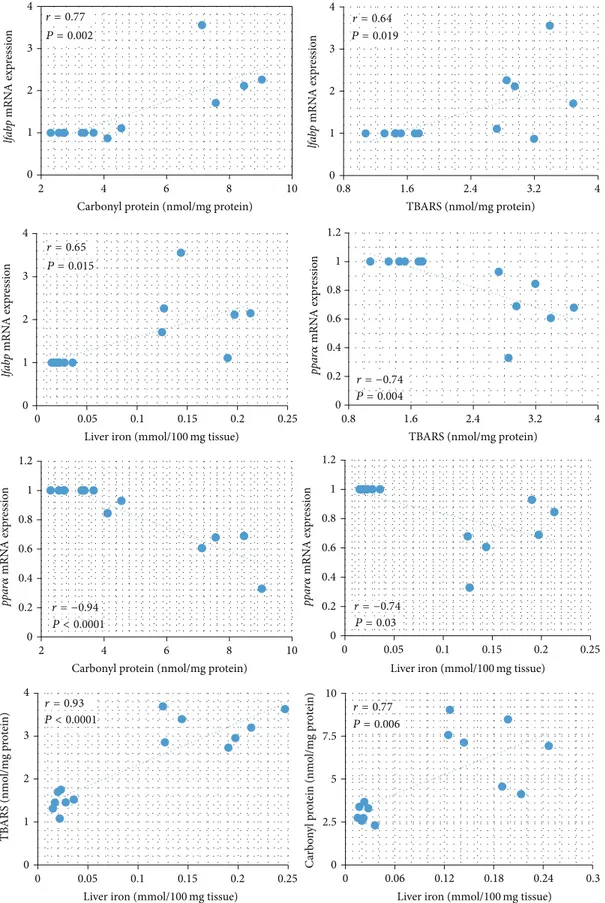
3.6. Correlation Analysis. InFigure 3, linear regression
anal-ysis of the groups showed thatlfabpmRNA expression was
positively correlated with carbonyl protein, TBARS, and iron
andppar𝛼mRNA expression was negatively correlated with
carbonyl protein, TBARS, and iron stores. There was a signif-icant association of iron stores in relation to TBARS and car-bonyl protein measured in the liver. In particular, iron stores were positively correlated with TBARS and carbonyl protein.
4. Discussion
The present study used anin vivorat model to demonstrate
that iron dextran can promote hypercholesterolemia and hypertriglyceridemia. These were associated with
downreg-ulation of genes involved in FA𝛽-oxidation and upregulation
of genes involved in the transport of lipids in the liver. Our data suggests that oxidative stress has a causal role.
The hepatic iron levels observed in the present study were moderate compared to patients with symptomatic hemochromatosis, who exhibit a 16- to 30-fold increase in
these levels [33]. This was also below the critical threshold
(>22-fold increase) in which hepatocellular injury has been
observed [34]. Association between excessive systemic iron
and diabetes emerged by the observation that the incidence of diabetes is increased in classical hereditary
hemochro-matosis [35]. Epidemiological data show a positive
0 0.5 1 1.5 ∗ srebp-1 F o ld c h an ge sr eb p-1 exp re ssio n (a) 0 0.5 1
1.5 HMG-CoA reductase
F o ld c h an ge HM G-C oA r ed u ct as e exp re ssio n (b) 0 0.5 1 1.5 F o ld c h an ge LD L r ecep to r exp re ssio
n LDL receptor
(c) 0 0.5 1 1.5 2
2.5 Apo-B100
∗ F o ld c h an ge Sr eb p-1 exp re ssio n (d) 0 0.5 1 1.5 ∗ ppar𝛼 F o ld c h an ge ppa r 𝛼 exp re ssio n (e) 0 0.5 1 1.5 ∗ cpt-1a F o ld c h an ge cp t-1a exp re ssio n (f) 0 1 2 3 4 S SI F o ld c h an ge L -F A BP exp ressio n L-FABP ∗ (g) 0 0.5 1 1.5 2 2.5 S SI F o ld c h an ge MTP exp ressio n MTP ∗ (h)
0 1 2 3 4
2 4 6 8 10
lfa
bp
mRN
A exp
ressio
n
Carbonyl protein (nmol/mg protein) r = 0.77
P = 0.002
0 1 2 3 4
0 0.05 0.1 0.15 0.2 0.25
lfa
bp
mRN
A exp
ressio
n
Liver iron (mmol/100mg tissue)
0 0.2 0.4 0.6 0.8 1 1.2
0.8 1.6 2.4 3.2 4
TBARS (nmol/mg protein)
0 0.2 0.4 0.6 0.8 1 1.2
2 4 6 8 10
Carbonyl protein (nmol/mg protein)
0 0.2 0.4 0.6 0.8 1 1.2
0 0.05 0.1 0.15 0.2 0.25
Liver iron (mmol/100mg tissue)
0 1 2 3 4
0 0.05 0.1 0.15 0.2 0.25
TB
ARS (nmo
l/m
g p
ro
tein)
Liver iron (mmol/100mg tissue)
0 2.5 5 7.5 10
0 0.06 0.12 0.18 0.24 0.3
C
arb
o
n
yl
p
ro
tein (nmo
l/m
g p
ro
tein)
Liver iron (mmol/100mg tissue)
0 1 2 3 4
0.8 1.6 2.4 3.2 4
lfa
bp
mRN
A exp
res
sio
n
TBARS (nmol/mg protein) r = 0.64
P = 0.019
r = 0.65
P = 0.015
P = 0.004
r = −0.74
r = −0.94
P < 0.0001
r = −0.74 P = 0.03
r = 0.93
P < 0.0001
r = 0.77
P = 0.006
ppa
r
𝛼
mRN
A exp
re
ssio
n
ppa
r
𝛼
mRN
A exp
re
ssio
n
ppa
r
𝛼
mRN
A exp
re
ssio
n
intolerance seen in diabetes type 2 [36,37]. Our experimental model also might be used to study this association.
ppar𝛼has an important role in the metabolic homeostasis
of FAs through the regulation of target genes encoding
enzymes for FA oxidation and FA transporters [11,12].ppar𝛼
activation promotes FA oxidation, ketone body synthesis,
and glucose sparing. Disabling theppar𝛼gene is known to
increase hepatic triglyceride accumulation, especially under
fasting conditions [38–40]. Pharmacological activation of
ppar𝛼has been shown to lower hepatic triglyceride levels and
to effectively attenuate steatohepatitis [12, 39, 41].
Further-more, hypercholesterolemia can decrease protein expression
of PPARs in the rat liver [42], and the hyperlipidemic fatty
liver rat model also exhibits a decrease in this protein [43].
Iron dextran decreasedppar𝛼expression, suggesting that it
would decrease FA oxidation, thus increasing serum
tria-cylglycerol concentration. Bonomo et al. [7] showed similar
effect of iron on the expression of PPAR alpha in hyperc-holesterolemic hamsters; however this study did not evaluate triacylglycerol metabolism. Oxidative stress and
inflamma-tion modulate PPAR receptors in diabetes [13], suggesting
that increased oxidative stress promoted by iron dextran may
have resulted in the decreased ppar𝛼 expression, this was
also correlated in this study. The oxidative stress could alter mRNA expressions involved lipid metabolism because reac-tive oxygen species can alter transcription factors, inducing or repressing the expression of genes. We suggest that reactive oxygen species can affect the translocation of transcription factors sensitive to the redox state to the nucleus. Changes in the mRNA expressions involved lipid metabolism may be due to the oxidation of transcription factors; NF-E2-related factor 1 (Nrf1) was recently found as regulator of hepatic lipid
metabolism [44]. We found that livercpt-1aexpression was
markedly decreased in iron dextran, which is in agreement
with previous studies by Koonen et al. [45] and Lelliott
et al. [46], who observed the same effect in dyslipidemic
conditions. These results indicate that the increase in serum triacylglycerol may be the result of decreased lipid oxidation and that the iron dextran could decrease FA oxidation by the
inhibition ofppar𝛼and its target genes in the liver.
ApoB-100 is associated with hepatic-derived non-HDL-C and is incorporated into nascent lipoprotein particles, along
with cholesterol and triglycerides [47]. The increased mRNA
levels of apoB-100, which were promoted by iron dextran,
suggest that an increase in the overall secretion of VLDL is caused by modifications in the packaging of this lipoprotein.
In addition to the upregulatory effect onapoB-100,
supple-mentation of iron increased the expression ofMTP in this
study. MTP plays an important role in VLDL assembly by
mediating the transfer of hepatic lipids to nascent apoB [27].
It has been reported thatMTPgene expression is enhanced
in the liver of both fructose-fed hamsters and obese diabetic
mice [48]. In the current study,MTPmRNA expression was
significantly increased in iron overloaded rats, which may contribute to increased plasma cholesterol and triacylglyc-erols, as MTP inhibitors have been developed and shown to
be effective lipid-lowering drugs in animal models [49].
Stud-ies with antioxidant compounds show that they are able to reverse the increase in MTP and apoB-100 that is seen in lipid
rich diets [24,50]. Therefore, iron dextran can increase
oxida-tive stress and this can alter the expression of these proteins. L-FABP is one of the most abundant proteins in the liver,
accounting for 2-3% of the total cytosolic protein pool [51].
As such, it can be expected to play an important role in cellular homeostasis. It serves as an intracellular transporter
of lipophilic ligands, such as long-chain FAs [52]. Its
expres-sion is modulated by developmental, hormonal, dietary, and pharmacological factors, and it may change in response to
specific diseases such as cholestasis [53] or alcohol-induced
liver injury [54]. Previous studies have demonstrated that,
in fatty liver rats, the expression of L-FABP mRNA was
increased in comparison to the control group [43]. Thus,
the iron dextran promotes effects similar to those found in the consumption of a high fat diet. L-FABP may have an additional cytoprotective role as it contains one cysteine and
several methionine residues [55] and forms a large portion
of the intracellular protein pool. Previous studies have shown that L-FABP is an important member of the hepatocellular antioxidant defense system, reducing ROS levels during
peri-ods of oxidative stress [56]. The positive correlation between
products generated by oxidative stress and L-FABP in this study also suggests that iron dextran can cause alterations in
this expression via redox imbalance. Abe et al. [23] showed
that rosuvastatin administration reduces L-FABP level, in part due to reducing oxidative stress, thus strengthening our hypothesis. However, our study is limited in that only the gene profile was analyzed; thus, it is important to confirm if alterations of genes expression are reflected by protein levels. The mRNA level of the other factors involved in FA metabolism (including SREBPs) was significantly increased in the livers of mice under conditions of elevated oxidative
stress [57]. Furthermore, an upregulation ofsrebp-2
stim-ulates hypercholesterolemia and hepatic steatosis because
srebp-2is activated in response to the reduction in hepatic cholesterol content. However, the alterations observed in
srebp-2, and the genes regulated by it (HMG-CoA reductase and LDL-R) does not seem to be involved in the mechanism of action of iron promoting hypercholesterolemia. Iron-treated rats showed higher serum cholesterol levels and
reduced expression of srebp-2 (and tendency of reduced
expression of HMGCR and LDLR). The reduction in
srebp-2expression may indicate feedback regulation in response to
high cholesterol levels.
5. Conclusions
The present study demonstrated that iron dextran increased oxidative stress, which was associated with the altered expres-sion of genes related to lipid metabolism and therefore contributing to hyperlipidemia.
Conflict of Interests
Acknowledgments
This study was supported by the Fundac¸˜ao de Amparo `a Pesquisa de Minas Gerais (FAPEMIG, Minas Gerais, Brazil) and the Conselho Nacional de Desenvolvimento Cient´ıfico e Tecnol´ogico (CNPq, Brazil).
References
[1] P. Dongiovanni, A. L. Fracanzani, S. Fargion, and L. Valenti, “Iron in fatty liver and in the metabolic syndrome: a promising therapeutic target,”Journal of Hepatology, vol. 55, no. 4, pp. 920– 932, 2011.
[2] J. M. McCord, “Is iron sufficiency a risk factor in ischemic heart disease?”Circulation, vol. 83, no. 3, pp. 1112–1114, 1991. [3] F. Ucar, S. Sezer, S. Erdogan, S. Akyol, F. Armutcu, and O. Akyol,
“The relationship between oxidative stress and nonalcoholic fatty liver disease: its effects on the development of nonalcoholic steatohepatitis,”Redox Report, vol. 18, no. 4, pp. 127–133, 2013. [4] S. Ichihara, “The pathological roles of environmental and redox
stresses in cardiovascular diseases,”Environmental Health and Preventive Medicine, vol. 18, no. 3, pp. 177–184, 2013.
[5] D. K. George, S. Goldwurm, G. A. Macdonald et al., “Increased hepatic iron concentration in nonalcoholic steatohepatitis is associated with increased fibrosis,”Gastroenterology, vol. 114, no. 2, pp. 311–318, 1998.
[6] S. Fargion, M. Mattioli, A. L. Fracanzani et al., “Hyperferritine-mia, iron overload, and multiple metabolic alterations identify patients at risk for nonalcoholic steatohepatitis,”The American Journal of Gastroenterology, vol. 96, no. 8, pp. 2448–2455, 2001. [7] L. D. F. Bonomo, M. Silva, R. D. P. Oliveira, M. E. Silva, and M. L. Pedrosa, “Iron overload potentiates diet-induced hypercho-lesterolemia and reduces liver ppar-𝛼expression in hamsters,”
Journal of Biochemical and Molecular Toxicology, vol. 26, no. 6, pp. 224–229, 2012.
[8] P. Nguyen, V. Leray, M. Diez et al., “Liver lipid metabolism,”
Journal of Animal Physiology and Animal Nutrition, vol. 92, no. 3, pp. 272–283, 2008.
[9] M. S. Brown and J. L. Goldstein, “TheSREBPpathway: regu-lation of cholesterol metabolism by proteolysis of a membrane-bound transcription factor,”Cell, vol. 89, no. 3, pp. 331–340, 1997. [10] H. Shimano, “Sterol regulatory element-binding proteins (SREBPs): transcriptional regulators of lipid synthetic genes,”
Progress in Lipid Research, vol. 40, no. 6, pp. 439–452, 2001. [11] K. Schoonjans, B. Staels, and J. Auwerx, “Role of the peroxisome
proliferator-activated receptor (PPAR) in mediating the effects of fibrates and fatty acids on gene expression,”The Journal of Lipid Research, vol. 37, no. 5, pp. 907–925, 1996.
[12] M. Rakhshandehroo, L. M. Sanderson, M. Matilainen et al., “Comprehensive analysis of PPAR𝛼-dependent regulation of hepatic lipid metabolism by expression profiling,” PPAR Research, vol. 2007, Article ID 26839, 13 pages, 2007.
[13] T.-I. Lee, Y.-H. Kao, Y.-C. Chen, N.-H. Pan, and Y.-J. Chen, “Oxidative stress and inflammation modulate peroxisome proliferator-activated receptors with regional discrepancy in diabetic heart,”European Journal of Clinical Investigation, vol. 40, no. 8, pp. 692–699, 2010.
[14] M. Raabe, M. M. V´eniant, M. A. Sullivan et al., “Analysis of the role of microsomal triglyceride transfer protein in the liver of tissue-specific knockout mice,”Journal of Clinical Investigation, vol. 103, no. 9, pp. 1287–1298, 1999.
[15] M. M. Veniant, E. Kim, S. McCormick et al., “Insights into apolipoprotein B biology from transgenic and gene-targeted mice,”Journal of Nutrition, vol. 129, no. 2S, supplement, pp. 451S–455S, 1999.
[16] J. R. Wetterau, K. A. Combs, S. N. Spinner, and B. J. Joiner, “Protein disulfide isomerase is a component of the microsomal triglyceride transfer protein complex,”The Journal of Biological Chemistry, vol. 265, no. 17, pp. 9800–9807, 1990.
[17] E. A. Fisher and H. N. Ginsberg, “Complexity in the secretory pathway: the assembly and secretion of apolipoprotein B-containing lipoproteins,”The Journal of Biological Chemistry, vol. 277, no. 20, pp. 17377–17380, 2002.
[18] R. A. Davis and T. Y. Hui, “2000 George Lyman Duff memorial lecture: atherosclerosis is a liver disease of the heart,” Arte-riosclerosis, Thrombosis, and Vascular Biology, vol. 21, no. 6, pp. 887–898, 2001.
[19] J. R. Wetterau, M. C. M. Lin, and H. Jamil, “Microsomal triglyceride transfer protein,”Biochimica et Biophysica Acta— Lipids and Lipid Metabolism, vol. 1345, no. 2, pp. 136–150, 1997. [20] F. Schroeder, C. A. Jolly, T.-H. Cho, and A. Frolov, “Fatty acid
binding protein isoforms: structure and function,”Chemistry and Physics of Lipids, vol. 92, no. 1, pp. 1–25, 1998.
[21] E. P. Newberry, Y. Xie, S. Kennedy et al., “Decreased hepatic triglyceride accumulation and altered fatty acid uptake in mice with deletion of the liver fatty acid-binding protein gene,”The Journal of Biological Chemistry, vol. 278, no. 51, pp. 51664–51672, 2003.
[22] W. Liao, T. Y. Hui, S. G. Young, and R. A. Davis, “Blocking microsomal triglyceride transfer protein interferes with apoB secretion without causing retention or stress in the ER,”Journal of Lipid Research, vol. 44, no. 5, pp. 978–985, 2003.
[23] M. Abe, N. Maruyama, K. Okada, S. Matsumoto, K. Matsumoto, and M. Soma, “Effects of lipid-lowering therapy with rosuvas-tatin on kidney function and oxidative stress in patients with diabetic nephropathy,”Journal of Atherosclerosis and Thrombo-sis, vol. 18, no. 11, pp. 1018–1028, 2011.
[24] E. E. Mulvihill, J. M. Assini, J. K. Lee et al., “Nobiletin attenuates VLDL overproduction, dyslipidemia, and atherosclerosis in mice with diet-induced insulin resistance,”Diabetes, vol. 60, no. 5, pp. 1446–1457, 2011.
[25] V. R. Miron, L. Bauermann, A. L. B. Morsch et al., “Enhanced NTPDase and 5-nucleotidase activities in diabetes mellitus and iron-overload model,”Molecular and Cellular Biochemistry, vol. 298, no. 1-2, pp. 101–107, 2007.
[26] Association of Official Analytical Chemists,Official Methods of Analysis, AOAC, Washington, DC, USA, 1980.
[27] J. A. Buege and S. D. Aust, “Microsomal lipid peroxidation,”
Methods in Enzymology, vol. 52, pp. 302–310, 1978.
[28] R. L. Levine, J. A. Williams, E. R. Stadtman, and E. Shacter, “Carbonyl assays for determination of oxidatively modified proteins,”Methods in Enzymology, vol. 233, pp. 346–357, 1994. [29] O. H. Lowry, N. J. Rosebrough, A. L. Farr, and R. J. Randall,
“Protein measurement with the Folin phenol reagent,” The Journal of Biological Chemistry, vol. 193, no. 1, pp. 265–275, 1951. [30] G. Li, X. Liu, H. Zhu et al., “Insulin resistance in insulin-resistant and diabetic hamsters (Mesocricetus auratus) is asso-ciated with abnormal hepatic expression of genes involved in lipid and glucose metabolism,”Comparative Medicine, vol. 59, no. 5, pp. 449–458, 2009.
three organs (liver, kidney, and testis) of male Wistar rats,”
Journal of Biochemical and Molecular Toxicology, vol. 24, no. 6, pp. 361–367, 2010.
[32] M. B. Reena, L. R. Gowda, and B. R. Lokesh, “Enhanced hyp-ocholesterolemic effects of interesterified oils are mediated by upregulating ldl receptor and cholesterol 7-𝛼-hydroxylase gene expression in rats,”The Journal of Nutrition, vol. 141, no. 1, pp. 24–30, 2011.
[33] A. S. Tavill, B. K. Sharma, and B. R. Bacon, “Iron and the liver: genetic hemochromatosis and other hepatic iron overload disorders,”Progress in Liver Diseases, vol. 9, pp. 281–305, 1990. [34] C. H. Park, B. R. Bacon, G. M. Brittenham, and A. S. Tavill,
“Pathology of dietary carbonyl iron overload in rats,”Laboratory Investigation, vol. 57, no. 5, pp. 555–563, 1987.
[35] D. A. McClain, D. Abraham, J. Rogers et al., “High prevalence of abnormal glucose homeostasis secondary to decreased insulin secretion in individuals with hereditary haemochromatosis,”
Diabetologia, vol. 49, no. 7, pp. 1661–1669, 2006.
[36] E. S. Ford and M. E. Cogswell, “Diabetes and serum ferritin concentration among U.S. adults,”Diabetes Care, vol. 22, no. 12, pp. 1978–1983, 1999.
[37] J. T. Salonen, T.-P. Tuomainen, K. Nyyss¨onen, H.-M. Lakka, and K. Punnonen, “Relation between iron stores and non-insulin dependent diabetes in men: case-control study,” The British Medical Journal, vol. 317, no. 7160, p. 727, 1998.
[38] P. Costet, C. Legendre, J. Mor´e, A. Edgar, P. Galtier, and T. Pineau, “Peroxisome proliferator-activated receptor𝛼-isoform deficiency leads to progressive dyslipidemia with sexually dimorphic obesity and steatosis,” The Journal of Biological Chemistry, vol. 273, no. 45, pp. 29577–29585, 1998.
[39] S. Kersten, “Peroxisome proliferator activated receptors and lipoprotein metabolism,”PPAR Research, vol. 2008, Article ID 132960, 11 pages, 2008.
[40] T. C. Leone, C. J. Weinheimer, and D. P. Kelly, “A critical role for the peroxisome proliferator-activated receptor𝛼(PPAR𝛼) in the cellular fasting response: the PPAR𝛼-null mouse as a model of fatty acid oxidation disorders,”Proceedings of the National Academy of Sciences of the United States of America, vol. 96, no. 13, pp. 7473–7478, 1999.
[41] E. Ip, G. Farrell, P. Hall, G. Robertson, and I. Leclercq, “Admin-istration of the potent PPAR𝛼 agonist, Wy-14,643, reverses nutritional fibrosis and steatohepatitis in mice,”Hepatology, vol. 39, no. 5, pp. 1286–1296, 2004.
[42] C. H. Park, E. J. Cho, and T. Yokozawa, “Protection against hypercholesterolemia by corni fructus extract and its related protective mechanism,”Journal of Medicinal Food, vol. 12, no. 5, pp. 973–981, 2009.
[43] Y. Zhang, M. Xie, J. Xue, and Z. Gu, “Osthole improves fat milk-induced fatty liver in rats: modulation of hepatic PPAR-alpha/gamma-mediated lipogenic gene expression,” Planta Medica, vol. 73, no. 8, pp. 718–724, 2007.
[44] Y. Hirotsu, N. Hataya, F. Katsuok, and M. Yamamoto, “NF-E2-related factor 1 (Nrf1) serves as a novel regulator of hepatic lipid metabolism through regulation of thelipin1andPGC-1𝛽genes,”
Molecular and Cellular Biology, vol. 32, no. 14, pp. 2760–2770, 2012.
[45] D. P. Y. Koonen, R. L. Jacobs, M. Febbraio et al., “Increased hepatic CD36 expression contributes to dyslipidemia associated with diet-induced obesity,”Diabetes, vol. 56, no. 12, pp. 2863– 2871, 2007.
[46] C. J. Lelliott, A. Ljungberg, A. Ahnmark et al., “Hepatic PGC-1beta overexpression induces combined hyperlipidemia and
modulates the response to PPARalpha activation,” Arterioscle-rosis, Thrombosis, and Vascular Biology, vol. 27, no. 12, pp. 2707– 2713, 2007.
[47] D. A. White, A. J. Bennett, M. A. Billett, and A. M. Salter, “The assembly of triacylglycerol-rich lipoproteins: an essential role for the microsomal triacylglycerol transfer protein,”British Journal of Nutrition, vol. 80, no. 3, pp. 219–229, 1998.
[48] R. K. Avramoglu and K. Adeli, “Hepatic regulation of apolipoprotein B,”Reviews in Endocrine and Metabolic Disor-ders, vol. 5, no. 4, pp. 293–301, 2004.
[49] G. M. Ksander, R. DeJesus, A. Yuan et al., “Diaminoindanes as microsomal triglyceride transfer protein inhibitors,”Journal of Medicinal Chemistry, vol. 44, no. 26, pp. 4677–4687, 2001. [50] C.-F. Kuo, Y.-C. Jao, and P. Yang, “Downregulation of hepatic
lipoprotein assembly in rats by fermented products ofMonascus pilosus,”Nutrition, vol. 24, no. 5, pp. 477–483, 2008.
[51] D. A. Burnett, N. Lysenko, J. A. Manning, and R. K. Ockner, “Utilization of long chain fatty acids by rat liver: studies of the role of fatty acid binding protein,”Gastroenterology, vol. 77, no. 2, pp. 241–249, 1979.
[52] R. M. Hagan, J. K. Davies, and D. C. Wilton, “The effect of charge reversal mutations in the𝛼-helical region of liver fatty acid binding protein on the binding of fatty-acyl CoAs, lysophos-pholipids and bile acids,”Molecular and Cellular Biochemistry, vol. 239, no. 1-2, pp. 55–60, 2002.
[53] G. Wang, H. Shen, G. Rajaraman et al., “Expression and antiox-idant function of liver fatty acid binding protein in normal and bile-duct ligated rats,”European Journal of Pharmacology, vol. 560, no. 1, pp. 61–68, 2007.
[54] M. A. Gyamfi, I. Damjanov, S. French, and Y.-J. Y. Wan, “The pathogenesis of ethanol versus methionine and choline deficient diet-induced liver injury,”Biochemical Pharmacology, vol. 75, no. 4, pp. 981–995, 2008.
[55] Y.-M. She, G.-Q. Wang, A. Loboda, W. Ens, K. G. Standing, and F. J. Burczynski, “Sequencing of rat liver cytosolic proteins by matrix-assisted laser desorption ionization—quadrupole time-of-flight mass spectrometry following electrophoretic separa-tion and extracsepara-tion,”Analytical Biochemistry, vol. 310, no. 2, pp. 137–147, 2002.
[56] G. Wang, Y. Gong, J. Anderson et al., “Antioxidative function of L-FABP in L-FABP stably transfected Chang liver cells,”
Hepatology, vol. 42, no. 4, pp. 871–879, 2005.
Submit your manuscripts at
http://www.hindawi.com
Stem Cells
International
Hindawi Publishing Corporationhttp://www.hindawi.com Volume 2014
Hindawi Publishing Corporation
http://www.hindawi.com Volume 2014
INFLAMMATION
Hindawi Publishing Corporation
http://www.hindawi.com Volume 2014
Behavioural
Neurology
Endocrinology
International Journal ofHindawi Publishing Corporation
http://www.hindawi.com Volume 2014
Hindawi Publishing Corporation
http://www.hindawi.com Volume 2014
Disease Markers
Hindawi Publishing Corporation
http://www.hindawi.com Volume 2014
BioMed
Research International
Oncology
Journal ofHindawi Publishing Corporation
http://www.hindawi.com Volume 2014
Hindawi Publishing Corporation
http://www.hindawi.com Volume 2014
Oxidative Medicine and Cellular Longevity
Hindawi Publishing Corporation
http://www.hindawi.com Volume 2014
PPAR Research
The Scientific
World Journal
Hindawi Publishing Corporationhttp://www.hindawi.com Volume 2014
Immunology Research
Hindawi Publishing Corporation
http://www.hindawi.com Volume 2014
Journal of
Obesity
Journal ofHindawi Publishing Corporation
http://www.hindawi.com Volume 2014
Hindawi Publishing Corporation
http://www.hindawi.com Volume 2014 Computational and Mathematical Methods in Medicine
Ophthalmology
Journal ofHindawi Publishing Corporation
http://www.hindawi.com Volume 2014
Diabetes Research
Journal ofHindawi Publishing Corporation
http://www.hindawi.com Volume 2014
Hindawi Publishing Corporation
http://www.hindawi.com Volume 2014
Research and Treatment
AIDS
Hindawi Publishing Corporation
http://www.hindawi.com Volume 2014
Gastroenterology Research and Practice
Hindawi Publishing Corporation
http://www.hindawi.com Volume 2014
Parkinson’s
Disease
Evidence-Based Complementary and Alternative Medicine
Volume 2014 Hindawi Publishing Corporation