DOI: http://dx.doi.org/10.5007/1980-0037.2016v18n1p1
1 University of Campinas. Ins-titute of Biology, Department of Structural and Functional Biology. Laboratory of Electromyography, Motor Control and Experimental Electro-thermotherapy. Campinas, SP. Brazil.
2 State University of Campinas. Institute of Biology, Department of Biochemistry and Tissue Biology. Laboratory of Exercise Biochemis-try. Campinas, SP. Brazil.
3 State University of Campinas. Institute of Biology, Department of Structural and Functional Biology. Laboratory of Endocrine Pancreas and Metabolism. Campinas, SP.
Received: 31 July 2015
Accepted: 21 November 2015
Joint immobilization: effects on muscular tissue
of obese and malnourished mice
Imobilização articular: efeitos sobre o tecido muscular
de camundongos obesos e desnutridos
Renato Rissi1
George Azevedo Lemos1
Bernardo Neme Ide2
Rafael Ludemann Camargo3
Renato Chaves Souto Branco3
Priscila Neder Morato3
Evanisi Teresa Palomari1
Abstract – Although it is a widely used resource for the treatment of musculoskeletal
injuries, immobilization causes deleterious efects in muscle tissue after a short period of time. his study aimed to evaluate the gastrocnemius and tibialis anterior muscles of obese and protein malnourished animals under joint immobilization condition. Overall, 28 adult male mice were used (C57 / BL6), being divided into four groups (N = 7): Control Group (CG), Immobilized Control Group (ICG), Immobilized Obese Group (IOG) and Immobilized Malnourished Group (IMG). he immobilization protocol was performed by the use of adhesive tape and plaster. he conditions and obesity and protein malnutrition have been developed through the ingestion of diets speciic for each group of animals. he histomorphometric analysis of muscles evaluated area and the diameter of muscle ibers. All immobilized groups showed reduction in the area and diameter of muscle ibers when compared to GC. Comparisons among immobilized groups showed that the area and diameter of muscle ibers of IOG and IMG were lower than ICG. he immobilization protocol caused reduction in muscle trophism in animals, and obese and malnourished animals sufered high losses under condition of muscle atrophy.
Key words: Immobilization; Muscular atrophy; Protein malnutrition; Obesity.
Resumo – Embora seja um recurso muito utilizado para tratamento de lesões
Joint immobilization in mice Rissi et al.
INTRODUCTION
About 40% of the human body is composed of skeletal muscle tissue which main function is to regulate the motor responses for the performance of daily physical activities1,2. According to Ferreira et al.3, the structure and
function of the muscle tissue are conditioned by factors such as innerva-tion, mechanical load imposed to the tissue, proprioceptive activity and performance of stretching/shortening cycles. he commitment of one of these factors will certainly lead to muscle atrophy.
Although it is a widely used resource for the treatment of musculoskel-etal injuries, joint immobilization causes deleterious efects on the afected tissue, such as muscle atrophy, decreased protein content, disturbances in the area / connective tissue of ibers, increased fatigability, loss of strength and contractile activity. However, its physiological, biochemical and mus-cular understanding still needs to be elucidated4.
Poor eating habits are associated with several health hazards, including obesity, whose indexes have grown in recent decades, leading to a serious public health problem in Brazil and worldwide5. According to De-Farias6
and Kimbal et al.7, obesity often interferes in the relationship of the
insu-lin hormone with the mechanisms of protein synthesis and degradation in the muscles. Considering that insulin plays a fundamental role in the synthesis and inhibition of proteolysis, in obese people, due to disorders in the insulinemic proile, they may show negative balance regarding the formation and degradation of body muscle mass.
Malnutrition is characterized as a disease that results from insui-cient food intake and energy and nutrients or even inadequate biological utilization of the ingested food. Whereas the incidence of malnutrition is increasing worldwide, such a condition has been considered a serious social problem and emerges as a worrying disease in the public health context8.
Muscle tissue is the most important source of protein available in the body; however, in cases of severe malnutrition, this tissue is considerably reduced. hus, during total or partial fast, there is loss of body protein in order to provide the conversion of amino acids into energy, resulting in total body weight loss9,10.
Based on the observations above, this study aimed to evaluate the skeletal muscle tissue of obese animals and those submitted to protein mal-nutrition under joint immobilization condition. It was considered that both morbidities associated with the use of immobilization may show cellular and molecular interactions that could enhance musculoskeletal disorders.
he characterization of muscle tissue through experimental techniques was aimed at assessing the risk/beneit that the joint immobilization pro-tocol provides for obese patients and those under protein malnutrition, as they are routinely at risk of being through procedures of this nature.
Experimental design
he project was approved by the Ethics Research Committee on Animal Use of the State University of Campinas (CEUA/Unicamp), under No. 2872-1 of 10/04/2012.
Overall, 28 male adult mice were used (C57 / BL6) (105 days) from the animal facilities of CEMIB/UNICAMP, kept in standard plastic cages under temperature of 22°C with light/dark cycle of 12 hours receiving ad libitum water and diet speciic for each group.
Animals were divided into four groups as follows: Control Group (CG, n = 7), Immobilized Control Group (ICG, n = 7), Immobilized Obese Group (IOG, n = 7) and Immobilized Malnourished Group (IMG, n = 7). Immobilization of the pelvic limb was held on the 91st day of life and
maintained until the end of the experiment (105th day).
Obesity and protein malnutrition induction
To induce obesity, soon after weaning, animals received normal protein diet (14% protein) until they reached 45 days of age. hen, up to the end of the experiment (105th day), mice received low-protein and high-fat diet,
containing 34% fat. However, to induce protein malnutrition, after wean-ing, animals received low-protein diet containing 6% protein. he intake of this diet remained until the end of the experimental period (day 105)11.
Body weight of animals and weight of retroperitoneal and perigonadal adipose tissues were used as variables for evaluation and characterization of obese and malnourished groups.
Immobilization Protocol
To perform the immobilization protocol, the following steps were followed: animals were previously anesthetized with a mixture of Ketamine (50mg/kg body weight) + xylazine (8mg/kg of body weight). Subsequently, the right hind limb was previously trichotomized and immobilized with hypoal-lergenic micropore (Cremer®). hen, immobilization was carried out with strips of waterproof adhesive tape - Cremer® (3 cm wide), which included pelvis, hip, knee (both in length) and ankle (plantar lexion). Subsequently, a strip of plaster Cremer® (2 cm in width and 10 cm in length) was moistened and applied without excessive torque pressure around the animal’s limb in order to prevent it from destroying immobilization performed with adhesive tape. Daily, immobilization was checked and, when damaged, was replaced. Immobilization was maintained for a period of two weeks (14 days).
Euthanasia and material collection
At the end of the experimental treatment (105th day), animals were
Joint immobilization in mice Rissi et al.
retroperitoneale perigonadal adipose tissues were also dissected, isolated and weighed on analytical scale (Shimadzu, Model AUW220D).
Preparation of the material and histomorphometric analysis
After dissection, the ventral segment of the gastrocnemius and tibialis anterior muscles were ixed in 10% bufered formalin solution for 24 hours at 22ºC. Protocol was followed with subsequent washing of samples, sub-sequent dehydration in alcohol baths, diaphanization with xylene baths and routine process of inclusion in parain.
After these steps, cross sections with thickness of 7mm were performed with a microtome (Leica® model RM2125RT). Subsequently, sections were stained with hematoxylin-eosin technique and completion of slides with cover slips in Canada Balm.
For histomorphometric study of images, they were captured using op-tical microscope (Olympus® model BX53) and a camera (Olympus® model QCOLLOR5) coupled to it. All images were captured at 10X objective.
his particular study on muscles quantiied the area and diameter of muscle ibers with the aid of software (Image_J). he areas and diameters of 225 ibers of tibialis anterior and gastrocnemius muscles per animal were thus obtained: 15 ibers per ield, three ields per section, a total of ive sections per animal. A lattice grid was used to deine the ield and the choice of 15 ibers was performed randomly. Muscle ibers of seven animals per group were quantiied (N = 7), totaling 1575 ibers in each group.
Statistical treatment
Data normality was veriied by the Shapiro-Wilk test. In case of normal data, analysis of variance (One-way ANOVA) and the “post hoc” Tukey test for multiple comparisons were used. his form of analysis was ap-plied in the following variables: weight of the gastrocnemius and tibialis anterior muscles (mg), body weight (g), weight of the retroperitoneal and perigonadal adipose tissues (mg).
In case of non-normality of data, the nonparametric Kruskal-Wallis was used, followed by “post hoc” Dunns for multiple comparisons. his form of analysis was applied to the area and diameter of muscle ibers. Statistical signiicance was set at p <0.05, using as analysis resource the GraphPadPrism version 5.00 for Windows, GraphPad Software, San Diego California USA, (www.graphpad.com).
RESULTS
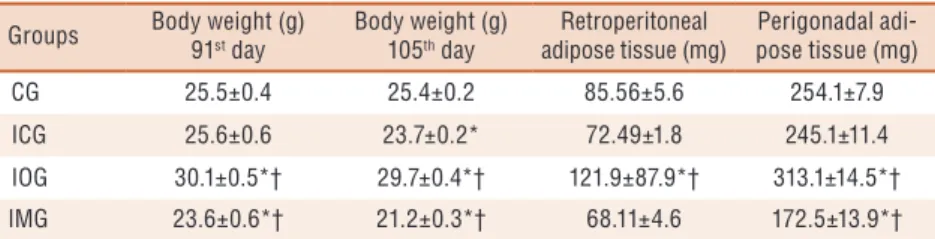
In a study previous to the immobilization procedure, when compared to the 91st days, IOG presented weight (g) 18% higher than CG, while IMG
presented weight 7.4% lower than the control group (p <0.05, Table 1). ICG showed no statistical diference when compared to CG (p <0.05, Table 1).
In comparison made on the day of sacriice (105th day), ICG and IMG
When comparing immobilized groups, it was observed that IOG showed body weight 25.3% higher compared to ICG. IMG showed reduction of 10.5% in body weight when compared to ICG (p <0.05, Table 1).
Results related to the retroperitoneal adipose tissue revealed an amount 42.4% higher in the retroperitoneal adipose reserve of IOG when compared to GC, and an amount 68.1% higher when compared to ICG (p <0.05, Table 1). IMG showed no signiicant diference in the retroperitoneal adipose reserves in relation to GC and ICG (p <0.05, Table 1).
he results observed in the perigonadal adipose tissue revealed that IOG had perigonadal fat reserves 23.2% higher than the GC and 27.7% higher than the ICG (p <0.05, Table 1). However, IMG showed rate 32.1% below the amount of perigonadal fat tissue in relation to CG and 29.6% lower in relation to ICG (p <0.05, Table 1).
Table 1. Body weight (g) at the 91st day, Body weight (g) at the 105th day, weight of retroperitoneal
and perigonadal adipose tissues (mg) evaluated according to the specific diet ingested by each group.
Groups Body weight (g) 91st day
Body weight (g) 105th day
Retroperitoneal adipose tissue (mg)
Perigonadal adi-pose tissue (mg)
CG 25.5±0.4 25.4±0.2 85.56±5.6 254.1±7.9
ICG 25.6±0.6 23.7±0.2* 72.49±1.8 245.1±11.4
IOG 30.1±0.5*† 29.7±0.4*† 121.9±87.9*† 313.1±14.5*†
IMG 23.6±0.6*† 21.2±0.3*† 68.11±4.6 172.5±13.9*†
GC = control group; ICG = Immobilized Control Group; IOG = Immobilized Obese Group; IMG = Immobilized Malnourished Group; * statistically significant values compared to GC; † Statistically significant values in relation to ICG (p <0.05). Values expressed as mean ± standard error.
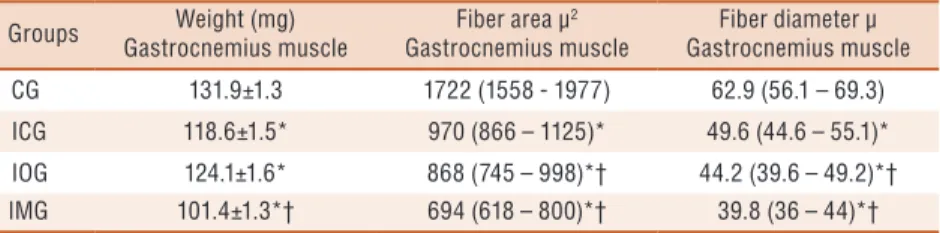
Weight and histomorphometric data of gastrocnemius muscle are report-ed in absolute values and in percentage in Table 2 for a better understanding of the variations in the course of the text.
In the observation of the gastrocnemius muscle mass, CG presented muscle weight 10.1% higher when compared to ICG. However, IOG and IMG showed values 5.9% and 23.1% lower than the CG (p <0.05, Table 2). In the observation of immobilized groups, IMG showed reduction of 14.5% in muscle mass compared to ICG (p <0.05, Table 2).
he iber area of ICG was 43.7% lower than CG, while IOG and IMG presented, respectively, iber area 49.6% and 59.7% lower than CG (p <0.05, Table 2). When compared immobilized groups only, statistical diferences were observed in muscle iber area of IOG and IMG compared to ICG. he iber area of IOG was10.5% lower compared to ICG, similarly, the iber area of IMG was 28.4% lower when compared to ICG (p <0.05, Table 2).
Joint immobilization in mice Rissi et al.
Table 2. Muscle mass (mg), area (μ2) and fiber diameter (μ) of the gastrocnemius muscle
Groups Weight (mg)
Gastrocnemius muscle
Fiber area µ2
Gastrocnemius muscle
Fiber diameter µ Gastrocnemius muscle
CG 131.9±1.3 1722 (1558 - 1977) 62.9 (56.1 – 69.3)
ICG 118.6±1.5* 970 (866 – 1125)* 49.6 (44.6 – 55.1)*
IOG 124.1±1.6* 868 (745 – 998)*† 44.2 (39.6 – 49.2)*†
IMG 101.4±1.3*† 694 (618 – 800)*† 39.8 (36 – 44)*†
CG = control group; ICG = Immobilized Control Group; IOG = Immobilized Obese Group; IMG = Immobilized Malnourished Group; * statistically significant values compared to GC; † Statistically significant values in relation to ICG (p <0.05). Weight of gastrocnemius muscle (g) expressed as mean ± standard error. Fiber area and diameter of gastrocnemius muscle expressed as median with 1st and 3rd quartiles.
he tibialis anterior muscle followed the same variation of the gastroc-nemius muscle in the analysis of the area and diameter of muscle ibers, demonstrating signiicant diferences in the comparisons among groups (p <0.05, Table 3).
In the observation of the anterior tibial muscle mass, only IMG decreased signiicantly by 10.9% compared to the control group and com-pared to ICG (p <0.05, Table 3). he other groups showed no statistically signiicant diferences when compared to each other.
he values found showed a decrease of 43.8%, 52.1% and 47% in the area of muscle ibers of ICG IOG and IMG, respectively, when compared to the control group (p <0.05, Table 3). Analyzing immobilized groups only, IOG had a decrease of 5.6% and IMG of 14.6% when compared to ICG (p <0.05, Table 3).
In the study of the diameter of ibers of anterior tibial muscles, it was observed that ICG, IOG and IMG showed a decrease of 24.1%, 26.2% and 31.8%, respectively, compared to the control group (p <0, 05, Table 3). he analysis of immobilized groups showed a reduction of 2.8% and 10.1% of IOG and IMG, both in relation to ICG (p <0.05, Table 3).
Table 3. Muscle mass (mg), area (μ2) and fiber diameter (μ) of the tibialis anterior muscle
Groups Weight (mg)
Tibialis anterior muscle
Fiber area µ2
Tibialis anterior muscle
Fiber diameter µ Tibialis anterior muscle
CG 40.5±1.1 1202 (1101 – 1340) 51.9 (48 – 56.4)
ICG 40.5±0.9 675 (622 – 742)* 39.4 (35.7 – 42.5)*
IOG 41.5±0.7 637 (593 – 710)*† 38.3 (35.2 – 41.8)*†
IMG 36.1±1.1*† 576 (498 – 648)*† 35.4 (33 – 38.7)*†
CG = control group; ICG = Immobilized Control Group; IOG = Immobilized Obese Group; IMG = Immobilized Malnourished Group; * statistically significant values compared to GC; † Statistically significant values in relation to ICG (p <0.05). Weight of tibialis anterior muscle (g) expressed as mean ± standard error. Fiber area and diameter of tibialis anterior muscle expressed as median with 1st and 3rd quartiles.
DISCUSSION
its daily tasks. In this context, the use of joint immobilization ultimately generates a commitment in the homeostasis of muscle ibers12.
In this study, the gastrocnemius and tibialis anterior muscles were prioritized because they have diferent characteristics and anatomical proximity. he immobilization protocol used led to loss of gastrocnemius muscle mass in all immobilized groups compared to the control group. However, the weight of the tibialis anterior muscle was signiicantly reduced only in IMG when compared to GC.
Based on the results obtained, it was observed that the tibialis anterior muscle sufered less damage compared to the gastrocnemius muscle. his can be explained by the fact that the tibialis anterior muscle has remained in the elongated position during the immobilization period and, accord-ing to Williams and Goldspink13, this position favors a gradual atrophy
of muscle tissue. In agreement with our results, Durigan et al.14 observed
that immobilization for diferent periods and methods results in muscle atrophy, ranging from 15% to 70%, depending on the animal model used and muscle iber evaluated.
he results expressed in Tables 2 and 3 showed reduced cross-sectional area and diameter of the muscle ibers of skeletal muscles in immobilized groups compared to the control group. his indicated that there was loss and, consequently, muscle tissue atrophy, which is consistent with ind-ings of diferent researchers in relation to skeletal muscle submitted to immobilization15.
Reinforcing the results of this research, Slimani et al.16 demonstrated
that gastrocnemius and tibialis anterior muscles, when immobilized, had higher percentage of muscle tropism compared to their controls and greater commitment of the gastrocnemius muscle. his episode can be explained by at least two hypotheses: 1) diference of anatomical position between muscles and 2) diference of iber types.
Regarding the anatomical position, muscles whose actions are anti-gravity, as in the case of gastrocnemius muscle, located in a posterior position in relation to the anterior tibial muscle, showed higher degree of atrophy in disuse situations as in joint immobilization17. In relation to
diference in iber types, Talmadge18 found that type I ibers have less
abil-ity to adapt when compared to type II ibers and are thus more intensely afected by disuse situations.
Although the present study shows limitations for not individually as-sessing types I and II muscle iber, it was veriied that the greatest damage occurred to the gastrocnemius muscle, as it is a mixed muscle and with predominance of type I ibers, while the tibialis anterior muscle presents predominance of type II ibers. However, detailed studies on this issue should be conducted in order to provide greater scientiic information on the atrophy of type I and II muscle ibers in periods of joint immobilization.
Joint immobilization in mice Rissi et al.
the weight of the gastrocnemius and tibialis anterior muscles decreased signiicantly in IMG when compared to ICG, while the weight of these muscles in IOG did not show statistically signiicant diferences compared to ICG. However, when the cross-sectional area and diameter of ibers were analyzed, both IOG and IMG showed signiicant reduction of these variables compared to ICG.
Considering these results, it was observed that muscle tissue of animals from IOG and IMG groups sufered severe damage when submitted to the immobilization protocol. Based on these results, it was suggested that animals that fed with high-fat (IOG) and low-protein diets (IMG) have developed mechanisms that have adversely afected muscle trophism, which can cause more damage to the homeostasis of the muscles studied when compared to ICG.
Kimball et al.7 reported that the loss of muscle mass is a common
feature in the diabetic / obese state, food restriction or even in prolonged physical inactivity, as in cases of joint immobilization.
Based on the above, it was observed that both conditions imposed and the resulting interaction between immobilization/obesity and immobiliza-tion/malnutrition proved to be decisive factors for the worsening of muscle atrophy in IOG and IMG groups.
For the development of skeletal muscle and maintenance of muscle mass in individuals, there needs to be insulin supply and adequate amount of contractile activity19. he efects of insulin on protein metabolism are
especially important in muscle tissue. hus, the anabolic efects of this hormone are reinforced by its anti-catabolic actions. However, insulin inhibits proteolysis, suppresses the release and inhibits oxidation of es-sential amino acids20.
Given these characteristics, it is believed that animals from IOG and IMG groups sufered more severe damage to the muscle tissue because in addition to being afected by immobilization condition, usually when in obesity and protein malnutrition conditions, animals present disturbances in the mechanisms of supply and use of the insulin hormone, which en-hances the muscle catabolic state.
Particularly in skeletal muscle, insulin resistance condition creates a compromised gluconeogenesis mechanism, with consequent lack of energy substrate for the muscle to make its shortening/stretching cycle. hus, muscle afected by these conditions may trigger an insulin resistance atrophy process20.
Corroborating the indings of this research on protein malnutrition, experimental studies have shown that the ofspring of rats exposed to this procedure showed a decrease in the area and diameter of the gastrocnemius and tibialis anterior muscle ibers21. Similarly, other studies have shown
that the ofspring of rats exposed to protein malnutrition during pregnancy and lactation showed alterations in the number and proportions of muscle ibers, as well as insulin resistance in adulthood22.
in relation to the consequences that immobilization causes to metabolism which, by themselves, in conditions of obesity and malnutrition, generates a signiicant muscle involvement.
CONCLUSION
Based on the histomorphometric results, it was concluded that the immo-bilization protocol led to reduced muscle trophism in the animals studied. In the case of associations between obesity, protein malnutrition and im-mobilization, the muscles analyzed showed reduced muscle trophism, in-dicating that animals under these conditions showed high muscle damage.
REFERENCES
1. Zhang P, Chen X, Fan M. Signaling mechanisms involved in disuse muscle atrophy. Med Hypotheses 2006;69(2):310-21.
2. Pelizzari C, Mazzanti A, Raiser AG, Lopes STA, Graça DL, Salbego FZ, et al. Estimulação elétrica neuromuscular de média frequência (russa) em cães com atroia muscular induzida. Ciênc Rural 2008;38(3):736-42.
3. Ferreira R, Neuparth MJ, Ascensao A, Magalhaes J, Duarte J, Amado F. Atroia muscular esquelética. Modelos experimentais, manifestações teciduais e isiopa-tologia. Rev Port Ciên Desp 2004;4(3):94-111.
4. Haddad F, Roy RR, Zhong H, Edgerton VR, Baldwin KM. Atrophy responses to muscle inactivity. II. Molecular markers of protein deicits. J Appl Physiol 2003;95(2):791-802.
5. Rocha SV, Cardoso JP, Dos-Santos CA, Munaro HLR, Vasconcelos LRC, Petroski EL. Sobrepeso/obesidade em professores: prevalência e fatores associados. Rev Bras Cineantropom Desempenho Hum 2015;17(4):450-9.
6. Farias JM. Efects of physical exercise in molecular parameters of the route of obesity and insulin signaling. Rev Bras Cineantropom Desempenho Hum 2014;16(5):588-95.
7. Kimball SR, Vary TC, Jeferson LS. Regulation of protein synthesis by insulin. Annu Ver Physiol 1994;56:321-348.
8. Monteiro CA. A dimensão da pobreza, da fome e da desnutrição no Brasil. Estud Av 2003;17(48):7-20.
9. Alves AP, Dâmaso AR, Dal-Pai V. Efeito da desnutrição protéicapré e pós-natal sobre a morfologia, a diferenciação e o metabolismo do tecido muscular estriado esquelético em ratos. J Pediat 2008;84(3):264-271.
10. Amaral RB, Martins CEC, Junior AHL, Painelli VS. Can leucine supplementation attenuate muscle atrophy? A literature review. Rev Bras Cineantropom Desem-penho Hum 2015;17(4):496-506.
11. Batista TM, Ribeiro RA, Amaral AG, De-Oliveira CA, Boschero AC, Carneiro EM. Taurine supplementation restores glucose and carbachol-induced insulin secretion in islets from low protein diet rats: involvement of Ach-M3R, Synt 1 and SNAP- 25 proteins. J Nutr Biochem 2012;23(3):306-12.
12. Paixão APS, Alves EGL, Bitencourt ACV, Junior JDC, Vasconcelos AS. Pa-dronização da técnica de imobilização do membro pélvico para estudo da atroia muscular esquelética em ratos. J Bras Ciên Ani 2011;4(7):274-91.
Joint immobilization in mice Rissi et al.
CORRESPONDING AUTHOR
Renato Rissi
Universidade Estadual de Campinas, Instituto de Biologia.
Rua Monteiro Lobato Nº 255, CEP: 13083-862, Campinas, SP – Brasil.
E-mail: [email protected] 14. Durigan JLQ , Cancelliero KM, Dias CNK, Silva CA, Guirro RRJ, Polacow,
MLO. Efeitos da imobilização articular aguda nos músculos do membro posterior de ratos: análise metabólica e morfométrica. Fisioter Pesqui 2006;13(2):38-45.
15. Santos-Junior FFU, Alves JSM, Machado AAN, Carlos PS, Ferraz ASM, Barbosa R, et al. Alterações morfométricas em músculo respiratório de ratos submetidos à imobilização de pata. Rev Bras Med Esporte 2010;16(3):215-8.
16. Slimani L, Micol D, Amat J, Delcros G, Meunier B, Taillandier D, et al. he worsening of tibialis anterior muscle atrophy during recovery post-immobilization correlates with enhanced connective tissue area, proteolysis, and apoptosis. Am J Physiol Endocrinol Metab 2012;303(11):1135-7.
17. Caiozzo VJ, Haddad F, Baker MJ, Henrrick RE, Pritto N, Baldwin KM. Micro-gravity induced transformations of myosin isoforms and contractile properties of skeletal muscle. J Appl Physiol 1996;81(1):123-32.
18. Talmadge RJ. Mechanical properties of rat soleus after long-term spinal cord transection. J Appl Physiol 2002;93(4):1487-97.
19. Luciano E, Mello MAR. Atividade física e metabolismo de proteínas em musculo de ratos diabéticos experimentais. Rev Paul Educ Fis1998;12(2):202-9.
20. Chingui LJ, Braquinho RP, Severi MTM, Da-silva, CA. Comportamento qui-miometabólico do músculo sóleo na fase aguda da imobilização articular. Fisioter Pesq 2008;15(2):194-9.
21. Alves AP, Damaso AR, Dal-pai V. Efeito da desnutrição protéica pré e pós-natal sobre a morfologia, a diferenciação e o metabolismo do tecido muscular estriado esquelético em ratos. J Pediat 2008;84(3):264-71.