Atmos. Chem. Phys., 16, 8095–8108, 2016 www.atmos-chem-phys.net/16/8095/2016/ doi:10.5194/acp-16-8095-2016
© Author(s) 2016. CC Attribution 3.0 License.
Evidence for ambient dark aqueous SOA formation in
the Po Valley, Italy
Amy P. Sullivan1, Natasha Hodas2, Barbara J. Turpin3, Kate Skog4, Frank N. Keutsch4,5, Stefania Gilardoni6, Marco Paglione6, Matteo Rinaldi6, Stefano Decesari6, Maria Cristina Facchini6, Laurent Poulain7,
Hartmut Herrmann7, Alfred Wiedensohler7, Eiko Nemitz8, Marsailidh M. Twigg8, and Jeffrey L. Collett Jr.1
1Colorado State University, Department of Atmospheric Science, Fort Collins, Colorado 80523, USA 2California Institute of Technology, Division of Chemical Engineering, Pasadena, California 91125, USA 3Rutgers University, Department of Environmental Sciences, New Brunswick, New Jersey 08901, USA 4University of Wisconsin – Madison, Department of Chemistry, Madison, Wisconsin 53706, USA
5Harvard University, Department of Chemistry and Chemical Biology, Cambridge, Massachusetts 02138, USA 6Istituto di Scienze dell’Atmosfera e del Clima, Consiglio Nazionale delle Ricerche, 40129 Bologna, Italy 7Leibniz Institute for Tropospheric Research, 04318 Leipzig, Germany
8Centre for Ecology and Hydrology, Bush Estate, Penicuik, EH26QB, UK
Correspondence to:Amy P. Sullivan (sullivan@atmos.colostate.edu)
Received: 31 October 2015 – Published in Atmos. Chem. Phys. Discuss.: 16 December 2015 Revised: 25 March 2016 – Accepted: 8 June 2016 – Published: 4 July 2016
Abstract.Laboratory experiments suggest that water-soluble products from the gas-phase oxidation of volatile organic compounds can partition into atmospheric waters where they are further oxidized to form low volatility products, pro-viding an alternative route for oxidation in addition to fur-ther oxidation in the gas phase. These products can remain in the particle phase after water evaporation, forming what is termed as aqueous secondary organic aerosol (aqSOA). However, few studies have attempted to observe ambient aq-SOA. Therefore, a suite of measurements, including near-real-time WSOC (water-soluble organic carbon), inorganic anions/cations, organic acids, and gas-phase glyoxal, were made during the PEGASOS (Pan-European Gas-AeroSOls-climate interaction Study) 2012 campaign in the Po Valley, Italy, to search for evidence of aqSOA. Our analysis fo-cused on four periods: Period A on 19–21 June, Period B on 30 June and 1–2 July, Period C on 3–5 July, and Period D on 6–7 July to represent the first (Period A) and second (Pe-riods B, C, and D) halves of the study. These pe(Pe-riods were picked to cover varying levels of WSOC and aerosol liquid water. In addition, back trajectory analysis suggested all sites sampled similar air masses on a given day. The data collected during both periods were divided into times of increasing rel-ative humidity (RH) and decreasing RH, with the aim of
di-minishing the influence of dilution and mixing on SOA con-centrations and other measured variables. Evidence for local aqSOA formation was only observed during Period A. When this occurred, there was a correlation of WSOC with organic aerosol (R2=0.84), aerosol liquid water (R2=0.65), RH
(R2=0.39), and aerosol nitrate (R2=0.66). Additionally,
this was only observed during times of increasing RH, which coincided with dark conditions. Comparisons of WSOC with oxygenated organic aerosol (OOA) factors, determined from application of positive matrix factorization analysis on the aerosol mass spectrometer observations of the submicron non-refractory organic particle composition, suggested that the WSOC differed in the two halves of the study (Period A WSOC vs. OOA-2 R2=0.83 and OOA-4 R2=0.04,
whereas Period C WSOC vs. OOA-2R2=0.03 and OOA-4 R2=0.64). OOA-2 had a high O/C (oxygen/carbon)
ra-tio of 0.77, providing evidence that aqueous processing was occurring during Period A. Key factors of local aqSOA pro-duction during Period A appear to include air mass stagna-tion, which allows aqSOA precursors to accumulate in the region; the formation of substantial local particulate nitrate during the overnight hours, which enhances water uptake by the aerosol; and the presence of significant amounts of am-monia, which may contribute to ammonium nitrate formation
and subsequent water uptake and/or play a more direct role in the aqSOA chemistry.
1 Introduction
The formation of secondary organic aerosol (SOA) remains a major source of uncertainty in predicting organic aerosol concentrations and properties that affect visibility, health, and climate (Kanakidou et al., 2005). SOA can form through gas-to-particle partitioning of semi-volatile organic com-pounds formed from gas-phase oxidation of VOCs (volatile organic compounds) (Seinfeld and Pankow, 2003). However, laboratory experiments and predictions suggest that water-soluble products from the gas-phase oxidation of VOCs can also partition into atmospheric waters (i.e., clouds, fogs, and aerosol water) and react to form low volatility products. These products can remain in the particle phase after wa-ter evaporation, forming what is wa-termed aqueous secondary organic aerosol (aqSOA) (e.g., Blando and Turpin, 2000; Al-tieri et al., 2006; Carlton et al., 2007; de Haan et al., 2009; Galloway et al., 2009; Ervens and Volkamer, 2010; Sun et al., 2010; Lee et al., 2012; Monge et al., 2012; Nguyen et al., 2012; Tan et al., 2012; Gaston et al., 2014).
Evidence that aqSOA may be a contributor to ambient SOA includes a gap between observed SOA and SOA pre-dicted by models that only include SOA formed via gas-phase oxidation and gas-particle partitioning (de Gouw et al., 2005; Heald et al., 2005). In addition, there is a tendency for smog chamber experiments (generally conducted under dry conditions) to form SOA that is less oxygenated and hygro-scopic than ambient SOA, suggesting a missing source of SOA (Aiken et al., 2008). In some locations, SOA surrogates have been shown to be more strongly correlated with liquid water than organic aerosol (Hennigan et al., 2008; Zhang et al., 2012), contrary to partitioning theory. Lastly, the abun-dance of ambient oxalate, an important product of aqSOA mechanisms (Carlton et al., 2007; Ervens et al., 2011), can-not be explained solely by gas-phase chemistry.
While it is important to study aqSOA, there have been few studies designed to observe aqSOA formation in the am-bient atmosphere. Therefore, a suite of near-real-time mea-surements was assembled, with the goal of identifying evi-dence of aqSOA formation in the Po Valley of Italy during the summer of 2012. A key measurement for this analysis was water-soluble organic carbon (WSOC), which previous research has suggested is a good proxy for SOA (e.g., Sulli-van et al., 2004; Miyazaki et al., 2006; Kondo et al., 2007). Fog measurements in the Po Valley have been well docu-mented (e.g., Facchini et al., 1999; Fuzzi et al., 2002). Fog is unlikely to occur in the summer; but even in summer, the region does have high relative humidity (60 to 80 %) and is polluted, providing favorable conditions for aqSOA forma-tion in wet aerosols.
Herein, we present an approach for the investigation of aqSOA formation in the ambient atmosphere and provide re-sults from such analyses. We examine WSOC as a function of known parameters likely to be associated with aqSOA, such as relative humidity (RH), aerosol liquid water (ALW), and organic aerosol (OA) concentration. We also look at the re-lationship of oxalate with sulfate and gas-phase glyoxal; ox-alate and sulfate are both produced by cloud processing and glyoxal is a known precursor to aqSOA formation (Yu et al., 2005; Tan et al., 2009; Ervens and Volkamer, 2010; Lim et al., 2010; Sorooshian et al., 2010). This study aims to iden-tify conditions conducive to aqSOA formation in this region.
2 Methods
Measurements were conducted within the Italian field cam-paign of the European Project PEGASOS (Pan-European Gas-AeroSOls-climate interaction Study) in June and July 2012, focusing on the Po Valley. PEGASOS was a European-wide study to address regional to global feedbacks between atmospheric chemistry and climate in different loca-tions as well as in the laboratory. The observaloca-tions included airborne measurements using a Zeppelin and multiple ground sites to study surface–atmosphere exchange, assess the ver-tical structure of the atmosphere, and study boundary layer photochemistry. An auxiliary site was located in Bologna. Our measurements were made at the main ground site in San Pietro Capofiume (SPC, Figs. 1 and 2). The SPC field station is located approximately 40 km northeast of Bologna and 30 km south of the Po River in flat terrain of agricultural fields (Fig. 1).
Our measurements included running a Particle-into-Liquid Sampler – Ion Chromatography (PILS-IC) (Orsini et al., 2003) system for inorganic cations, inorganic anions, and light organic acids, and a Particle-into-Liquid Sampler – Total Organic Carbon (PILS-TOC) system (Sullivan et al., 2004) for particle-phase WSOC. A PILS collects the ambi-ent particles into purified water, providing the liquid sam-ple for analysis. Both systems operated at 15 L min−1with a
dif-A. P. Sullivan et al.: Evidence for ambient dark aqueous SOA formation 8097
(a)
(b)
Figure 1.Maps created using Google Earth (version 7.1.5.1557) to
show the areas surrounding the(a)Bologna and(b)SPC sampling
sites.
ference between filtered and non-filtered measurements was being overestimated by ∼20 % before the carbon denuder
was replaced on 25 June. Therefore, the WSOC concentra-tions before this date have been corrected for this.
For the PILS-IC, the liquid sample from the PILS was split between two Dionex ICS-1500 ion chromatographs. These systems include an isocratic pump, a self-regenerating an-ion or catan-ion SRS-ULTRA suppressor, and a conductivity detector. The cations were separated using a Dionex Ion-Pac CS12A analytical (4×250 mm) column with eluent of
46
44
42
40
38
Latitude (
degr
ees
)
16 12 8
Longitude (degrees)
(a)
San Pietro Capofiume (SPC)
Bologna
46
44
42
40
38
Latitude (
degr
ees
)
16 12 8
Longitude (degrees)
(b)
46
44
42
40
38
Latitude (
degr
ees
)
16 12 8
Longitude (degrees)
(c) 46
44
42
40
38
Latitude (
degr
ees
)
16 12 8
Longitude (degrees)
(d)
Figure 2.Characteristic 72 h air mass back trajectories for(a)
Pe-riod A,(b) Period B,(c)Period C, and(d) Period D at the
PE-GASOS ground sites of Bologna and SPC. All back trajectories are based on the NOAA ARL HYSPLIT trajectory model.
18 mM methanesulfonic acid at a flow rate of 1.0 mL min−1.
A Dionex IonPac AS15 analytical (4×250 mm) column,
employing an eluent of 38 mM sodium hydroxide at a flow rate of 1.5 mL min−1, was used for the anion analysis. A
new chromatogram was obtained every 30 min with a sample loop fill time of 8 min. The limit of detection (LOD) for the various anions and cations was approximately 0.02 µg m−3.
These inorganic PILS data were also used to determine ALW from the Extended Aerosol Inorganics Model (E-AIM, Wexler and Clegg, 2002) run in a metastable state. More in-formation on the ALW calculations can be found in Hodas et al. (2014).
In the PILS-TOC, the liquid sample obtained from the PILS was pushed through a 0.2 µm PTFE liquid filter by a set of syringe pumps to ensure any insoluble particles were removed. The flow was then directed into a Sievers Model 800 Turbo TOC (Total Organic Carbon) Analyzer. This
alyzer works by converting the organic carbon in the liquid sample to carbon dioxide through chemical oxidation involv-ing ammonium persulfate and ultraviolet light. The conduc-tivity of the dissolved carbon dioxide formed is determined. The amount of organic carbon in the liquid sample is propor-tional to the measured increase in conductivity. The analyzer was run in online mode, providing a 6 min integrated mea-surement of WSOC with a LOD of 0.1 µg C m−3.
Other measurements presented here include 2.5 min inte-grated organic aerosol (OA) concentrations determined by a High-Resolution Time-of-Flight Aerosol Mass Spectrom-eter (HR-ToF-AMS) (Drewnick et al., 2005; DeCarlo et al., 2006; Canagaratna et al., 2007). Positive matrix factorization (PMF) analysis of the AMS OA data was performed using the Multilinear Engine algorithm (ME-2) (Paatero, 1999) imple-mented within the toolkit Solution Finder (SoFi) developed by Canonaco et al. (2013). More details on the AMS ME-2 analysis can be found in the Supplement and Figs. S1–S7. Gas-phase glyoxal was determined by the Madison Laser-Induced Phosphorescence (Mad-LIP) instrument (Huisman et al., 2008) at a time resolution of 51 s, hourly integrated am-monia was determined by a Monitor for AeRosols and Gases (MARGA) (ten Brink et al., 2007) in SPC and 30 min ammo-nia was determined by AiRRmoammo-nia (Erisman et al., 2001) in Bologna, and relative humidity was collected at a 1 min time resolution from a Vaisala weather transmitter WXT510. All data presented throughout are hourly averaged starting at the beginning of the hour.
3 Results and discussion 3.1 Overview
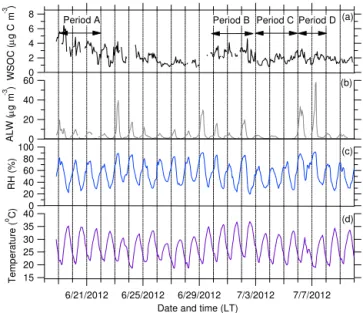
As previously mentioned, WSOC is key to our analysis, since in the absence of biomass burning (see Supplement for more details on the source apportionment of the AMS OA), the main contributor to WSOC has been found to be SOA (Sul-livan et al., 2006). Figure 3 shows the time series for WSOC during the entire study at SPC. Overall, the WSOC con-centration was higher in the first half of the study (before 25 June) compared with the second half. The WSOC con-centration peaked on 19 June then steadily decreased through 22 June. During this time the concentration ranged from about 1 to 7 µg C m−3. During July, the WSOC was relatively
constant at around 2 µg C m−3.
Therefore, our analysis will focus on comparing these two different halves of the study. Given our interest in examining for evidence of aqSOA we picked four periods with vary-ing levels of WSOC and ALW. We also picked cases with both sites sampling similar air masses on a given day. Pe-riod A represents the first half of the study and covers 19– 21 June. Period A has elevated WSOC and moderate ALW. As indicated by the difference in the length of the back tra-jectories (Draxler and Rolph, 2013; Rolph, 2013) shown in
8 6 4 2 0
W
S
O
C
(
g
C
m
)
-3
6/21/2012 6/25/2012 6/29/2012 7/3/2012 7/7/2012
Date and time (LT) 60
40
20
0
A
L
W
(
100 80 60 40 20 0
RH (%
)
40 35 30 25 20 15
T
e
m
p
er
a
tur
e
(
o C)
Period A Period C (a)
(c) (b)
(d)
Period B Period D
g
m
)
-3
Figure 3.Time series of hourly averaged measured (a)WSOC,
(b)calculated ALW,(c)RH, and(d)temperature at SPC. Any gaps
in ALW are due to missing PILS-IC data. The dashed vertical lines
indicate midnight local time (UTC+2). Periods A, B, C, and D are
also indicated.
Fig. 2, Period A occurred during the end of a stagnation. Pe-riod B (30 June, 1–2 July), PePe-riod C (3–5 July), and PePe-riod D (6–7 July) represent three different cases in the second half of the study. Period B has moderate ALW, Period C has low ALW, and Period D has the highest ALW observed during the study. As indicated by Fig. 2, all three of these periods rep-resent typical background conditions influenced by regional transport, but with slightly different flow patterns. The flows of Periods A and C are most similar. Due to changes in the WSOC concentrations and a non-consistent flow pattern on a daily basis, no periods between 23 and 29 June were exam-ined.
Cloud cover, as indicated from satellite measurements, showed that the days preceding Period A were generally cloud-free, whereas clouds developed west of the ground sites preceding Periods B, C, and D (not shown). The pres-ence of clouds was determined by examining satellite pic-tures set to the view of Europe at 11:00 LT provided by Sat24 (http://en.sat24.com/en/eu). Additionally, wet scav-enging was not likely important as there was very little pre-cipitation at SPC or west of the site during the entire study period. Only two cases of light rain lasting∼30 min, which
A.
P
.
Sulli
v
an
et
al.:
Evidence
for
ambient
dark
aqueous
SO
A
formation
8099
Table 1.Average concentrations of aerosol and gas-phase species along with various meteorological parameters observed during the times of RH increasing and decreasing during Periods A, B, C, and D at SPC.
OA WSOC Glycolate Acetate Formate Chloride Sulfate Oxalate Nitrate Sodium Ammonium Potassium Magnesium Calcium ALW
(µg m−3
) (µg C m−3
) (µg m−3
) (µg m−3
) (µg m−3
) (µg m−3
) (µg m−3
) (µg m−3
) (µg m−3
) (µg m−3
) (µg m−3
) (µg m−3
) (µg m−3
) (µg m−3
) (µg m−3
)
Period A RH increasing
8.93 4.73 0.28 0.40 0.43 0.13 3.49 0.24 2.91 NA NA NA NA NA 6.81
Period A RH decreasing
9.63 5.09 0.30 0.33 0.47 0.17 3.23 0.23 5.61 NA NA NA NA NA 7.29
Period B RH increasing
4.06 2.87 0.22 0.24 0.24 0.09 3.22 0.12 1.67 0.01 1.04 0.43 0.10 0.37 4.21
Period B RH decreasing
3.78 2.89 0.22 0.24 0.23 0.09 2.69 0.11 1.56 0.01 1.04 0.48 0.09 0.13 4.34
Period C RH increasing
2.05 1.55 0.24 0.28 0.23 0.11 2.80 0.13 1.18 0.04 0.92 0.51 0.11 0.26 2.89
Period C RH decreasing
2.01 1.54 0.22 0.32 0.23 0.10 2.75 0.12 1.28 0.04 0.94 0.54 0.09 0.06 2.64
Period D RH increasing
2.89 1.92 0.17 0.18 0.21 0.11 3.38 0.12 1.31 0.02 1.07 0.48 0.10 0.32 4.10
Period D RH decreasing
3.02 1.99 0.19 0.19 0.24 0.14 4.89 0.13 3.56 0.03 2.00 0.55 0.10 0.20 7.90
Ozone NOx SO2 Benzene Toluene Xylene Glyoxal T RH
(µg m−3
) (µg m−3
) (ppb) (µg m−3
) (µg m−3
) (µg m−3
) (ppb) (◦C) (%)
Period A RH increasing
47.42 28.90 0.65 0.21 1.21 0.26 0.05 24.47 64.49
Period A RH decreasing
63.70 17.75 1.14 0.27 1.78 0.34 0.09 26.09 57.66
Period B RH increasing
76.6 10.94 0.68 0.19 0.83 0.53 0.06 26.74 60.87
Period B RH decreasing
51.6 9.30 0.69 0.29 1.43 0.66 0.07 26.2 61.20
Period C RH increasing
61.29 9.72 0.40 0.17 1.18 0.40 0.05 23.31 60.60
Period C RH decreasing
75.40 8.08 0.51 0.17 1.11 0.44 0.07 25.02 53.88
Period D RH increasing
87.21 8.93 0.30 0.12 0.52 0.23 0.05 25.63 63.45
Period D RH decreasing
93.73 5.12 0.38 0.15 0.85 0.28 0.07 27.32 54.92
www
.atmos-chem-ph
ys.net/16/8095/2016/
Atmos.
Chem.
Ph
ys.,
16,
8095–
8108
,
Each period will be examined in terms of the times when RH increased from 40 to 70 % (times of RH increasing) and then when the RH decreased from 70 back to 40 % (times of RH decreasing). This was done to try to diminish the influ-ence of dilution and mixing on SOA concentrations and mea-surements of other key variables, since meamea-surements of a conserved tracer were not available. The idea behind this ap-proach was that the times of RH increasing would represent a time with a stable nocturnal boundary layer. The switch in regimes on average occurs at 05:00 LT, but varied from 03:00 to 08:00 LT. Therefore, the times of RH increasing primarily occurred in the dark. Table S1 in the Supplement provides a list of the exact times used for the times of RH increasing and decreasing in each period.
We first will compare all four periods to examine for ev-idence of aqSOA. Then we will provide a further examina-tion of aqueous aerosol tracers and WSOC for the two pe-riods with similar air flow (Pepe-riods A and C). Our analysis will largely be based on least squares regression correlation analysis to examine the relationship between various species and provide a general approach to examine for evidence of aqSOA. We have chosen to examine R2 values as opposed
to p values sinceR2 values can provide a useful tool for
explaining the amount of observed variance in a dependent variable that is explained by variation in an independent vari-able.pvalues merely indicate whether a relationship is
sta-tistically significant without information about the amount of variance explained. To help categorize the fraction of vari-ance explained, we consider a high correlation asR2values
greater than 0.7, a moderate correlation asR2values between
0.3 to 0.7, and a low correlation asR2values less than 0.3.
3.2 Evidence for aqSOA
WSOC is shown as a function of RH for the times of RH increasing (Fig. 4a and b) and decreasing (Fig. 4c and d) during Periods A, B, C, and D. For Periods B, C, and D, WSOC had no relationship with RH. Only during the times of increasing RH did Period A have a relationship of increas-ing WSOC with RH, consistent with local aqSOA forma-tion. This can further be illustrated by examining the cor-relation of WSOC vs. organic aerosol (OA), aerosol liquid water (ALW), and RH for Periods A, B, C, and D during the times of RH increasing (Figs. 5 and S8). In general, WSOC had a strong relationship with OA, but only Period A addi-tionally had a moderate correlation of the WSOC with both ALW (Period AR2=0.65 vs. Period BR2=0.15, Period C R2=0.29, and Period D R2=0.01) and RH (Period A R2=0.39 vs. Period BR2=0.01, Period CR2=0.12, and
Period DR2=0.07). The good correlation between WSOC
and ALW is in agreement with a previous smog chamber study that found that ALW is a key determinant of SOA yield (Zhou et al., 2011). This also supports a recent study that observed ambient aqSOA formation during the nighttime as evident by the increased partitioning of gas-phase WSOC
RH increasing
8
6
4
2
0
W
S
O
C
(
g
C
m
-3 )
100 80 60 40 20 0
RH (%)
(a) A
C
3 7 2 14
3 6 16 3
8
6
4
2
0
WS
OC (
100 80 60 40 20 0
RH (%)
B D
(b)
4 4 5 6
2 8 8 4
RH decreasing
8
6
4
2
0
WS
OC (
100 80 60 40 20 0
RH (%)
(c) A
C 7 5 4 15
7 6 11 3
8
6
4
2
0
WS
OC (
100 80 60 40 20 0
RH (%)
B D
(d)
8 2 3
4 3 7 2
g
C
m
-3 )
g
C
m
-3 )
g
C
m
-3 )
Figure 4.Hourly averaged WSOC as a function of RH for(a)
Pe-riods A and C and(b)Periods B and D during the times of RH
increasing and(c)Periods A and C and(d)Periods B and D
dur-ing the times of RH decreasdur-ing at SPC. The WSOC was binned into 10 % RH bands starting at 40 % RH. The error bars represent the standard deviation at each bin. Numbers above or below points represent the number of data points in each bin.
to the particle phase with increasing RH (El-Sayed et al., 2015). The study by El-Sayed et al. (2015) found the increase in the fraction of total WSOC in the particle phase (Fp)at
the two highest RH levels (70–80 %, >80 %) to be
statis-tically significant compared to theFpvalues at RH<60 %.
The main focus of their work was to investigate whether the uptake of gas-phase WSOC to aerosol water occurs through reversible or irreversible pathways. The data suggested the aqSOA was formed irreversibly. We investigate this with our data in Sect. 3.3.2.
A. P. Sullivan et al.: Evidence for ambient dark aqueous SOA formation 8101
Period A Period C
8 6 4 2 0 W S O C ( g C m -3) 12 8 4 0
OA (g m -3)
R2 = 0.84
(a) 4 3 2 1 0 WSOC ( 4 3 2 1 0 OA (
R2 = 0.66
(b) 8 6 4 2 0 WSOC ( 25 20 15 10 5 0 ALW (
R2 = 0.65
(c) 4 3 2 1 0 WSOC ( 6 5 4 3 2 1 0 ALW (
R2 = 0.15
(d) 8 6 4 2 0 WSOC ( 100 80 60 40 20 0 RH (%)
R2 = 0.39
(e) 4 3 2 1 0 WS O C ( 100 80 60 40 20 0 RH (%)
R2 = 0.01
(f) g C m -3 ) g C m -3 ) g C m -3)
g m -3)
g m -3) g m -3)
g C m -3 ) g C m -3)
Figure 5.Correlation of hourly averaged WSOC vs. OA for(a)
Pe-riod A and(b)Period C, ALW for(c)Period A and(d)Period C,
and RH for(e)Period A and(f)Period C at SPC. All plots are for
during the times of RH increasing.
at the same RH.) This argues that aqSOA formation was pre-dominately local during Period A.
3.3 Further examination of oxalate, sulfate, and WSOC during Periods A and C
3.3.1 Oxalate and sulfate
To help better understand the potential for aqSOA forma-tion, correlations with oxalate and sulfate can be examined. Oxalate and sulfate are known tracers for aerosol formation through cloud processing (Yu et al., 2005; Sorooshian et al., 2010), although sulfate does also have a substantial, albeit slower, gas-phase formation pathway (Seinfeld and Pandis, 2006). As shown in Fig. 8a and b for Periods A and C, dur-ing both the times of RH increasdur-ing and decreasdur-ing, there is a positive linear relationship between oxalate and sulfate (R2ranged from 0.39 to 0.68). The association between
ox-alate and sulfate but not oxox-alate and WSOC in Period A sug-gests that the local aqSOA formed in wet aerosols during Pe-riod A has little effect on oxalate. This result supports the
Period A Period C 8 6 4 2 0 W S O C ( g C m -3) 8 6 4 2 0
Nitrate (g m -3)
R2 = 0.66
(a) 3.0 2.5 2.0 1.5 1.0 0.5 0.0 WSOC ( 2.0 1.5 1.0 0.5 0.0 Nitrate ( R2 = 0.01
(b) 8 6 4 2 0 WSOC ( 0.4 0.3 0.2 0.1 0.0 Oxalate ( R2 = 0.16
(c) 3.0 2.5 2.0 1.5 1.0 0.5 0.0 WSOC ( 0.20 0.10 0.00 Oxalate ( R2 = 0.77
(d) 8 6 4 2 0 WSOC ( 6 5 4 3 2 1 0 Sulfate ( R2 = 0.07
(e) 3.0 2.5 2.0 1.5 1.0 0.5 0.0 WSOC ( 5 4 3 2 1 0 Sulfate ( R2 = 0.04
(f) g C m -3) g C m -3) g C m -3) g C m -3) g C m -3)
g m -3)
g m -3)
g m -3)
g m -3) g m -3)
Figure 6. Correlation of hourly averaged WSOC vs. nitrate for
(a)Period A and(b)Period C, oxalate for(c)Period A and(d)
Pe-riod C, and sulfate for(e)Period A and(f)Period C at SPC. All
plots are for during the times of RH increasing.
12 10 8 6 4 2 0 N it ra te ( g m -3)
6/21/2012 6/26/2012 7/1/2012 7/6/2012
Date and time (LT)
12 10 8 6 4 2 0 (a) (b)
Period A Period B Period C Period D
Figure 7.Time series of hourly averaged AMS nitrate observed at
(a)SPC and(b)Bologna. The dashed vertical lines indicate
mid-night local time (UTC+2). Periods A, B, C, and D are also
indi-cated.
RH increasing RH decreasing 0.35 0.30 0.25 0.20 0.15 0.10 0.05 0.00 O x a la te ( g m -3) 5 4 3 2 1 0
Sulfate (g m -3
) Period A
R2 = 0.56
Period C
R2 = 0.39
(a) 0.35 0.30 0.25 0.20 0.15 0.10 0.05 0.00 O x a late ( 4 3 2 1 0 Sulfate ( Period A
R2 = 0.52
Period C
R2 = 0.68
(b) 0.35 0.30 0.25 0.20 0.15 0.10 0.05 0.00 O x a late ( 80x10-3 60 40 20 0 Glyoxal (ppb) Period A
R2 = 0.10
Period C
R2 = 0.05
(c) 0.35 0.30 0.25 0.20 0.15 0.10 0.05 0.00 O x a late ( 0.12 0.08 0.04 0.00 Glyoxal (ppb) Period A
R2 = 0.01
Period C
R2 = 0.44
(d) 0.35 0.30 0.25 0.20 0.15 0.10 0.05 0.00 O x alate ( 15 10 5 0 ALW ( Period A
R2 = 0.01
Period C
R2 = 0.07
(e) 0.35 0.30 0.25 0.20 0.15 0.10 0.05 0.00 O x alate ( 12 8 4 0 ALW ( Period A
R2 = 0.17
Period C
R2 = 0.04
(f) g m -3) g m -3) g m -3) g m -3) g m -3)
g m -3
)
g m -3
) g m -3
)
Figure 8.Correlation of hourly averaged oxalate vs. sulfate for
Pe-riods A and C during the times of RH(a)increasing and (b)
de-creasing, gas-phase glyoxal for Periods A and C during the times of
RH(c)increasing and(d)decreasing, and ALW for Periods A and
C during the times of RH(e)increasing and(f)decreasing at SPC.
supposition that oxalate is not a universal marker for aqSOA. This is further illustrated in our data by examining the cor-relation of oxalate vs. gas-phase glyoxal, a known precursor for aqSOA (Tan et al., 2009; Ervens and Volkamer, 2010; Lim et al., 2010), and ALW (Fig. 8c–f). Laboratory experi-ments suggest a relationship between oxalate and gas-phase glyoxal when there is in-cloud processing as oligomers have been proposed to be the dominant products from processing in aerosol water when hydroxyl radical concentrations are on the order of 10−12M (Lim et al., 2010; Tan et al., 2010).
Ox-alate could be produced in aerosol water at lower hydroxyl radical concentrations, such as 10−13M, due to insufficient
organic radical concentrations for oligomer formation (Lee et al., 2011). Although the hydroxyl radical concentrations are unknown, there is only a relationship between oxalate and gas-phase glyoxal for Period C during times of RH de-creasing (R2=0.44), which is when clouds were observed
west of the site. In addition, there is no important relation-ship observed between oxalate and ALW for either period (allR2<0.17).
8 6 4 2 0 O O A o r W S O C ( g C m -3)
6/21/2012 6/25/2012 6/29/2012 7/3/2012 7/7/2012
Date and time (LT)
8 6 4 2 0 8 6 4 2 0 8 6 4 2 0 (a) (b)
Period A Period C
(c)
(d) WSOC OOA-1
OOA-2 OOA-3 OOA-4
Period B Period D
Figure 9.Time series of hourly averaged WSOC with AMS
ME-2 factors(a)OOA-1,(b) OOA-2,(c)OOA-3, and(d)OOA-4 at
SPC. The units for each factor have been converted from µg m−3
to µg C m−3using their calculated OM
/OC ratio (OOA-1=1.81,
OOA-2=2.15, OOA-3=2.13, and OOA-4=1.62). The dashed
vertical lines indicate midnight local time (UTC+2). Periods A,
B, C, and D are also indicated.
3.3.2 WSOC
The above analysis suggests that the majority of the WSOC observed during the first half of the study, as illustrated by Period A, is formed locally via chemistry in aerosol liquid water. Clearly, WSOC in the second half of the measure-ments appears to be different and to derive from different sources. As illustrated by Period C, the WSOC during this time is likely more regional, with contributions from gas-to-particle partitioning and possibly in-cloud aqSOA.
To further explore this idea of different types of WSOC, the WSOC observations were compared to positive matrix factorization (PMF) analysis of the AMS OA data collected at SPC. Five factors, one HOA (hydrocarbon-like OA) and four OOA (oxygenated OA), were found. The four OOA fac-tors include one semi-volatile type (OOA-1) and three low volatility types (OOA-2, OOA-3, and OOA-4). More details on the AMS ME-2 analysis can be found in the supporting information.
As shown in Fig. 9, the measured WSOC from the first half of the study is dominated by OOA-2 and the second half by OOA-4. This can be further illustrated by looking at the correlation of WSOC vs. OOA-2 and OOA-4 during the times of RH increasing for Periods A and C (Fig. 10). The WSOC in Period A is most strongly correlated with OOA-2 (R2=0.83) and in Period C with OOA-4 (R2=0.64).
A. P. Sullivan et al.: Evidence for ambient dark aqueous SOA formation 8103
Period A Period C
8
6
4
2
0
W
S
O
C
(
g
C
m
-3)
0.6 0.4 0.2 0.0
OOA-1 (g C m -3
)
R2 = 0.41
(a) 4
3
2
1
0
WSOC (
0.8 0.6 0.4 0.2 0.0
OOA-1 (
R2 = 0.02
(b)
8
6
4
2
0
WSOC (
4 3 2 1 0
OOA-2 (
R2 = 0.83
(c) 4
3
2
1
0
WSOC (
40x10-3
30 20 10 0
OOA-2 (
R2 = 0.03
(d)
8
6
4
2
0
WSOC (
3.0 2.0 1.0 0.0
OOA-3 (
R2 = 0.06
(e) 4
3
2
1
0
WSOC (
1.0 0.8 0.6 0.4 0.2 0.0
OOA-3 (
R2 = 0.01
(f)
8
6
4
2
0
WS
O
C
(
2.0 1.5 1.0 0.5 0.0
OOA-4 (
R2 = 0.04
(g) 4
3
2
1
0
WS
O
C
(
1.2 0.8 0.4 0.0
OOA-4 (
R2 = 0.64
(h)
g
C
m
-3)
g
C
m
-3)
g
C
m
-3)
g
C
m
-3)
g
C
m
-3)
g
C
m
-3)
g
C
m
-3)
g C m -3
)
g C m -3
)
g C m -3
)
g C m -3
) g C m -3)
g C m -3
)
g C m -3
)
Figure 10.Correlation of hourly averaged WSOC vs. AMS ME-2
factors OOA-1 for(a)Period A and(b)Period C, OOA-2 for(c)
Pe-riod A and(d)Period C, OOA-3 for(e)Period A and(f)Period C,
and OOA-4 for(g)Period A and(h)Period C at SPC. All plots are
for during the times of RH increasing.
to reproduce the total WSOC as a linear combination of the different factors, whilst minimizing the residuals and, unlike in Timonen et al. (2013), capping the individual factor con-tributions at 1 to allow conservation of the carbon mass. The regression analysis was carried out with a zero intercept like in Timonen et al. (2013), as well as with a non-zero inter-cept to account for possible instrumental biases between the AMS and PILS methods. Only the four OOA factors were considered, while HOA was assumed to be completely insol-uble. All concentrations are in carbon mass units, which for the AMS factors were derived from organic mass concentra-tions through factor-specific OM/OC ratios. The results of
the regression are reported for the whole PILS measurement period and also for Periods A and C separately.
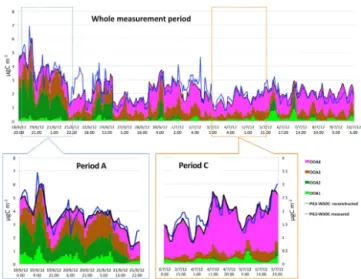
Figure 11.Time series of hourly averaged AMS ME-2 OOA
fac-tors, WSOC measured, and WSOC reconstructed for the whole measurement period (top), Period A (bottom left), and Period C (bottom right) at SPC. The units for each OOA factor have
been converted from µg m−3 to µg C m−3 using their calculated
OM/OC ratio.
The results for the whole measurement period indicate that the largest contributions to the WSOC must be attributed to the OOA types which were simply the most abundant (OOA-3 and OOA-4), but the water-soluble fractions as reflected in the regression coefficients were greatest for OOA-2 and OOA-4, in agreement with their high correlation coefficients with WSOC. Interestingly, OOA-2 and OOA-4 are also the factors possessing the highest O/C ratios (0.77 and 0.76,
re-spectively), with respect to the other two (O/C=0.48 for
OOA-1 and 0.36 for OOA-3). Therefore, in this study the factor-specific WSOC fractions seem to be related to the oxy-gen contents measured by the AMS.
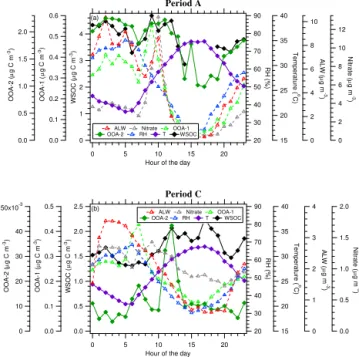
The multilinear regression analysis performed on the Pe-riod A measurements suggests that the largest water-soluble fractions are exhibited by OOA-1 and OOA-2, whose con-centrations were observed to increase along with RH and WSOC for all the days in this period of the campaign. Due to the very different absolute average concentrations, the second factor (OOA-2) provided the largest contribu-tion to WSOC, accounting for more than one-third of the to-tal water-soluble organic carbon concentration. Interestingly, the diurnal trend of OOA-1 indicated that its partitioning to the aerosol phase was largely reversible, and its concentra-tions declined steeply in the late morning hours when RH and ALW decreased (Fig. 12a). In the same hours of the day, the OOA-2 concentrations were largely unaffected by RH, indicating (a) that OOA-2 mainly accounted for oxidized compounds stable in the aerosol phase and (b) that boundary layer growth is not the reason for the decrease in OOA-1 as this should have affected all factors. OOA-1 and OOA-2 can
Period A 12 10 8 6 4 2 0 N itr at e ( 20 15 10 5 0
Hour of the day 4 3 2 1 0 WSO C ( 90 80 70 60 50 40 30 20 RH ( % ) 10 8 6 4 2 0 A L W ( g m )-3 0.6 0.5 0.4 0.3 0.2 0.1 0.0 OOA-1 ( 2.0 1.5 1.0 0.5 0.0 O O A -2 ( g C m ) -3 40 35 30 25 20 15 Temp erature ( o C)
ALW Nitrate OOA-1 OOA-2 RH T WSOC
(a) Period C 2.0 1.5 1.0 0.5 0.0 N itr at e ( 20 15 10 5 0
Hour of the day 2.5 2.0 1.5 1.0 0.5 0.0 WS O C ( 90 80 70 60 50 40 30 20 RH ( % ) 4 3 2 1 0 ALW ( 0.5 0.4 0.3 0.2 0.1 0.0 OOA-1 ( 50x10-3 40 30 20 10 0 OOA-2 ( 40 35 30 25 20 15 Temp erature ( o C)
ALW Nitrate OOA-1 OOA-2 RH T WSOC
(b) g C m ) -3 g C m ) -3 g C m ) -3 g C m ) -3 g C m ) -3 g m )-3 g m )-3 g m )-3
Figure 12.Diurnal profile of WSOC, OOA-1, OOA-2, RH,
temper-ature, ALW, and nitrate for(a)Period A and(b)Period C at SPC.
therefore be hypothesized as two aging stages of aqSOA for-mation during Period A.
Interestingly, some OOA-2 is also produced in Periods B and D. Although the concentration levels of OOA-2 observed are similar between Periods A and D, OOA-2 concentrations are much more sustained across the day in Period A. In ad-dition, as illustrated in the diurnal profiles for these periods (Fig. S10) the 2 follows along more closely with OOA-1, RH, and ALW in Periods B and D, likely due to the dif-ferences in meteorology and/or chemistry of these periods compared to Period A. Regardless of these differences, the observations all still point to the strong relationship between OOA-1, OOA-2, and ALW.
The results obtained for Period C show again that the greatest coefficients (hence the largest water-soluble frac-tions) were found for OOA-2 and OOA-4. However, due to its very small concentrations in this period, OOA-2 provided a negligible contribution to WSOC (1 %), while OOA-4 was estimated to account for more than half of the WSOC carbon content. The examination of time trends indicates that OOA-4 is mainly a background component of the aerosol, showing no appreciable increase at the time when RH increased for a few hours on the mornings of 5 and 6 July. Similar to Pe-riod A, here again the times when RH and ALW were high showed relatively high concentrations of OOA-1 (Fig. 12b), which represented an additional (though small compared to OOA-4) contribution to WSOC. Period C provides a case where significant OOA-1 is formed, but not OOA-2.
Overall, whilst not without uncertainty, the above findings support the idea that two different types of WSOC occurred
during these two different periods. They also support the idea that aqueous processing is dominating during the times of RH increasing during Period A, and OOA-2 represented the most important component. The high O/C ratio of
OOA-2 is expected for SOA formed through aqueous-phase reac-tions, because precursors are water-soluble and thus have low carbon numbers and high O/C ratios. Average O/C ratios
of∼0.7 to 1.1 have been observed in the oligomeric
prod-ucts formed from laboratory experiments involving hydroxyl radical oxidation and/or aqueous photolysis of methylgly-oxal, glycolaldehyde, and phenolic compounds (Altieri et al., 2008; Tan et al., 2009; Perri et al., 2010; Sun et al., 2010). The high O/C ratios observed for the other main WSOC
component, OOA-4, which dominates Period C, could be ex-plained by extensive aging of non-aqueous SOA (Lambe et al., 2011). However, in-cloud aqueous-phase reactions could have occurred upwind of the Po Valley, as indicated by the occurrence of oxalate and clouds previously discussed. Our measurements are fully consistent, in indicating that OOA-4 was mainly transported to the site and was not a product of the local aqueous-phase heterogeneous chemistry in the Po Valley atmospheric surface layer.
3.4 Conditions for local aqSOA
What leads to strong local aqSOA formation during Period A at SPC? High ALW was present throughout the study (Fig. 3b). It was observed that the days with the highest ALW also had the highest aerosol loading in the lowest layers of the atmosphere. However, no other day outside of Period A, except for 23 June, had a relationship of WSOC with RH dur-ing the times of RH increasdur-ing. This suggests that high ALW or aerosol loading alone are not sufficient for local aqSOA formation.
As previously mentioned, during Period A early morning nitrate peaks were observed only at the SPC ground site and not at the urban site. However, just the presence of high ni-trate (above 2 µg m−3)does not seem to lead to aqSOA as
no relationship of WSOC as a function of RH was observed on 6 and 7 July (Period D) when nitrate in concentrations similar to those of Period A were observed at SPC. Interest-ingly, the nitrate observed on these days was also observed in Bologna (Fig. 7). The timing of the peak nitrate concen-tration also differed from Period A; it occurred later in the morning, around 07:00 LT, whereas during Period A nitrate peaked around midnight or 01:00 LT and then again around 07:00 LT. This suggests that the presence and timing of ele-vated nitrate, which is a strong determinant of ALW, may be important for local aqSOA production and resulting WSOC aerosol concentrations in this region.
A. P. Sullivan et al.: Evidence for ambient dark aqueous SOA formation 8105
80
60
40
20
0
A
m
m
o
n
ia
(
g
m
-3
)
6/21/2012 6/26/2012 7/1/2012 7/6/2012
Date and time (LT)
80
60
40
20
0
(a)
(b)
Period A Period B Period C Period D
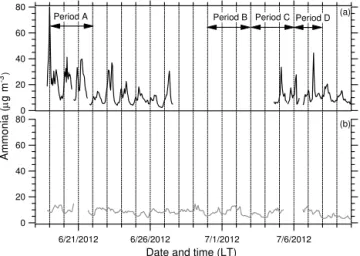
Figure 13.Time series of hourly averaged ammonia observed at
(a)SPC and(b)Bologna. The dashed lines indicate midnight local
time (UTC+2). Periods A, B, C, and D are also indicated.
other periods is meteorology. Period A featured an anticy-clonic condition that led to air stagnation; the other periods featured stronger transport and ventilation. Therefore, during Periods B, C, and D intermediate products that are needed to form appreciable concentrations of aqSOA are less likely to quickly accumulate in the local boundary layer.
It is possible that another key ingredient in the chemistry is ammonia. Recent studies have suggested possible aqSOA formation processes mediated by ammonia and other atmo-spheric bases (Galloway et al., 2009; Nozière et al., 2009; Ortiz-Montalvo et al., 2014; Yu et al., 2011). Ammonia is prevalent in the Po Valley due to agricultural activities. Dur-ing Period A, high ammonia concentrations (greater than
∼30 µg m−3)were observed only at SPC (Fig. 13a).
Overall, the data suggest that local aqSOA production dur-ing the stagnation of Period A is not due to cloud processdur-ing. Our results also suggest that this aqueous chemistry occurs in the dark, which likely provides the favorable low tem-peratures and high RH for nitrate aerosol and ALW (Ho-das et al., 2014). Based on other measurements at SPC, the stagnation conditions and elevated nitrate around midnight occurred each day from 14 June through 23 June, suggest-ing that the local aqSOA formation actually commenced 5 days earlier. When all these conditions were met, each day
∼1 µg C m−3 of new WSOC (determined as the change in
WSOC concentration during the times of RH increasing) can be attributed to this process.
4 Summary
Measurements were conducted during the PEGASOS study in the Po Valley of Italy during June and July 2012 in San Pietro Capofiume (SPC). The goal was to look for evidence of aqSOA in the ambient atmosphere. Measurements
cluded near-real-time WSOC (a good proxy for SOA), in-organic anions/cations, and in-organic acids. The data were an-alyzed in terms of the times when RH increased from 40 to 70 % (times of RH increasing) and then when the RH de-creased from 70 back to 40 % (times of RH decreasing) in order to diminish influences from dilution and mixing on am-bient measurements. The analysis focused on four periods: Period A on 19–21 June, Period B on 30 June, 1–2 July, Pe-riod C on 3–5 July, and PePe-riod D on 6–7 July.
Evidence for local aqSOA formation in wet aerosols was observed during Period A. When this occurred there was a correlation of WSOC with OA, ALW, RH, and nitrate. Addi-tionally, this was only observed during times of RH increas-ing, suggesting the aqSOA was formed in the dark. The aq-SOA formation is thought to be local because elevated ni-trate, the driver for aerosol water, was only observed at the main ground site in SPC even though the auxiliary site in Bologna was sampling similar upwind air masses at the time. A comparison of Periods A and C suggested Period C differed from Period A. The WSOC during Period C was likely formed regionally. Interestingly, during Period C as well as Period A, a correlation was found between oxalate and sulfate. This suggests that oxalate concentrations were not strongly affected by local aqSOA formation. More im-portantly, it indicates that oxalate is not a good universal marker for aqSOA.
A comparison of WSOC with the AMS PMF OOA factors showed that Period A featured high O/C ratios, consistent
with aqSOA formation. However, they also reinforce the con-clusion that the composition of the WSOC differed between the two halves of the study. Periods A and C were dominated by two different OOA factors, OOA-2 (locally produced) and OOA-4 (long-range transported), respectively.
Overall, by examining the conditions observed in Period A, the data suggest that the local aqSOA formation observed is not due to cloud processing and occurs in the dark. The timing of elevated nitrate concentrations is critical (around midnight local time) to provide the liquid water reservoir needed for aqueous chemistry. Approximately 1 µg C m−3of
new WSOC was formed through this process each day these conditions were met, indicating the importance of aqSOA as a source of ambient OA in this region.
5 Data availability
The data are available by request from the individual re-search groups contributing to this work. PILS data are from A. P. Sullivan, AMS data are from L. Poulain, glyoxal data are from K. Skog/F. Keutsch, MARGA data are from E. Nemitz/M. M. Twigg, and meteorological data are from S. Decesari.
The Supplement related to this article is available online at doi:10.5194/acp-16-8095-2016-supplement.
Acknowledgements. We acknowledge funding from the National
Science Foundation under projects AGS-1050052, AGS-1052611, and AGS-1051338. Measurements at SPC were also funded by the European Union FP7 project PEGASOS (FP7-ENV-2010/265148) and by the Regione Emilia Romagna (project SUPERSITO DRG no. 428/10). The authors thank the European Union FP7 ÉCLAIRE (FP7-ENV-2011/282910) project for funding the ammonia measurements in Bologna, the Energy Research Centre of the Netherlands (ECN) for providing the MARGA instrument at SPC, and C. DiMarco, M. Blom, S. Leeson, T. Hutchings, C. Braban, and L. Giulianelli for supporting the ammonia mea-surements. The authors gratefully acknowledge the NOAA Air Resources Laboratory (ARL) for the provision of the HYS-PLIT transport and dispersion model and/or READY website (http://www.arl.noaa.gov/ready.html) used in this publication.
Edited by: R. McLaren
References
Aiken, A. C., DeCarlo, P. F., Kroll, J. H., Worsnop, D. R., Huff-man, J. A., Docherty, K. S., Ulbrich, I. M., Mohr, C., Kim-mel, J. R., Sueper, D., Sun, Y., Zhang, Q., Trimborn, A., North-way, M., Ziemann, P. J., Canagaratna, M. R., Onasch, T. B., Al-farra, M. R., Prévôt, A. S., Dommen, J., Duplissy, J., Metzger, A., Baltensperger, U., and Jimenez, J. L.: O/C and OM/OC ra-tios of primary, secondary, and ambient organic aerosols with high-resolution time-of-flight aerosol mass spectrometry, Envi-ron. Sci. Technol., 42, 4478–4485, 2008.
Altieri, K. E., Carlton, A. G., Lim, H.-J., Turpin, B. J., and Seitzinger, S. P.: Evidence for oligomer formation in clouds: Re-actions of isoprene oxidation products, Environ. Sci. Technol., 40, 4956–4960, 2006.
Altieri, K., Seitzinger, S. P., Carlton, A. G., Turpin B. J., Klein, G. C., and Marshall, A. G.: Oligomers formed through in-cloud methylglyoxal reactions: Chemical composition, properties, and mechanisms investigated by ultra-high resolution FT-ICR Mass Spectrometry, Atmos. Environ., 42, 1476–1490, 2008.
Blando, J. D. and Turpin, B. J.: Secondary Organic Aerosol For-mation in Cloud and Fog Droplets: A Literature Evaluation of Plausibility, Atmos. Environ., 34, 1623–1632, 2000.
Canagaratna, M. R., Jayne, J. T., Jimenez, J. L., Allan, J. D., Al-farra, M. R., Zhang, Q., Onasch, T. B., Drewnick, F., Coe, H., Middlebrook, A., Delia, A., Williams, L. R., Trimborn, A. M., Northway, M. J., DeCarlo, P. F., Kolb, C. E., Davidovits, P., and Worsnop, D. R.: Chemical and Microphysical Characterization of Ambient Aerosols with the Aerodyne Aerosol Mass Spec-trometer, Mass Spectrom. Rev., 26, 185–222, 2007.
Canonaco, F., Crippa, M., Slowik, J. G., Baltensperger, U., and Prévôt, A. S. H.: SoFi, an IGOR-based interface for the efficient use of the generalized multilinear engine (ME-2) for the source apportionment: ME-2 application to aerosol mass spectrome-ter data, Atmos. Meas. Tech., 6, 3649–3661, doi:10.5194/amt-6-3649-2013, 2013.
Carlton, A. G., Turpin, B. J., Altieri, K. E., Reff, A., Seitzinger, S., Lim, H., and Ervens, B.: Atmospheric oxalic acid and SOA production from glyoxal: Results of aqueous photooxidation ex-periments, Atmos. Environ., 41, 7588–7602, 2007.
DeCarlo, P. F., Kimmel, J. R., Trimborn, A., Northway, M. J., Jayne, J. T., Aiken, A. C., Gonin, M., Fuhrer, K., Horvath, T., Docherty, K. S., Worsnop, D. R., and Jimenez, J. L.: Field-Deployable, High-Resolution, Time-of-Flight Aerosol Mass Spectrometer, Anal. Chem., 78, 8281–8289, 2006.
de Gouw, J. A., Middlebrook, A. M., Warneke, C., Goldan, P. D., Kuster, W. C., Roberts, J. M., Fehsenfeld, F. C., Worsnop, D. R., Canagaratna, M. R., Pszenny, A. A. P., Keene, W. C., Marchewka, M., Bertman, S. B., and Bates, T. S.: Budget of or-ganic carbon in a polluted atmosphere: Results from the New England Air Quality Study in 2002, J. Geophys. Res., 110, D16305, doi:10.1029/2004JD005623, 2005.
de Haan, D. O., Corrigan, A. L., Tolbert, M. A., Jimenez, J. L., Wood, S. E., and Turley, J. J.: Secondary organic aerosol forma-tion by self-reacforma-tion of methylglyoxal and glyoxal in evaporating droplets, Environ. Sci. Technol., 43, 8184–8190, 2009.
Draxler, R. R. and Rolph, G. D.: HYSPLIT (HYbrid Single-Particle Lagrangian Integrated Trajectory) Model access via NOAA ARL READY Website, available at: http://www.arl.noaa.gov/ready/ hysplit4.html (last access: 5 August 2013), NOAA Air Resources Laboratory, Silver Spring, MD, 2013.
Drewnick, F., Hings, S. S., DeCarlo, P., Jayne, J. T., Gonin, M., Fuhrer, K., Weimer, S., Jimenez, J. L., Demerjian, K. L., Bor-rmann, S., and Worsnop, D. R.: A New Time-of-Flight Aerosol Mass Spectrometer (TOF-AMS) – Instrument Description and First Field Deployment, Aerosol Sci. Tech., 39, 637–658, 2005. Eatough, D. J., Wadsworth, A., Eatough, D. A., Crawford, J. W.,
Hansen, L. D., and Lewis, E. A.: A multiple system, multi-channel diffusion denuder sampler for the determination of fine-particulate organic material in the atmosphere, Atmos. Environ. A-Gen., 27, 1213–1219, 1993.
El-Sayed, M. M. H., Wang, Y., and Hennigan, C. J.: Direct atmo-spheric evidence for the irreversible formation of aqueous sec-ondary organic aerosol, Geophys. Res. Lett., 42, 5577–5586, doi:10.1002/2015GL064556, 2015.
Erisman, J. W., Otjes, R., Hensen, A., Jongejan, P., van den Bulk, P., Khlystov, A., Möls, H., and Slanina, S.: Instrument development and application in studies and monitoring of ambient ammonia, Atmos. Environ., 35, 1913–1922, 2001.
Ervens, B. and Volkamer, R.: Glyoxal processing by aerosol multi-phase chemistry: towards a kinetic modeling framework of sec-ondary organic aerosol formation in aqueous particles, Atmos. Chem. Phys., 10, 8219–8244, doi:10.5194/acp-10-8219-2010, 2010.
Ervens, B., Turpin, B. J., and Weber, R. J.: Secondary or-ganic aerosol formation in cloud droplets and aqueous parti-cles (aqSOA): a review of laboratory, field and model stud-ies, Atmos. Chem. Phys., 11, 11069–11102, doi:10.5194/acp-11-11069-2011, 2011.
Facchini, M. C., Fuzzi, S., Zappoli, S., Andracchio, A, Gelencsér, A., Kiss, G., Krivácsy, Z., Mészáros, E., Hansson, H. C., Alsberg, T., and Zebühr, Y.: Partitioning of the organic aerosol component between fog droplets and interstitial aerosol, J. Geophys. Res., 104, 26821–26832, 1999.
A. P. Sullivan et al.: Evidence for ambient dark aqueous SOA formation 8107
Galloway, M. M., Chhabra, P. S., Chan, A. W. H., Surratt, J. D., Flagan, R. C., Seinfeld, J. H., and Keutsch, F. N.: Glyoxal up-take on ammonium sulphate seed aerosol: reaction products and reversibility of uptake under dark and irradiated conditions, At-mos. Chem. Phys., 9, 3331–3345, doi:10.5194/acp-9-3331-2009, 2009.
Gaston, C. J., Riedel, T. P., Zhang, Z., Gold, A., Surratt, J. D., and Thornton, J. A.: Reactive Uptake of an Isoprene-Derived Epoxy-diol to Submicron Aerosol Particles, Environ. Sci. Technol., 48, 11178–11186, 2014.
Heald, C. L., Jacob, D. J., Park, R. J., Russell, L. M., Huebert, B. J., Seinfeld, J. H., Liao, H., and Weber, R. J.: A large organic aerosol source in the free troposphere missing from current models, Geo-phys. Res. Lett., 32, L18809, doi:10.1029/2005GL023831, 2005. Hennigan, C. J., Bergin, M. H., Dibb, J. E., and Weber, R. J.: Enhanced secondary organic aerosol formation due to wa-ter uptake by fine particles, Geophys. Lett. Res., 35, L18801, doi:10.1029/2008GL035046, 2008.
Hodas, N., Sullivan, A. P., Skog, K., Keutsch, F. N., Collett Jr., J. L., Decesari, S., Facchini, M. C., Carlton, A. G., Laaksonen, A., and Turpin, B. J.: Aerosol liquid water driven by anthro-pogenic nitrate: implications for lifetimes of water-soluble or-ganic gases and potential for secondary aerosol formation, Envi-ron. Sci. Technol., 48, 11127–11136, 2014.
Huisman, A. J., Hottle, J. R., Coens, K. L., DiGangi, J. P., Gal-loway, M. M., Kammrath, A., and Keutsch, F. N.: Laser-Induced Phosphorescence for the in Situ Detection of Glyoxal at Part per Trillion Mixing Ratios, Anal. Chem., 80, 5884–5891, 2008. Kanakidou, M., Seinfeld, J. H., Pandis, S. N., Barnes, I., Dentener,
F. J., Facchini, M. C., Van Dingenen, R., Ervens, B., Nenes, A., Nielsen, C. J., Swietlicki, E., Putaud, J. P., Balkanski, Y., Fuzzi, S., Horth, J., Moortgat, G. K., Winterhalter, R., Myhre, C. E. L., Tsigaridis, K., Vignati, E., Stephanou, E. G., and Wilson, J.: Organic aerosol and global climate modelling: a review, At-mos. Chem. Phys., 5, 1053–1123, doi:10.5194/acp-5-1053-2005, 2005.
Kondo, Y., Miyazaki, Y., Takegawa, N., Miyakawa, T., Weber, R. J., Jimenez, J. L., Zhang, Q., and Worsnop, D. R.: Oxygenated and water-soluble organic aerosols in Tokyo, J. Geophys. Res., 112, D01203, doi:10.1029/2006JD007056, 2007.
Lambe, A. T., Onasch, T. B., Massoli, P., Croasdale, D. R., Wright, J. P., Ahern, A. T., Williams, L. R., Worsnop, D. R., Brune, W. H., and Davidovits, P.: Laboratory studies of the chemical composi-tion and cloud condensacomposi-tion nuclei (CCN) activity of secondary organic aerosol (SOA) and oxidized primary organic aerosol (OPOA), Atmos. Chem. Phys., 11, 8913–8928, doi:10.5194/acp-11-8913-2011, 2011.
Lee, A. K. Y., Hayden, K. L., Herckes, P., Leaitch, W. R., Lig-gio, J., Macdonald, A. M., and Abbatt, J. P. D.: Characteri-zation of aerosol and cloud water at a mountain site during WACS 2010: secondary organic aerosol formation through ox-idative cloud processing, Atmos. Chem. Phys., 12, 7103–7116, doi:10.5194/acp-12-7103-2012, 2012.
Lee, A. K. Y., Zhao, R., Gao, S. S., and Abbatt, J. P. D.: Aqueous-phase OH Oxidation of Glyoxal: Application of a Novel Analyt-ical Approach Employing Aerosol Mass Spectrometry and Com-plementary Off-Line Techniques, J. Phys. Chem. A, 115, 10517– 10526, doi:10.1021/jp204099g, 2011.
Lim, Y. B., Tan, Y., Perri, M. J., Seitzinger, S. P., and Turpin, B. J.: Aqueous chemistry and its role in secondary organic aerosol (SOA) formation, Atmos. Chem. Phys., 10, 10521– 10539, doi:10.5194/acp-10-10521-2010, 2010.
Miyazaki, Y., Kondo, Y., Takegawa, N., Komazaki, Y., Kawamura, K., Mochida, M., Okuzawa, K., and Weber, R. J.: Time-resolved measurements of water-soluble organic carbon in Tokyo, J. Geo-phys. Res., 111, D23206, doi:10.1029/2006JD007125, 2006. Monge, M. E., Rosenørn, T., Favez, O., Müller, M., Adler, G., Riziq,
A. A., Rudich, Y., Herrmann, H., George, C., and D’Anna, B.: Alternative pathway for atmospheric particles growth, P. Natl. Acad. Sci., 109, 6840–6844, doi:10.1073/pnas.1120593109, 2012.
Nguyen, T. B., Lee, P. B., Updyke, K. M., Bones, D. L., Laskin, J., Laskin, A., and Nizkorodov, S. A.: Formation of nitrogen-and sulfur-containing light-absorbing compounds accelerated by evaporation of water from secondary organic aerosols, J. Geophy. Res., 117, D01207, doi:10.1029/2011JD016944, 2012.
Nozière, B., Dziedzic, P., and Córdova, A.: Products and Kinetics of the Liquid-Phase Reaction of Glyoxal Catalyzed by Ammonium
Ions (NH+
4), J. Phys. Chem. A, 113, 231–237, 2009.
Orsini, D. A., Ma, Y., Sullivan, A., Sierau, B., Baumann, K., and Weber, R. J.: Refinements to the particle-into-liquid sampler (PILS) for ground and airborne measurements of water-soluble aerosol composition, Atmos. Environ., 37, 1243–1259, 2003. Ortiz-Montalvo, D. L., Häkkinen, S. A. K., Schwier, A. N., Lim, Y.
B., McNeill, V. F., and Turpin, B. J.: Ammonium Addition (and Aerosol pH) Has a Dramatic Impact on the Volatility and Yield of Glyoxal Secondary Organic Aerosol, Environ. Sci. Technol., 48, 255–262, 2014.
Paatero, P.: The multilinear engine – A table-driven, least squares program for solving multilinear problems, including the n-way parallel factor analysis model, J. Comput. Graph. Stat., 8, 854– 888, 1999.
Perri, M. J., Lim, Y. B., Seitzinger, S. P., and Turpin, B. J.: Organosulfates from glycolaldehyde in aqueous aerosols and clouds: Laboratory studies, Atmos. Environ., 44, 2658–2664, 2010.
Rolph, G. D.: Real-time Environmental Applications and Display sYstem (READY) Website, available at: http://www.arl.noaa. gov/ready/hysplit4.html (last access: 5 August 2013), NOAA Air Resources Laboratory, Silver Spring, MD, 2013.
Seinfeld, J. H. and Pandis, S. N.: Atmospheric Chemistry and Physics: From Air Pollution to Climate Change, John Wiley, Hoboken, NJ, 2006.
Seinfeld, J. H. and Pankow, J. F.: Organic atmospheric particulate material, Annu. Rev. Phys. Chem., 54, 121–140, 2003.
Sorooshian, A., Murphy, S. M., Hersey, S., Bahreini, R., Jons-son, H., Flagan, R. C., and Seinfeld, J. H.: Constraining the
contribution of organic acids and AMSm/z44 to the organic
aerosol budget: On the importance of meteorology, aerosol hygroscopicity, and region, Geophys. Res. Lett., 37, L21807, doi:10.1029/2010GL044951, 2010.
Sullivan, A. P., Weber, R. J., Clements, A. L., Turner, J. R., Bae, M. S., and Schauer, J. J.: A method for on-line measurement of water-soluble organic carbon in ambient aerosol particles: Re-cent results from an urban site, Geophys. Res. Lett., 31, L13105, doi:10.1029/2004GL019681, 2004.
Sullivan, A. P., Peltier, R. E., Brock, C. A., de Gouw, J. A., Hol-loway, J. S., Warneke, C., Wollny, A. G., and Weber, R. J.: Air-borne measurements of carbonaceous aerosol soluble in water over northeastern United States: Method development and an in-vestigation into water-soluble organic carbon sources, J. Geo-phys. Res., 111, D23S46, doi:10.1029/2006JD007072, 2006. Sun, Y. L., Zhang, Q., Anastasio, C., and Sun, J.: Insights into
sec-ondary organic aerosol formed via aqueous-phase reactions of phenolic compounds based on high resolution mass spectrom-etry, Atmos. Chem. Phys., 10, 4809–4822, doi:10.5194/acp-10-4809-2010, 2010.
Tan, Y., Perri, M. J., Seitzinger, S. P., and Turpin, B. J.: Effects of Precursor Concentration and Acidic Sulfate in Aqueous Glyoxal-OH Radical Oxidation and Implications for Secondary Organic Aerosol, Environ. Sci. Technol., 43, 8105–8112, 2009.
Tan, Y., Carlton, A. G., Seitzinger, S. P., and Turpin, B. J.: SOA from Methylglyoxal in Clouds and Wet Aerosols: Measurement and Prediction of Key Products, Atmos. Environ., 44, 5218–5226, 2010.
Tan, Y., Lim, Y. B., Altieri, K. E., Seitzinger, S. P., and Turpin, B. J.: Mechanisms leading to oligomers and SOA through aque-ous photooxidation: insights from OH radical oxidation of acetic acid and methylglyoxal, Atmos. Chem. Phys., 12, 801–813, doi:10.5194/acp-12-801-2012, 2012.
ten Brink, H., Otjes, R., Jongejan, P., and Slanina, S.: An instrument for semi-continuous monitoring of the size-distribution of nitrate, ammonium, sulphate and chloride in aerosol, Atmos. Environ., 41, 2768–2779, 2007.
Timonen, H., Carbone, S., Aurela, M., Saarnio, K., Saarikoski, S., Ng, N. L., Canagaratna, M. R., Kulmala, M., Kerminen, V.-M., Worsnop, D. R., and Hillamo, R.: Characteristics, sources and water-solubility of ambient submicron organic aerosol in spring-time in Helsinki, Finland, J. Aerosol Sci., 56, 61–77, 2013. Wexler, A. S. and Clegg, S. L.: Atmospheric aerosol
mod-els for systems including the ions H+, NH+
4, Na+, SO−42,
NO−
3, Cl−, Br−, and H2O, J. Geophys. Res., 107, 4207,
doi:10.1029/2001JD000451, 2002.
Yu, G., Bayer, A. R., Galloway, M. M., Korshavn, K. J., Fry, C. G., and Keutsch, F. N.: Glyoxal in Aqueous Ammonium Sulfate Solutions: Products, Kinetics, and Hydration Effects, Environ. Sci. Technol., 45, 6336–6342, 2011.
Yu, J. Z., Huang, X. H. H., Xu, J., and Hu, M.: When aerosol sulfate goes up, so does oxalate: Implications for the formation mecha-nisms of oxalate, Environ. Sci. Technol., 39, 128–133, 2005. Zhang, X., Liu, J., Parker, E. T., Hayes, P. L., Jimenez, J. L., de
Gouw, J. A., Flynn, J. H., Grossberg, N., Lefer B. L., and Weber, R. J.: On the gas-particle partitioning of soluble organic aerosol in two urban atmospheres with contrasting emissions: 1. Bulk water-soluble organic carbon, J. Geophys. Res., 117, D00V16, doi:10.1029/2012JD017908, 2012.