M
EAN RECEIVER POWER PREDICTION FOR INDOORS 802.11 WLANS
USING THE RAY TRACING TECHNIQUE
J. Sánchez, C. Castro & L. Villaseñor
Electronics and Telecommunications Department CICESE Research Center
Ensenada, Baja California C.P. 22860 MÉXICO
jasan@cicese.mx, temo_castro@hotmail.com, luisvi@cicese.mx
ABSTRACT
A technique for the modeling of wireless channels, namely the image ray tracing algorithm, is developed in this work to predict the local mean received power of a wireless local area network (WLAN) based on the
802.11a standard operating in the 5 GHz band. This technique has been enhanced in order to account for the propagation of the electromagnetic waves thru a wireless environment, including the absorption and reflection phenomenon at obstacles. The image ray tracing algorithm is used to calculate all the possible propagation paths between a radio transmitter and a receiver. The simulation results of the mean received power strength are compared against field measurements to validate the convenience of the simulation approach.
RESUMEN
En este artículo se presenta una técnica de modelado de canal radio para interiores que es utilizada para predicción de potencia en redes de área local inalámbricas (WLAN) 802.11a en la banda de los 5 GHz,
simulando los mecanismos de propagación de la onda electromagnética. La técnica utilizada para el modelado del canal radio es el trazado de rayos basado en imágenes, que calcula todas las trayectorias posibles desde el transmisor al receptor; en este trabajo se ha mejorado ésta técnica, al tomar en cuenta los fenómenos de reflexión y absorción de las ondas electromagnéticas por los obstáculos del ambiente de propagación. Los valores de potencia promedio obtenidos de las simulaciones son comparados contra mediciones realizadas en el sitio específico considerado, para validar la conveniencia del modelo de simulación.
KEYWORDS: Mobile communications, WLANs, IEEE 802.11, 4th Generation wireless networks, Wireless
channel model, Ray tracing.
1. INTRODUCTION
The deployment of wireless local area networks (WLANs, like the 802.11 and HiSWAN) in a large variety
of office, factory and residential environments has seen a great success in the last years. As a result, it is of great importance the employment of tools to allow for a better understanding of the radio propagation environment. One of the main requirements, in the design of a wireless network, is related to the knowledge of the radio coverage pattern of the access point (AP). The knowledge of the radio coverage
pattern of an AP will aid the network designer in the efficient implementation of a WLAN. Consequently,
the knowledge of the coverage area provided by the access point can be used to define the optimum number and location of the APs.
A large number of indoor wireless channel models have been described in the literature. Some of them are based on geometrical optics (ray tracing [1]-[5], tubes launching [6]), while other models are based on geometric probabilistic theory [7] and field measurements [8]. The use of field measurements,
33
although necessary to validate analytical methods, is expensive and difficult to implement for a large number of environments. On the other hand, analytical models provide an alternative and efficient way to predict the mean received power strength for a given wireless environment. In this way, a computer based tool can be designed and used to allow for an efficient design of a WLAN. This tool can be used to
optimize the wireless network design by allowing the network designer to modify a variety of parameters, e.g. distance and position of obstacles, the location of the AP or radio propagation characteristics.
The contribution of this work is the use of the ray tracing technique along with the radio propagation and the electromagnetic parameters of the obstacles to calculate the coverage of an 802.11 WLAN Access
Point (AP), in the 5 GHz band. With the aid of this simulation tool it is possible to generate coverage
maps of the local mean received power strength at a given site. One of the main goals of this work was to achieve an efficient tradeoff between the algorithm precision and the required computational time; the number of simulated reflections plays an important role on both factors during the optimization of a simulation tool [9], [10]. Up to a maximum of 3 reflections are considered in this work to reduce the computational load required by the simulation tool developed under Matlab.
A study is presented in this work to allow for the prediction of the radio coverage pattern of an AP, based
on the local mean received power strength, while accounting for the propagation channel impairments as the electromagnetic wave travels to a given destination. The prediction of the local mean received power strength is then used to determine the coverage area of an AP, thus, it is possible to determine the
minimum number of APs which are required to provide an optimum service for a given site.
This work is divided in five sections. Section 2 provides a description of the office environment and the simulation approach used in this work. Later, in Section 3, a description of the simulator model guidelines are presented. Section 4 presents the mean receiver power strength results obtained from simulation and from field measurements and Section 5 presents the conclusions of this work.
2. OFFICE ENVIRONMENT AND SIMULATION APPROACH
The objective of this work is the prediction of the radio coverage pattern of a WLAN Access Point over a
predefined area, taking into account the multipath propagation phenomena caused by the existence of
obstacles between a transmitter and several receivers. This information may be used by a WLAN
designer to predict the number of APs that are required to provide network coverage to a specific indoors
office environment.
To compare the range capabilities provided by an 802.11a device, a series of tests were conducted inside a building. The floor plan of the indoor environment used during the simulations is shown in figure 1. The model is represented by walls, doors, windows and a variety of obstacles which are denoted by lines. The ray tracing simulation tool accounts for the electromagnetic parameters (i.e. permittivity and conductivity) of a variety of common indoor items, such as, concrete walls, drywalls, windows and wood doors. In [11] a well-known internal multireflection model for transmission and reflection coefficients, which takes into account the width of the obstacle, was used to obtain the electromagnetic parameters in the 5 GHz band; in this work we make use of the permittivity and conductivity values for different materials as reported in [11].
34
Figure 1. Floor plan of the indoors office site.
2.1 SIMULATION APPROACH
This section describes the principles behind the development of the simulation model.
2.1.1. RAY TRACING ALGORITHM.
The first step of the image based ray tracing algorithm is to define the location of the transmitter (Tx), in our case the AP, and the location of the receiver (Rx) or the mobile node. Next, the algorithm constructs
a table with the information related to the environment obstacles, which also includes data related to the electromagnetic parameters of the obstacles. Figure 2 shows a model of a four wall environment; this model includes both the Tx and the Rx nodes.
Figure 2. A four wall sample model.
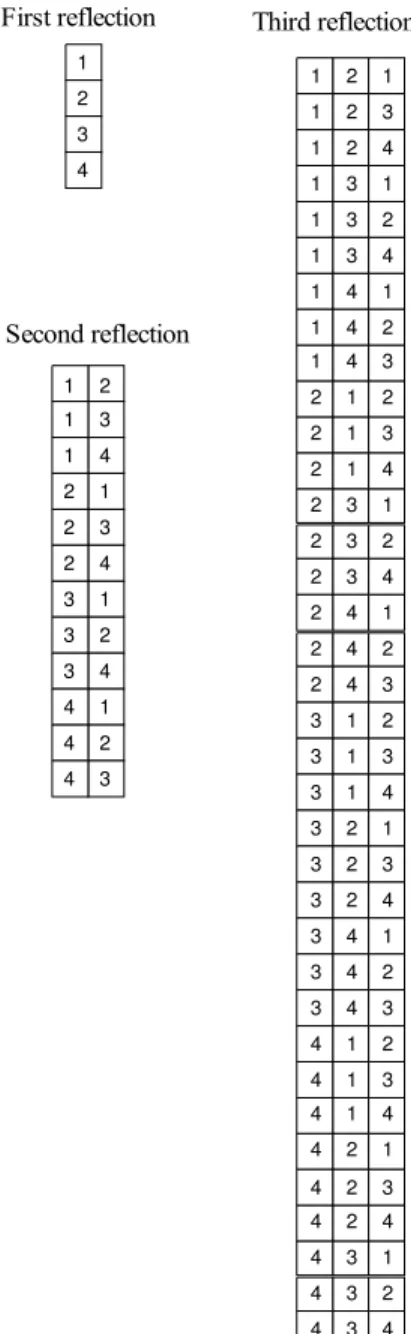
As part of the ray tracing method multiple images of the transmitter node are created at the surrounding walls. This is achieved within the simulation program by constructing an indexed image tree. Figure 3 shows the indexed image tree (for up to 2 reflections) generated for the four wall sample model shown in figure 2.
The image tree in figure 3 denotes the creation of images beginning with the first reflection over four possible walls; after the first reflection there are only 3 possible reflections for the second reflection branch. Figure 4 shows the ray tracing for the first image at wall 1, denoted by Im(w1), and for a second
image, denoted by Im(w1-3), at wall 3.
35
Figure 3. Example of an image trace tree for 4 walls and 2 reflections.
Figure 4. Image Im(w1), Im(w1-3) and ray tracing for a wave with two reflections.
Figure 5. Illuminated area generated by the image of Tx at wall 1.
The image tree denotes all the possible reflection patterns, however not all of them are physically feasible. To test the feasibility of all the possible reflections, certain criteria must be assessed. One condition is that the intersection between the ray trace and the wall or obstacle must fall within the so called “illuminated area”, as it is illustrated in figure 5. In this way the creation of ray traces is achieved for the indoors environment by considering all the feasible reflections and discarding all the non-feasible ones. The processing time required to predict the mean receiver power strength of an indoors environment follows a polynomial distribution as the number of walls or obstacles increases. This is
36
)
explained from the image tree diagram, which shows all the possible reflections at each wall in a given
indoors environment. The total number of ray traces that must be considered in a system with N
obstacles, considering up to M reflections, is given by:
1
0 1
_
(
1
i
M
i
N
Num rays
N
−
=
= +
∑
−
(1)or equivalently:
1 1
2
_
(
1)
M
N
N
Num rays= +
N
−−
⎡
⎤
⎣
−
⎦
(2)For a large number of obstacles N, expression (2) can be simplified to:
_ M
Num rays ≈
N
(3)The degree of the polynomial expression is equal to the maximum number of reflections considered for a given simulation.
2.1.2. REFLECTION AND TRANSMISSION COEFFICIENTS.
The next step is to determine the percentage of the signal strength that will make it thru an obstacle, as well as, the amount of signal strength that will be reflected from an obstacle. This is achieved by accounting for the electromagnetic parameters of the materials (i.e. the obstacles) at the operational frequency of an 802.11a wireless network (i.e. 5 GHz). For the purpose of this work, the electromagnetic parameters in Table 1 were obtained from [11].
Material
Relative Permittivity
{ }
Re
ε
rElectrical Conductivity
(
S m
/
)
σ
Drywall 2.02 0.00
Wood door 5.84 0.06
Glass 6.06 0.35
Concrete wall 4.53 0.20
Table 1. Electrical properties of obstacles.
37
The electrical conductivity and the relative permittivity, as well as the angle of arrival, are used in the simulation tool to calculate the reflected and transmitted wave strength at a given obstacle.
Figure 6. Arriving, reflected and transmitted waves.
It is assumed that the transmitted signal power (
P
tr) is equal to the incidence signal power (P
in ) minus the reflected signal power (P
ref) and there is no signal power absorption by the material; this is given by:tr in ref
P
=
P
−
P
(4)Figure 6 illustrates the reflection and transmission waves that result from the arrival of a radio wave to an obstacle.
2.1.2.1 REFLECTION
The computation of the reflection coefficients of the different materials is based on two mathematical expressions. The first one is used for the case of vertical polarization, while the second expression is used for the case of horizontal polarization.
The calculation of the reflection index is a function of the frequency, polarization and the angle of incidence of the radio wave. It is also a function of the electromagnetic parameters of the material, such as, the dielectric constant r and the conductivity .
For horizontal wave polarization, the reflection coefficient is given by [12]:
2
2
sin sin
cos
cos
r r
h
di l
i
ε
ε
ρ
Ψ − Ψ +− Ψ
− Ψ
=
(5)where:
ε
r is the relative dielectric constant,ψ
is the wave incidence angle (degrees).38
'
r
The relative dielectric constant can be evaluated by [12]:
' '
r r
j
ε
=
ε
−
ε
(6)where:
ε
r′
is the relative permitivity, and9 '' 0
18 10
rx
f
σ
σ
ε
ωε
=
=
(7)where:
σ
is the conductivity,ω
is the angular transmission frequency (2 f),ε
0 is the free-space dielectric constant.For vertical polarization [12], the reflection coefficient is given by:
2 2 sin sin cos cos r r r r v
ε
ε
ε
ε
ρ
Ψ −Ψ +
− Ψ − Ψ
=
(8)2.1.2.2 TRANSMISSION
A transmission occurs when an electromagnetic wave travels thru an obstacle. In this work it is assumed that the amount of energy that is transmitted thru an obstacle is equal to the amount of energy arriving to the obstacle minus the amount of energy that is reflected from the obstacle (i.e. the energy absorption by the material is not accounted for), as denoted in expression (4).
The transmission and reflection coefficients, which are calculated in the simulation tool, make use of the electromagnetic parameters (i.e. conductivity and permittivity) derived from [11]. The electromagnetic parameters in [11] take into account the multireflection in the slab of the material due to the operational frequency at 5 GHz of the 802.11a WLAN networks.
3. SIMULATION MODEL
The simulation model, in this work, is implemented by complying with the following guidelines:
Specify the location of obstacles (walls, doors, windows, etc.).
As it is shown in figure 1, the location of walls and doors, as well as their electromagnetic parameters, are an essential requirement for simulation. The simulation tool allows for the possibility of modifying a great variety of parameters in the indoors environment configuration file.
Specify the location of the transmitter and the receiver (Access Point and mobile node).
Once the location of the obstacles is defined, the next step is to specify the location of the AP as well as
the possible locations of the mobile node. Figure 8 shows all the possible locations of the mobile node, denoted by the symbol +. This diagram is called the receiver matrix.
39
Define the wall index for reflections.
The wall index is a variable used during simulation to preserve an order during the reflection and
transmission calculations. Figure 7 shows the wall index for 1, 2 and 3 reflections.
Define the image coordinate.
The ray tracing algorithm complies with Snell’s reflection law, in accordance with figure 6. To simplify the calculations during the simulation, the location of all the images are calculated for all the possible reflection cases, including 1, 2 or 3 reflections.
Feasibility check.
It should be noted that not all the reflections, illustrated in the indexed image tree, are physically feasible.
Then the non-feasible branches are eliminated from the indexed image tree to reduce the computational load during simulation.
Ray Tracing.
Ray traces are created, from the Access Point to all the possible mobile node locations, for all the physical feasible images.
Calculate radio wave power strength.
The radio wave power strength is calculated for each ray, accounting for the attenuation that the signal suffers between the Access Point and the mobile node.
Calculate the mean arrival power strength for all the possible locations of the mobile node.
The mean arrival power strength is calculated, based on the power strength of all the ray traces that converge on a given point within the reception matrix diagram.
Generate a power strength, coverage and contour maps.
A graphical representation of the mean arrival power strength is presented. These results are illustrated in figures 9 thru 12.
4. SIMULATION AND MEASUREMENT RESULTS
The simulation results of the indoors wireless channel illustrate the power strength coverage of a wireless local area network. The main contribution of this work is the development of a simulation tool that can be used in the prediction of the power strength distribution within an office indoors environment of an 802.11a based wireless network.
The indoors environment model is represented by a receiver matrix diagram, shown in figure 8. The receiver matrix diagram is composed of obstacles and a mesh of + symbols which are used to denote the possible locations of a mobile node within the indoors environment.
40
First reflection Second reflection Third reflection 1 2 3 4 2 3 4 1 3 4 1 2 4 1 2 3 1 1 1 2 2 2 3 3 3 4 4 4 2 1 2 1 2 1 3 1 3 1 3 1 4 1 4 1 4 1 1 2 1 2 1 2 3 2 3 2 3 2 4 2 4 2 4 2 1 3 1 3 1 3 2 3 2 3 2 3 4 3 4 3 4 3 1 4 1 4 1 4 2 4 2 4 2 4 3 4 3 4 3 4 1 3 4 1 2 4 1 2 3 2 3 4 1 2 4 1 2 3 2 3 4 1 3 4 1 2 3 2 3 4 1 3 4 1 2 4
Figure 7. An example of a wall indexed table for 1, 2 and 3 reflections.
The simulation results are evaluated for two different scenarios. The first scenario assumes that the access point is located in the hallway. While the second scenario assumes that the access point is located inside an office. This arrangement is presented to devise the implications of positioning the AP in the hallway, as opposed to locating the AP within an enclosed area, such as an office. In this way, a designer of a WLAN can optimize the design of the wireless network by taking into account the users requirements and the conditions of the indoors environment.
41
- 0
- 5
- 10
- 15
- 20
- 25
- 30
- 35
0 5 10 15 20 25 30
Figure 8. A receiver matrix diagram for an indoors office environment.
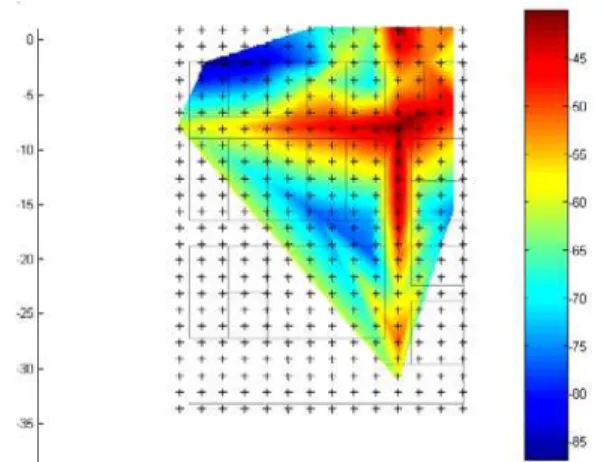
Figure 9 shows the mean receiver power strength distribution, derived under simulation, for the scenario with the AP located in the hallway. While figure 10 shows the mean receiver power strength distribution for the scenario with the AP inside an office.
Mts. Mts.
Mts. Mts.
Figure 9. Simulated mean receiver power strength with the AP located in the hallway.
To facilitate the comparison between simulated and measured receiver power strength values, it is useful to represent the simulated results using contour maps. Figures 11 and 12 show the contour maps of the mean receiver power strength for the two scenarios: AP located in the hallway and AP located inside an office, respectively.
42
Mts. Mts.
Mts. Mts.
Figure 10. Simulated mean receiver power strength with the AP located inside an office.
From the simulation results presented in figures 9 to 12, it is clear that an improved propagation pattern is achieved by locating the AP in the hallway. The simulation results confirm that the local mean receiver strength is not degraded along the hallways, as they serve as an obstacle-free propagation path. An extra benefit of locating the AP in the hallway is that additional APs can be located along the hallway to provide an extended service set (ESS), therefore increasing the service area provided to the users of the WLAN.
Figure 11. Contour map of simulated mean received power (AP in the hallway).
Mts. Mts.
Mts. Mts.
43
Mts. Mts.
Mts. Mts.
Figure 12. Contour map of simulated mean received power (AP inside an office).
In addition to the simulation results, a number of measurements were obtained for the scenario with the AP located in the hallway. The measurement values of the mean receiver power strength were obtained with the aid of the Network Stumbler software [13]. The measurement results were derived by obtaining an average of 200 samples for each possible location of the mobile node. The samples were obtained during an interval of 1 – 1.5 minutes (for each location), and an arithmetic average was calculated. Figure 13 shows the average measured values of the scenario with the AP located at the hallway.
It should be noted that the derivation of the measured values is complicated and not very reliable. For the acquisition of the measured values a laptop equipped with a WLAN adapter was used. The results obtained with the Network Stumbler software were highly dependable on a multitude of factors. For instance, different receiver power strength values were obtained by modifying the orientation of the laptop on a given location. Also, the location of the operator, relatively to the laptop, affected the results obtained by the program (since the operator itself is a moving obstacle). Because of all the previous issues it is highly recommended to use a fully automated system, such as the one described in [14], to reduce any possible errors introduced by external factors.
On the other hand, it is not entirely clear how the numerical values, presented by the Network Stumbler software, are derived. It is assumed that the Network Stumbler makes use of an application program interface (API) to access additional data from the WLAN interface. And therefore is not completely known how the power strength, reported by the WLAN, is derived or the accuracy of the reported value. In view of all these factors it is useful to make use of a simulation program to evaluate the local mean receiver power strength within an indoors environment.
44
Figure 13. Measured mean receiver power strength (AP in the hallway).
5. CONCLUSIONS
A simulation program was developed based on the ray tracing technique for the evaluation of an Access
Point coverage area of a WLAN based on the 802.11a standard. Power strength measurements were
obtained for an office indoor environment and were compared against the simulation results. It has been shown that the information obtained by the measured data is similar to that under simulation. In addition, it has been shown that the electrical properties of the materials (i.e. obstacles) play a major role during simulation. Thus the importance of using the correct dielectric constants values of the materials. On the other hand, based on the indoor office environment measurements, the calculated (i.e. under simulation) mean receiver power strength is similar to that of the measured power strength at around -72 and -73 dBm.
The simulation program developed in this work can be used to determine the minimum number of Access Points required to provide coverage for an indoors environment. In addition, it is possible to evaluate a great variety of wireless channel conditions to calculate the mean receiver power strength distribution. This is useful to determine the location of the AP to comply with the coverage requirements
during the design of an indoors WLAN. The main contribution of this work consists in the development of
a simulation tool, which can be used to study and analyze an indoors wireless channel environment for operational frequencies similar to those used by the 802.11a standard (i.e., 5 GHz). It should be noted that the simulator makes use of the electromagnetic parameters of the materials, whereas other published works do not take this into account. Another contribution of this work consists on the description of the guideline required for the design of a simulation program using the ray tracing technique.
45
6. REFERENCES
[1] Cuiñas, I., Sánchez, M. G., de Haro, L. Ray Tracing Tools For Propagation Simulation; COST
action 256; Paper no. TD/256/99/25; April 2000.
[2] Laureson, D. I., McLaughlin, S., Sheikh, A. U. H. A Ray Tracing Approach To Channel Modeling
For The Indoor Environment; 43rd IEEE Vehicular Technology Conference; 1993; Secaucus,
New Jersey, US; pp. 246-249.
[3] Trueman, C. W., Panknys, R., Zhao, J., Davis, D., Segal, B. Ray Tracing Algorithm for Indoor
Propagation; Applied Computational Electro-magnetics Society; Proc 16th Annual Review of
Progress in Applied Computational Electro-magnetics; Monterey, CA.; March 2000; pp. 493-500.
[4] Valenzuela, R. A. A Ray Tracing Approach to Predicting Wireless Transmission; 43rd IEEE
Vehicular Technology Conference 1993 VTC 93; Secaucus, New Jersey, US.
[5] Wöfle, G., Hoppe, R., Landstorfer, F. M., A Fast and Enhanced Ray Optical Propagation Model
for Indoor Urban Scenarios, Based on an Intelligent Preprocessing of the Database; 10th IEEE
International Symposium on Personal, Indoor and Mobile Radio Communications 1999 (PIMRC’99); Osaka, Japan.
[6] Flores, S. J., Mayorgas, L. F., Jiménez, F. A. Reception Algorithms For Ray Launching
Modeling Of Indoor Propagation; IEEE Radio and Wireless Conference, RAWCON’98; 1998.
Colorado Springs, CO; pp.261-264
[7] Hassan-Ali, M., Pahlvan, K. A New Statistical Model For Site-Specific Indoor Radio Propagation
Prediction Based On Geometric Optics And Geometric Probability; IEEE Transactions on
Wireless Communications; Vol.1; No.1; 2002. pp. 112-124.
[8] Neskovic A., Neskovic, N., , G. Modern Approaches In Modeling Of Mobile Radio Systems
Propagation Environment; IEEE Communications Surveys; Vol.3; 2000; pp. 2-12.
[9] Fortune, S. Efficient Algorithms For Prediction Of Indoor Radio Propagation; Proceedings of 48th
IEEE Vehicular Technology Conference 1998; Ottawa, Ontario, Canada.
[10] Valenzuela, R. A., Fortune, S., Ling, J. Indoor Propagation Prediction Accuracy Versus Number
of Reflections in Image-Based 3-D Ray-Tracing; 48th IEEE Vehicular Technology Conference,
1998 VTC 98.; Ottawa, Ontario, Canada;1998; pp. 539-543.
[11] Cuiñas, I., García, S. M. Measurement, Modeling, And Characterizing Of Indoor Radio Channel At 5.8 GHz.; IEEE Transactions on Vehicular Technology; Vol. 50; No. 2; 2001; pp. 526-535.
[12] Vaughn R., and Andersen J. B. Channels, Propagation and Antennas for Mobile
Communications, IEEE 2003.
[13] http://www.netstumbler.com
14] Hills, A., Schlegel, J. Rollabout: A Wireless Design Tool; IEEE Communications Magazine; Vol.
42; No. 2; 2004; pp. 132-138.
46
Authors Biography
Jaime Sánchez-García
Received the Engineering degree in Electronics and Communications from IPN-ESIME, Mexico (1976); a M.Sc. In Electronics and Telecommunications from CICESE Mexico (1979) and the D.Sc. In Electrical Engineering (major in Communications) from The George Washington University (2001). Since 1979, he holds a research and faculty position at CICESE's Electronics and Telecommunications Department. He won the 1st place in III Ericsson Yearly Award (1988) in México. His publications include several IEEE
articles and international conferences. Current research interests include wireless and sensor networks, software radio, radio channel modelling and multicarrier CDMA. He is an IEEE and a IEICE member.
Cuauhtémoc Castro-Inzunza
Received an Engineering degree in Electronics from Instituto Tecnológico de Hermosillo (ITH) in 2001, and an M.Sc. In Electronics and Telecommunications from CICESE, Ensenada Mexico in 2003. Current research interests include 4 th generation wireless networks, channel modeling and channel coding. Nowadays working in a manufacturing site for a CDMA cell phone.
47
Luis Villaseñor-Gonzalez
Received his PhD in Electrical Engineering from the University of Ottawa in 2002. He is currently a Research Associate Professor at the CICESE Research Center. He collaborated as a Network Research Engineer at the Communications Research Centre in Ottawa, Canada. At CRC he was involved in a variety of research activities in network technologies for the Government of Canada between 1999 and 2003. His current research interests include Mobile Ad-hoc networks, wireless communications networks, QoS protocol architectures, performance analysis and evaluation of Internet technologies and computer networks.
48