www.atmos-meas-tech.net/6/1707/2013/ doi:10.5194/amt-6-1707-2013
© Author(s) 2013. CC Attribution 3.0 License.
Atmospheric
Measurement
Techniques
Geoscientiic
Geoscientiic
Geoscientiic
Geoscientiic
Evaluation of the Lidar/Radiometer Inversion Code (LIRIC) to
determine microphysical properties of volcanic and desert dust
J. Wagner1, A. Ansmann1, U. Wandinger1, P. Seifert1, A. Schwarz1, M. Tesche2, A. Chaikovsky3, and O. Dubovik4
1Leibniz Institute for Tropospheric Research, Leipzig, Germany
2Department of Environmental Science, Stockholm University, Stockholm, Sweden 3Institute of Physics, National Academy of Science, Minsk, Belarus
4Laboratory of Atmospheric Optics, Lille University 1, Villeneuve d’Ascq, France Correspondence to:A. Ansmann ([email protected])
Received: 18 December 2012 – Published in Atmos. Meas. Tech. Discuss.: 25 January 2013 Revised: 13 June 2013 – Accepted: 13 June 2013 – Published: 22 July 2013
Abstract. The Lidar/Radiometer Inversion Code (LIRIC) combines the multiwavelength lidar technique with sun/sky photometry and allows us to retrieve vertical profiles of par-ticle optical and microphysical properties separately for fine-mode and coarse-fine-mode particles. After a brief presentation of the theoretical background, we evaluate the potential of LIRIC to retrieve the optical and microphysical properties of irregularly shaped dust particles. The method is applied to two very different aerosol scenarios: a strong Saharan dust outbreak towards central Europe and an Eyjafjallaj¨okull vol-canic dust event. LIRIC profiles of particle mass concentra-tions for the coarse-mode as well as for the non-spherical par-ticle fraction are compared with results for the non-spherical particle fraction as obtained with the polarization-lidar-based POLIPHON method. Similar comparisons for fine-mode and spherical particle fractions are presented also. Acceptable agreement between the different dust mass concentration profiles is obtained. LIRIC profiles of optical properties such as particle backscatter coefficient, lidar ratio, ˚Angstr¨om ex-ponent, and particle depolarization ratio are compared with direct Raman lidar observations. Systematic deviations be-tween the LIRIC retrieval products and the Raman lidar mea-surements of the desert dust lidar ratio, depolarization ratio, and spectral dependencies of particle backscatter and lidar ratio point to the applied spheroidal-particle model as main source for these uncertainties in the LIRIC results.
1 Introduction
The recent Icelandic volcanic eruptions in 2010 and 2011 emphasized the importance of remote-sensing methods that allow for the separation of fine-mode and coarse-mode par-ticles in the troposphere as a function of height (Ansmann et al., 2011a, 2012) in order to quantify particle mass con-centrations in lofted desert and volcanic dust layers. From the point of view of atmospheric research, there is a strong request for vertically resolved observations of optical and mi-crophysical properties of atmospheric aerosols in order to improve our understanding of direct and indirect effects of aerosols on climate-relevant processes. The aerosol influence can be very different in the polluted boundary layer and in the free troposphere due to different aerosol lifetimes, transport ways and ranges, and interaction with low, midlevel, and high clouds.
elastic-backscatter lidar return signals at 355, 532, and 1064 nm and, as a priori assumptions, AERONET photome-ter retrieval products (column-integrated particle size distri-butions, composition, complex refractive index, and particle shape) (Chaikovsky et al., 2008, 2012). Products of this syn-ergistic data analysis are height profiles of particle backscat-ter and extinction coefficients at the three wavelengths, and particle volume and mass concentration profiles separately for fine-mode and coarse-mode particles. The main goal of the LIRIC approach is to create a height-resolved data set of particle optical and microphysical properties that is in full agreement with the respective column-integrated find-ings from the sun/sky photometer observations. The method has been developed in a cooperation between the Institute of Physics Minsk (Belarus) and the Laboratoire d’Optique At-mosph´erique Lille (France) (Chaikovsky et al., 2008, 2012). The recently introduced Generalized Aerosol Retrieval from Radiometer and Lidar Combined Data (GARRLiC) (Lopatin et al., 2013) can be regarded as an extended version of LIRIC. The GARRLiC concept pursues an even deeper synergy of dar and radiometer data in the retrievals, e.g., by using the li-dar profile information to improve the AERONET retrievals. There have been similar attempts to combine passive spaceborne remote sensing of aerosols with lidar aerosol profiling. L´eon et al. (2003) and Kaufman et al. (2003a,b) combined lidar observations of height profiles of parti-cle backscattering with column-integrated spectral radiances measured with MODIS (Moderate Resolution Imaging Spec-troradiometer) to retrieve profiles of particle optical prop-erties that are consistent with the microphysical proper-ties from the MODIS observations. The third group of re-trieval methods to derive microphysical particle properties are solely based on multiwavelength lidar observations of particle extinction and backscatter coefficients (M¨uller et al., 1999; Veselovskii et al., 2002; B¨ockmann et al., 2005). Re-cently these inversion techniques were extended to cover also desert dust observations and dust/smoke/sulfate aerosol mix-tures (Veselovskii et al., 2010; M¨uller et al., 2013).
All these retrieval methods above are based on the assump-tion that the optical properties of the non-spherical, irregu-larly shaped coarse dust particles (desert dust, volcanic dust) can be sufficiently well described by assuming an ensemble of randomly oriented spheroidal dust particles with homo-geneous mineralogical composition throughout the dust par-ticle size distribution. However, prolate and oblate parpar-ticles of different size are only approximations of the true shape of mineral dust particles. The exact shape of the dust parti-cles cannot be described in this way. Ellipsoids have smooth surfaces, in contrast to the dust particles. Inclusions of var-ious minerals in the dust grains and heterogeneous chem-ical composition are also not accounted for (M¨uller et al., 2013). Gasteiger et al. (2011a) pointed out that in addition to the shape effects, the assumption on the mineralogical com-position (i.e., on the external and internal mixture of light-absorbing and non-light-absorbing dust particles) also have a very
sensitive influence on the backscattering efficiency of dust particles.
The concept of describing the non-spherical component as an ensemble of randomly oriented spheroids with size-independent aspect-ratio (length-to-width-ratio) distribution has been successfully employed in the operational retrieval algorithm of AERONET (Dubovik et al., 2006); however, the central question remains: is that model also appropriate for lidar applications that are based on backscattering by par-ticles at exactly 180◦ scattering angle? The lidar inversion
methods mentioned above were developed to retrieve mi-crophysical properties of spherical aerosol particles (urban haze, fire smoke). M¨uller et al. (2013) state that the main reason for not using the spheroidal-particle model for min-eral dust data is rooted in the poor understanding of how to describe the 180◦ light-scattering properties of particles of
irregular (non-spherical) shape. The authors further state that there is still a need for theoretical models that link specific features of a particle’s shape to its specific optical properties such as the measurable shape-sensitive particle extinction-to-backscatter ratio (lidar ratio) and the particle depolarization ratio. The lidar observations performed during the Saharan Mineral Dust Experiment (SAMUM) campaigns corroborate that the spheroidal-particle model may not be adequate for lidar applications (M¨uller et al., 2010, 2012; Ansmann et al., 2011b; Gasteiger et al., 2011a).
Here we investigate the potential of LIRIC to retrieve pro-files of desert and volcanic dust optical properties such as the lidar ratio and depolarization ratio as well as microphys-ical properties such as particle volume and mass concentra-tions. Fortunately, independent remote-sensing methods are available that enable us to directly and simultaneously mea-sure lidar ratio and depolarization ratio profiles by using the Raman/polarization lidar technique and to retrieve particle volume and mass concentrations of fine-mode and coarse-mode particles by means of the polarization lidar photome-ter network (POLIPHON) method (Ansmann et al., 2011a, 2012). These methods are also explained in Sect. 3. The POLIPHON technique is based on the measured height pro-file of the particle depolarization ratio to separate coarse dust from the residual aerosol particles, and does not make use of the spheroidal-particle model. However, the POLIPHON products contain uncertainties as well, especially for mixed aerosol cases, as will be discussed in Sect. 4.
2 Measurement systems
2.1 Raman lidar MARTHA
The multiwavelength Raman lidar MARTHA (Multiwave-length Atmospheric Raman lidar for Temperature, Humid-ity, and Aerosol profiling) is used for regular aerosol obser-vations at the EARLINET station of Leipzig (Mattis et al., 2004). It provides height profiles of particle backscatter and extinction coefficients, as well as lidar ratios and volume and particle depolarization ratios (Ansmann et al., 1992, 2011a). Because Raman lidar signals are used (in addition to elastic-backscatter signals), the method works best during darkness in the absence of strong sky background radiation. However, during events with optically dense aerosol layers, the Raman-lidar method can even be applied during daylight hours, as will be shown in Sect. 4.
For LIRIC, the elastically backscattered signals at the three transmitted wavelengths of 355, 532, and 1064 nm and the cross-polarized signal at 532 nm are used. LIRIC was originally designed for the analysis of lidar measurements at the three wavelengths of 355, 532, and 1064 nm. It has been extended to cover polarization lidar observations as well. MARTHA transmits linearly polarized laser light at 532 nm and has two channels to measure the cross-polarized lidar return signalP⊥(λ, z)(the polarization-sensitive filter ele-ment is aligned orthogonal to the plane of laser beam polar-ization) and the total (cross and parallel-polarized) backscat-ter lightP⊥(λ, z)+Pk(λ, z) with a second channel. From these signals the depolarization ratio (introduced in the next section) can be determined. Non-spherical particles such as desert or volcanic dust particles cause significant depolar-ization (a significant signalP⊥), whereas spherical particles
and even fine-mode urban haze particles produce almost no cross-polarized backscatter.
The Raman signals are not used in the LIRIC scheme. However, the products of the Raman lidar measurements (backscatter, extinction, lidar ratio, depolarization ratio) are used in the LIRIC validation study. A direct comparison be-tween the LIRIC and Raman lidar profiles provides the best opportunity to validate the LIRIC efforts.
For an optimum application of the LIRIC method, i.e., combining spectral tropospheric column with tropospheric profile information, it is necessary that the lidar covers al-most the entire tropospheric column (as seen by the photome-ter) with profile observations. However, the incomplete over-lap between the transmitted laser beams and the receiver field of view (RFOV) prohibits the measurement of reliable lidar return signals in the near range (usually up to a few 100 m; in the case of MARTHA up to a few kilometers because of the large telescope). The overlap function of our lidar is routinely and regularly determined and checked during clear nights with low aerosol amount by means of the method discussed by Wandinger and Ansmann (2002). The overlap profile is then applied to the aerosol lidar observations and allows us
to correct the overlap effect usually down to heights of 500– 1000 m above the lidar. Under favorable conditions (as for the Saharan dust case presented here), the overlap correction is reliable down to low minimum measurement heights of 150 m. Because the overlap effect may change from one to another lidar alignment, which is routinely done at the be-ginning of each long-lasting lidar measurement session, dif-ferent experimentally determined overlap profiles are used to check and quantify the impact of potential overlap uncertain-ties on the LIRIC retrieval accuracy.
2.2 Sun/sky photometer
LIRIC makes use of photometer-derived particle parame-ters that link the particle volume concentration to particle backscattering and extinction at 355, 532, and 1064 nm. The AERONET sun/sky photometers detect direct sun, aureole, and sky radiance (Holben et al., 1998). At the Leipzig sta-tion, direct sun radiation is measured in eight channels cen-tered at wavelengths of 339, 379, 441, 501, 675, 869, 940, 1021, and 1638 nm. Sky radiation is obtained in four bands centered at 441, 675, 869, and 1021 nm. From direct sun measurements the aerosol (particle) optical thickness (AOT) and the ˚Angstr¨om exponent that describes the AOT wave-length dependence is derived. Sun and sky radiance obser-vations are used for inversion algorithms to retrieve micro-physical aerosol properties such as the volume particle size distribution for fine and coarse mode (Dubovik and King, 2000; Dubovik et al., 2006). The AERONET data analysis code searches for the minimum in the bimodal particle vol-ume size distribution in the particle radius range of 0.194 to 0.576 µm. The found minimum is used as a separation radius between fine-mode and coarse-mode particles. The complex refractive index and the contribution of spherical particles to the fine-mode and coarse-mode particle fractions are determined in addition. The wavelength-dependent re-fractive index is the same for both fine and coarse particles. In summary, from the retrieved information, AOTs, particle-scattering phase functions, asymmetry parameters, and col-umn volume and surface-area concentrations of the particles are derived for spherical and non-spherical particles of the fine-mode and coarse-mode fractions (Dubovik et al., 2006). In cases without sky radiance observations, the AOTs and the column volume concentrations for fine and coarse mode are derived from the spectral dependence of measured AOT (O’Neill et al., 2003). The case studies in Sect. 4 are based on the Dubovik method.
without hyphens). These volume-specific backscatter and ex-tinction values are important input data for LIRIC.
The spheroidal-particle model as introduced by Dubovik et al. (2006) is successfully applied to the inversion of AERONET sun/sky photometer data to properly derive mi-crophysical properties of desert dust. However, the way the spheroidal-particle model influences the AERONET re-trievals of dust properties is quite different from the way the spheroidal-particle model influences lidar applications and therefore the LIRIC results. In the case of AERONET, the complete phase function is fitted to the almucantar sky-brightness data such that the phase function reproduces the almucantar data. In contrast, lidar backscatter data are rep-resentative of the sky brightness at just one scattering an-gle of exactly 180◦. Whether the spheroidal-particle model
is applicable to lidar observations remains an open ques-tion, as discussed in the introduction. Uncertainties in the estimation of volume-specific backscatter and extinction co-efficients, required for LIRIC, arise also from the fact that sun/sky photometer measurements of almucantar usually end at a 150◦scattering angle. The AERONET model was ex-tended to a phase function angle of 173◦on the basis of labo-ratory measurements of light scattering by dust (Volten et al., 2001). Direct observations of the sky brightness at 180◦ scat-tering angle cannot be made, so all lidar-backscatter-related AERONET values are model-based quantities.
3 Method
3.1 Data preparation and processing
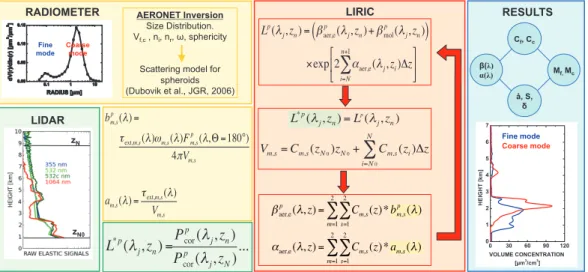
The basic structure of LIRIC is shown in Fig. 1. In our study we used the LIRIC version from autumn 2012. The lidar database for LIRIC consists of background-corrected, elastic-backscatter lidar signalsP (λj, zi)for different laser wavelengthsλj:
P (λj, zi)=E0(λj)
O(λj, zi)
z2i [βaer(λj, zi)+βmol(λj, zi)]
×exp
−2
zi Z
0
αaer(λj, z)+αmol(λj, z)dz
.(1)
E0 is the system constant and considers, e.g., the outgoing laser pulse energy, collection area of the telescope, optical ef-ficiencies of the transmitter and receiver units, photon detec-tion efficiency, and vertical thickness1zof the backscatter-ing range cell.O(λj, zi)describes the incomplete overlap of
the laser beam for wavelengthλj with the RFOV.zidenotes
the vertical range between the lidar and the backscattering range cell. The near-range measurements are influenced by the changing laser-beam RFOV overlap. This effect is cor-rected by use of measured overlap functions O(λj, zi) as
mentioned in Sect. 2.1. βaer andβmol are the particle and
Rayleigh backscatter coefficients andαaerandαmolthe par-ticle and Rayleigh extinction coefficients, respectively. Be-sides the three elastic-backscatter signals, the cross-polarized lidar return atλ2=532 nm
P⊥(λ2, zi)=E0(λ2)
O(λ2, zi) z2i [β
⊥
aer(λ2, zi)+βmol⊥ (λ2, zi)]
×exp
−2
zi Z
0
[αaer(λ2, z)+αmol(λ2, z)] dz
(2)
is used.
After range and overlap correction the four signals are av-eraged over a given time period (of minutes to hours, depend-ing on the variability of the aerosol conditions) to increase the signal-to-noise ratio. The corrected lidar signals
Pcorp (λj, zi)=
Pp(λj, zi)z2i O(λj, zi)
(3) form the basic lidar input data set in the LIRIC data anal-ysis. HerePp(λj, zi)withp=k + ⊥orp=⊥denotes the total backscatter signal and the cross-polarized signal (for
λ=532 nm), respectively. For simplicity, we omit index p
(as in Eq. 1) whenp=k + ⊥.
The minimum measurement height zN0 and the
refer-ence height zN must be defined. For heights below zN0,
the retrieval assumes constant microphysical and height-independent particle backscatter and extinction conditions as large as the values observed at the minimum measurement height (Mattis et al., 2004). Above zN the contribution of
aerosol particles to the AOT is assumed to be negligible. The following quantities are then introduced in the LIRIC procedure (see Fig. 1, green box):
L∗p(λj, zn)=
Pcorp (λj, zn)
Pcorp (λj, zN)
[βaerp (λj, zN)+βmolp (λj, zN)]
×exp
"
−2
n+1
X
i=N
αmol(λj, zi)1z #
= [βaerp (λj, zn)+βmolp (λj, zn)]
×exp
"
2
n+1
X
i=N
αaer(λj, zi)1z #
, (4)
L*p
(λj,zn)=L
p( λj,zn)
Vm,s=Cm,s(zN0)zN0+ Cm,s(zi)∆z i=N0
N
∑
AERONET Inversion Size Distribution. Vf,c , ni, nr, ω, sphericity
Scattering model for spheroids (Dubovik et al., JGR, 2006)
Lp(λj,zn)= β
p
aer,e(λj,zn)+β p
mol(λj,zn)
(
)
×exp 2 αaer,e(λj,zi)∆z i=N
n+1
∑
LIDAR
Fine mode
Coarse mode
RADIOMETER LIRIC RESULTS
β(λ)
α(λ)
Cf, Cc
Mf, Mc
å, S,
δ
zN0 zN
βp
aer,e(λ,z)= Cm,s(z) *b p m,s(λ) s=1
2
∑
m=12
∑
αaer,e(λ,z)= Cm,s(z) *am,s(λ) s=1
2
∑
m=12
∑
bpm,s(λ)=
τext,m,s(λ)ωm,s(λ)F p
m,s(λ,Θ=180°) 4πVm,s
am,s(λ)= τext,m,s(λ)
Vm,s
L*p(
λ
j,zn)=Pp cor(
λ
j,zn) Ppcor(λ
j,zN)...Fig. 1.Basic structure of LIRIC. Photometric information (radiometer, top yellow box) is used to retrieve height-independent (column)
volume-specific backscatter and extinction coefficientsbm,sandam,s (center yellow box) for spherical (s=1) and non-spherical particles
(s=2) of the fine mode (m=f) and coarse mode (m=c). A lidar signal termL(orange box, top) can be calculated with LIRIC by using
profiles of backscatter and extinction coefficients (orange box, bottom) that, in turn, are calculated from the volume-specific coefficients
bm,sandam,sand profiles of particle volume concentrationCm,s(z). Deviations between the observed lidar signal termL∗(green box) and
the LIRIC expressionLare minimized in order to retrieve optimizedCm,s(z)profiles (orange box, center). As a constraint, the integrals of
theCm,s(z)profiles must match the respective column valuesVm,s as observed with AERONET photometer (orange box, center). LIRIC
products (blue box) are profiles of particle optical properties (e.g., backscatter and extinction profiles, ˚Angstr¨om exponents, lidar and
depo-larization ratios) and microphysical properties (e.g., volume concentrationsCfandCcas shown as profiles). The mass concentrationsMf
andMcfor fine and coarse mode, respectively, are not LIRIC products.
(βaer⊥ =0) is assumed at the reference heightzN. As a LIRIC
start value atzN, we assume a backscatter ratio of total
(par-ticle+ Rayleigh) to Rayleigh backscattering of 1.1 at zN
for all three wavelengths. However, the final backscatter and extinction profiles may not show these backscatter ratios of 1.1 at heightzN at the end of the LIRIC data analysis. The LIRIC code is designed as a least-square-method-based sta-tistically optimized retrieval procedure (Dubovik and King, 2000; Dubovik, 2004) as explained below, and searches for lidar profiles of particle optical and microphysical properties that best match the AERONET column-integrated findings. The calculation of L∗(λ
j, zn) and L∗⊥(λ2, zn)starts from zn=zN−1 downward towards the minimum measurement heightzN0 with a resolution of 15 m.
Equation (4) shows that L∗(λj, zn)andL∗⊥(λ2, zn)are
mainly determined by height profiles of particle optical prop-erties. These aerosol profiles are also estimated by means of aerosol products retrieved from the photometer observations. Comparing these profiles to the lidar measurements allows us to retrieve profiles of the particle volume concentrations. For this task, the expressionsL(λj, zn)andL⊥(λ2, zn)similar to
L∗(λj, zn)andL∗⊥(λ2, zn)from Eq. (4) are introduced (see Fig. 1, orange box):
Lp(λj, zn)= [βaerp ,e(λj, zn)+βmolp (λj, zn)] ×exp
"
2
n+1
X
i=N
αaer,e(λj, zi)1z #
. (5)
The particle backscatter and extinction coefficientsβaer,e andαaer,e (index e for estimate from photometer observa-tions), respectively, are defined as
βaer,e(λ, z)=Cf,1(z)bf,1(λ)+Cf,2(z)bf,2(λ)
+Cc,1(z)bc,1(λ)+Cc,2(z)bc,2(λ) , (6)
βaer⊥,e(λ, z)=Cf,2(z)b⊥f,2(λ)+Cc,2(z)b⊥c,2(λ) , (7)
αaer,e(λ, z)=Cf,1(z)af,1(λ)+Cf,2(z)af,2(λ)
+Cc,1(z)ac,1(λ)+Cc,2(z)ac,2(λ) (8) with the particle volume concentrationsCm,s(z)for particle modem(index f for fine mode and index c for coarse mode) and particle shape parameterswiths=1 for spherical par-ticles ands=2 for non-spherical particles.Cm,s(z)are the variables that have to be optimized in the LIRIC data analy-sis. The procedure is outlined in detail in Chaikovsky et al. (2008, 2012) and Wagner (2012). In Eqs. (6)–(8), the column mean values of the volume-specific particle backscatter coef-ficientsbandb⊥and extinction coefficienta are defined as (see Fig. 1, yellow boxes to the left)
bm,sp (λ)=
τext,m,s(λ)ωm,s(λ)Fm,sp (λ, 2=180◦)
4π Vm,s
, (9)
with
Fm,⊥2(λ2, 2=180◦)=1
2[F11,m,2(λ2, 2=180
◦)
−F22,m,2(λ2, 2=180◦)], (11) and
am,s(λ)=τext,m,s(λ)
Vm,s
. (12)
F11andF22are the first and second diagonal elements of the scattering matrix, respectively;τextdenotes the extinction op-tical thickness, andωthe single-scattering albedo. From pho-tometric measurements (see Fig. 1, yellow box) the retrieved fine-mode and coarse-mode volume concentrationsVm,s, the
complex refractive index (real partnr, imaginary partni), the size distribution, and the volume fractions of spherical par-ticles (denoted as sphericity in the AERONET database) are required to solve Eqs. (9)–(12). These quantities are obtained by means of the AERONET inversion algorithm. The non-spherical particles are described with the spheroidal-particle model after Dubovik et al. (2006).
Several simplifying assumptions are made. The refractive-index characteristics are the same for fine and coarse parti-cles. The ratio of spherical to spheroidal particles (in terms of column volume concentration) is also assumed to be the same for fine mode and coarse mode. However, the ratio can vary with height in the case of coarse-mode particles in ac-cordance with the vertical distribution of non-spherical par-ticles as indicated by the cross-polarized 532 nm backscatter signal. The ratio of spherical to spheroidal particles is height-independent for fine-mode particles in order to keep the set of input parameters as small as possible. Under the assump-tion of randomly oriented spheroids in the particle mixture,
F11,F22,τext, andωare provided for the lidar wavelengths by solving the vector radiative-transfer equation for a plane-parallel multilayered atmosphere (Dubovik et al., 2006).
These simplifications may introduce considerable uncer-tainties, e.g., when spherical sulfate particles (fine mode) are present in the vertical column together with irregularly shaped volcanic dust particles (coarse mode). In this case, the refractive-index characteristics as well as the ratio of spher-ical to non-spherspher-ical particles are very different for fine and coarse particle fractions. Such a situation occurred after the Eyjafjallaj¨okull volcanic eruption, and is discussed in the next section.
It remains to be mentioned thatbm,s(λ)can be expressed
byam,s(λ)/Sm,s(λ) with the extinction-to-backscatter ratio
(lidar ratio)
Sm,s(λ)= 4π
ωm,s(λ)Fm,s(λ, 2=180◦)
. (13)
The lidar ratio is an essential lidar parameter in the character-ization of aerosol particle mixtures and types (M¨uller et al., 2007).
As mentioned, LIRIC is based on the least-square method (LSM) for the statistically optimized inversion of multi-source data (Dubovik and King, 2000; Dubovik, 2004). It
is out of the scope of this paper to describe the entire LIRIC data-processing scheme in detail. As part of the LIRIC op-timization process the difference between the AERONET-related expressionLp(λj, zn)and the lidar-derived
expres-sion L∗p(λj, zn) is minimized with respect to the particle
volume concentrations Cm,s (Fig. 1, orange box, center).
Also, the photometer-derived column volume concentrations
Vm,smust agree with the corresponding integrals over the
re-spective concentration profiles (Fig. 1, orange box, center):
Vm,s=Cm,s(zN0)zN0+
N X
i=N0
[Cm,s(zi)]1z . (14)
Here,Cm,s(zN0)zN0 describes the contribution of the lower-most tropospheric layer (below the lowerlower-most lidar measure-ment height zN0) to the volume concentration profile. For
heights < zN0 the values are set constant and equal to the
value atzN0.
The LSM-based statistical retrieval procedure requires co-variance matrices of the lidar signal measurement errors (as a function of height). Details to the signal noise estimations for the observation cases shown here are given by Wagner (2012). To assure optimized profiles, the optimization pro-cess is performed within the error margins following princi-ples of statistical estimation theory (Eadie et al., 1971). More information about the LIRIC data analysis can be found in Chaikovsky et al. (2008, 2012) and Wagner (2012).
To characterize the uncertainties in the LIRIC results the input parameters are varied. In Sect. 4, only errors are shown (as error bars) that originate from the LIRIC data procedure itself and the related input (regularization parameters). To ob-tain a characteristic error introduced by the LIRIC method, 5–10 runs were performed with realistic but well selected regularization parameter sets. These results were used in the estimation of the standard deviation of the entire uncertainty range (of possible LIRIC solutions).
preparation phase, and values other than the chosen lidar data parameters would lead to worse and usually unreasonable re-sults in terms of backscatter and extinction profile structures, and can thus easily be sorted out.
Finally, the mass concentrationsMf(z)andMc(z)for fine-mode and coarse-fine-mode particles, respectively, can be calcu-lated from the particle volume concentrationsCm,s(z):
Mf(z)=ρ1Cf,1(z)+ρ2Cf,2(z) , (15)
Mc(z)=ρ1Cc,1(z)+ρ2Cc,2(z) . (16)
Estimates of the particle densitiesρ1andρ2(assumed to be height-independent) are required. Appropriate values of ρ1
(mainly sulfate aerosol) andρ2(desert and volcanic dust) can be found, e.g., in Ansmann et al. (2012). The final products of the LIRIC data analysis are summarized in the blue box in Fig. 1. To better compare the LIRIC results with the products of the POLIPHON method (Sect. 3.2), mass concentrations for spherical and non-spherical particles are computed in ad-dition:
M1(z)=ρ1
Cf,1(z)+Cc,1(z), (17)
M2(z)=ρ2Cf,2(z)+Cc,2(z). (18)
From the LIRIC backscatter and extinction coefficients af-ter Eqs. (6) and (8), the lidar ratio profiles for the different wavelengths can be computed:
Saer,e(λ, z)=
αaer,e(λ, z)
βaer,e(λ, z)
. (19)
Several ˚Angstr¨om exponents ( ˚Angstr¨om, 1961), ˚axe(λ1, λ2, z)= −
ln[xe(λ1, z)/xe(λ2, z)]
ln(λ1/λ2) , (20)
where λ1< λ2 can be calculated from the profiles of the particle backscatter (xe=βaer,e) and extinction coefficients
(xe=αaer,e).
The photometer data in combination with the applied particle-scattering model (for spherical and spheroidal par-ticles) permit the retrieval of column-mean backscatter coef-ficients as a function of the polarization state with respect to the incident laser light:
b⊥(λ)=b⊥f,1(λ)+bf⊥,2(λ)+b⊥c,1(λ)+b⊥c,2(λ) , (21)
bk(λ)=bkf,1(λ)+bfk,2(λ)+bkc,1(λ)+bkc,2(λ) . (22) For spherical particles the contributions to light depolar-ization are negligible in that b⊥f,1(λ)=0 and b⊥c,1(λ)=0. As mentioned, only non-spherical particles (desert dust, volcanic dust) cause significant depolarization. Instead of Eq. (6), we can write
βaer⊥,e(λ, z)=Cf,2(z)b⊥f,2(λ)+Cc,2(z)b⊥c,2(λ) , (23)
βaerk ,e(λ, z)=Cf,1(z)bkf,1(λ)+Cf,2(z)bfk,2(λ)
+Cc,1(z)bkc,1(λ)+Cc,2(z)bkc,2(λ) , (24)
so that we finally obtain the particle linear depolarization ra-tio:
δaer,e(λ)=βaer⊥,e(λ)/βaerk ,e(λ) . (25)
The photometer-derived profiles of the lidar ratio, ˚Angstr¨om exponents for backscatter and extinction, and depolarization ratio can be compared with the respective results directly de-termined from the Raman lidar observations (Ansmann et al., 1992; Mattis et al., 2004; Tesche et al., 2009a). This compar-ison is presented in Sect. 4.
With respect to the retrieval of mass concentration for dust particles, we can summarize that LIRIC uses photometer-derived volume-specific backscatter and extinction coeffi-cients for spherical as well as non-spherical particles for both fine and coarse modes. This AERONET informa-tion (column-integrated values) is then applied to determine height profiles of volume and mass concentration of spheri-cal and non-spherispheri-cal fine-mode particles and spherispheri-cal and non-spherical coarse-mode particles by minimizing the dif-ferences between the modeled lidar profilesL(λ, z)and the measured lidar profilesL∗(λ, z). The important point is that LIRIC is based on the assumption that non-spherical parti-cles can be described by a spheroidal-particle model. This may significantly affect the backscatter-coefficient, lidar-ratio, and depolarization-ratio retrievals (Gasteiger et al., 2011a; M¨uller et al., 2012), and thus the derived particle vol-ume and mass concentrations. The implication of the model assumption on a spheroidal particle shape is discussed in Sect. 4 by comparing the LIRIC output with results obtained by means of the POLIPHON technique.
3.2 Determination of particle mass concentrations by means of the POLIPHON technique
An alternative approach for the retrieval of particle vol-ume and mass concentration profiles is the single-wavelength POLIPHON technique (Ansmann et al., 2012). The method is based on measured profiles of the particle linear de-polarization ratio and the lidar ratio at 532 nm and does not require the assumption of a specific particle shape. In this depolarization-ratio-based method it is assumed that the fine-mode-related backscatter and extinction coefficients are exclusively caused by non-depolarizing spherical particles (i.e., fine-mode fraction) and that the coarse mode consists of strongly light-depolarizing non-spherical particles only. Spherical coarse particles as well as non-spherical fine-mode particles are thus ignored in this method. If the particle de-polarization ratio is≥0.31 in Saharan dust layers, the fine-mode particle fraction is set to 0 %. If the 532 nm depolar-ization ratio is≤0.02, the coarse-mode fraction is set to 0 %. For depolarization ratios from 0.02 to 0.31 we use the method described by Sugimoto et al. (2003) and Tesche et al. (2009a) to compute the height profiles of the backscatter coefficient
Table 1.Atmospheric and lidar input parameters and assumptions in the LIRIC and POLIPHON mass concentration retrievals as used in the
paper. Overlap correction has only an impact on POLIPHON results for heights withO(λj, zi) <1.
Input parameter LIRIC POLIPHON
Overlap correction × (×)
Minimum/maximum heights of data analysis range ×
Rayleigh scattering, actual atmospheric profile × ×
Reference backscatter coefficient × ×
Refractive index, height-independent, same for fine and coarse mode × ×
Column-mean sphericity, same for fine and coarse mode × ×
Ratio of fine-mode spherical to non-spherical particles, height-independent ×
Particle size distribution, height-independent × ×
Spheroidal particle model (inbm,s(λ)computation) ×
Volume-specific backscatter coefficientbm,s(λ), height-independent ×
Spheroidal particle model (inam,s(λ)computation) × ×
Volume-specific extinction coefficientam,s(λ), height-independent × ×
Particle densities, fine mode, coarse modeρ1,ρ2 × ×
Particle lidar ratio, fine mode, coarse mode ×
Fine-mode particles – spherical particles only ×
Coarse-mode particles – non-spherical particles only ×
the same except that the volcanic depolarization ratio is set to 0.34 (Ansmann et al., 2012).
As is the case for the LIRIC method, the POLIPHON technique makes use of photometer-derived volume-specific extinction coefficientsaf andac for fine-mode and coarse-mode particles (Eq. 12). The values for af and ac can di-rectly be computed from volume concentrationsVf andVc and AOTsτext,fandτext,c downloaded from the AERONET website. The parametersafandac are almost insensitive to particle shape effects (Dubovik et al., 2006), in contrast to scattering properties computed for a scattering angle of 180◦
(as required in the LIRIC data analysis). The reason is that small-angle forward scattering mainly contributes to parti-cle extinction and that the corresponding phase function seg-ments for spheroidal and spherical particles are very similar (Dubovik et al., 2006).
The mass concentrationsM1 for spherical particles (fine mode) andM2for non-spherical particles (coarse mode) are estimated as follows:
M1(z)=ρ1(Vf/τext,f)βaer,1(z)Saer,1
=ρ1(af−1)βaer,1(z)Saer,1, (26)
M2(z)=ρ2(Vc/τext,c)βaer,2(z)Saer,2
=ρ2(ac−1)βaer,2(z)Saer,2. (27) According to these equations, appropriate (actual) lidar ra-tiosSaer,1 andSaer,2 are needed and obtained from the Ra-man lidar measurements or from combined photometer-lidar observations (Ansmann et al., 2011b, 2012). We use column lidar ratios in the mass concentration retrieval, disregarding that the Raman-lidar method provides lidar ratio profiles. Be-sides particle densitiesρ1andρ2, temporal mean values of
the volume-to-extinction conversion factorsVc,f/τext,c,f are determined and inserted in Eqs. (26) and (27).
The main advantage of the POLIPHON method is that a particle shape model for irregularly shaped dust particles is not required. The particle depolarization ratio is used to separate spherical and non-spherical particle fractions. How-ever, fine- and coarse-mode fractions as determined with LIRIC may not be well represented by these spherical and non-spherical particle fractions. A significant part of the non-spherical dust particles may belong to the fine mode, but are interpreted as coarse-mode particles when applying POLIPHON, i.e, when the non-spherical particle fraction is assumed to be identical to the coarse-mode fraction. This as-pect is further discussed in the next section.
spheroidal-particle model on the LIRIC mass retrieval. The other assumptions and input parameters in Table 1 are less critical and introduce only minor uncertainties in the mass concentration retrieval. A critical aspect remains in the case of hygroscopic volcanic dust (Ansmann et al., 2012). As will be discussed below, at high relative humidities a part of the volcanic coarse dust may become spherical and may then be counted as fine-mode aerosol. Under these conditions, the volcanic dust concentrations will be underestimated.
4 Results
Two case studies are presented in the following. A strong Saharan dust outbreak reached central Europe at the end of May 2008. Anthropogenic and dust particles were almost perfectly separated with height. Urban haze occurred in the lowermost 700 m of the atmosphere, whereas desert dust was observed from 1 to 6 km height. Mixing was prohibited by a strong temperature inversion layer at the top of the haze layer. The fine-mode fraction (FMF, ratio of fine-mode AOT to total AOT) was 0.20–0.25, and the spherical-particle volume frac-tion (sphericity) was estimated by the AERONET retrieval to be 1.7 %. Thus, practically all particles were irregularly shaped dust particles. Under these conditions, all simplifying LIRIC assumptions such as same refractive-index character-istics and same ratios of spherical to non-spherical particles in both particle modes are widely fulfilled so that optimum conditions are given to study the impact of the spheroidal-particle model on the retrieved profiles of dust optical and microphysical properties.
In contrast, the second case observed over Leipzig after the Eyjafjallaj¨okull volcanic eruption in April 2010 deals with an aged volcanically disturbed air mass with vertically com-plex aerosol layering and mixing of spherical sulfate parti-cles (fine mode) and non-spherical volcanic dust partiparti-cles (fine-mode and coarse-mode particles). The volcanic parti-cles may have been partly spherical because of water uptake at high relative humidity. In contrast to the Saharan dust case, the FMF was close to 0.8. Fine-mode particles dominated particle backscattering and extinction. The contribution of spherical particles to the particle volume concentration was on the order of 15 % according to the AERONET retrievals. Very different refractive-index characteristics and very dif-ferent ratios of spherical-to-non-spherical particles in fine mode and coarse mode can be expected. All basic assump-tions of the LIRIC/AERONET approach, as listed in Table 1, were probably considerably violated. This second, complex aerosol case may especially show the limits of the synergy of column-integrated and profile observations. These two obser-vational cases were already discussed in detail by Ansmann et al. (2012), so the LIRIC method can be applied to well-documented and quality-checked lidar/photometer data sets.
4.1 Saharan dust
A long-lasting Saharan dust event was monitored with li-dar and photometer from 25 to 31 May 2008. The parti-cle optical thickness at 500 nm showed values around 0.7 from the early morning of 28 May 2008 to the early morn-ing of 30 May 2008. Figure 2 shows lidar height-time dis-plays of the 1064 nm range-corrected signal in the evening of 29 May 2008. Well-stratified dust layers up to 5.5 km were found. Persistent, long-lasting cirrus decks frequently occurred and disturbed the AERONET sun/sky photometer observations. A good opportunity to compare and combine lidar and photometer observations and to apply the LIRIC method was given in the evening of 29 May 2008. At around 17:30 UTC, the sky was cloud-free during several successive AERONET observations. Stable aerosol conditions (see dis-cussion below) throughout the following night enabled the determination of the full set of Raman lidar results and en-sured a perfect framework for a critical assessment of the LIRIC results.
Because of these very constant aerosol conditions we averaged all cloud-screened lidar profiles measured in the evening of 29 May 2008, 21:47 to 23:15 UTC, to minimize the impact of signal noise on the retrieval. The respective 1.5 h mean profiles of the three particle backscatter coeffi-cients at 355, 532, and 1064 nm computed with Eq. (6) and the corresponding extinction profiles after Eq. (8) are pre-sented in Fig. 3. In addition, the particle backscatter coeffi-cient computed from the cross-polarized 532 nm backscatter signal is presented. This latter backscatter coefficient consid-ers only backscattering by non-spherical particles according to Eq. (7). Figure 3 also shows the corresponding profiles of the volume concentrations for fine-mode and coarse-mode particles as retrieved with LIRIC. As mentioned, the verti-cally integrated fine-mode and coarse-mode volume concen-trations must match the respective column values retrieved from AERONET observations.
As outlined above, the lidar was well aligned on this day and the overlap function well characterized. The incomplete overlap between laser beam and RFOV could be corrected with sufficient accuracy down to zN0=150 m height. The reference height zN was set to 9 km height. The 500 nm AOT measured with the AERONET photometer was 0.73 at 17:30 UTC and 0.70 the next morning.
21:450 22:00 22:15 22:30 22:45 23:00 23:15 2
4 6 8 10 12 14
Time [UTC]
H
e
ig
h
t
[km
]
1064-nm range-corrected signal, Leipzig, 29 May 2008
15 17 19 21 23
log. of signal
Fig. 2. Range-corrected signal at 1064 nm measured on
29 May 2008, 21:47–23:15 UTC (signal counts in logarithmic scale). The vertical resolution of the lidar measurement is 60 m; the temporal resolution is 30 s. The 500 nm AOT was 0.7–0.75 up to 6 km height in the evening of 29 May.
found around 2 km. The reversed backscatter spectrum in the dust layer may be caused by the use of the spheroidal-particle model in the LIRIC/AERONET retrieval as further discussed below.
As mentioned, the error bars in Fig. 3 only account for un-certainties in the input parameters of the LIRIC procedure, and not for uncertainties in the basic lidar signal profiles. We estimated a potential impact of the overlap correction by us-ing three different but reasonable overlap profiles, and found that the results shown in Fig. 3 varied by up to 25 % in the lowermost 1500 m and on the order of 5 % in the aerosol layers up to 3500 m. Variations of the reference height and minimum measurement height in the LIRIC data analysis by ±1 km lead to variations in the backscatter and extinction co-efficients by up to 50 % in the lowermost 1500 m and around 15 % in the aerosol layers. However, many of these result-ing LIRIC profiles then show, e.g., a constant but unrealistic offset above the main aerosol layers (around the reference height) and can thus be sorted out by visual inspection. Nev-ertheless, a careful study of the impact of the overlap cor-rection and setting of the minimum and reference heights is an important part of the lidar data analysis and an important prerequisite for high-quality LIRIC products.
Figure 4 shows a comparison of the LIRIC backscat-ter coefficients at 532 nm with respective backscatbackscat-ter pro-files directly retrieved from the Raman lidar observa-tions (total backscatter coefficient, for simplicity denoted as POLIPHON curves) and derived by using the separa-tion method of Tesche et al. (2009a) for the spherical and non-spherical particle fractions. As can be seen, the total backscatter coefficients agree well. The respective 532 nm extinction coefficient in Fig. 3 is however overestimated by 10–20 % in the dust layer when compared to the direct Ra-man lidar observation (not shown), and thus also the dust
0 80 160 240
0 2 4 6 8 10
0 2 4
BSC COEF. [Mm-1 sr-1]
H
E
IG
H
T
[
k
m
]
29 May 2008 21:47-23:20 UTC
1064 nm 532 nm 355 nm
532c nm
0 200
EXT COEF. [Mm-1] VOL. CONC. [µm3 cm-3]
Fine mode
Coarse mode
Fig. 3. Mean particle optical parameters (left: backscatter coef-ficient, center: extinction coefficient) for three laser wavelengths, backscatter coefficient for the cross-polarized 532 nm lidar channel (left, 532c nm, dark green), and particle volume concentration pro-files (right) for fine-mode and coarse-mode fractions retrieved with the LIRIC method based on the lidar observations on 29 May 2008 shown in Fig. 2. The vertical resolution is 15 m. The reference
height is set tozN=9 km and the minimum measurement height
iszN0=150 m. The error bars show the uncertainties (standard
de-viation) of the LIRIC results (see discussion in Sect. 3.1).
extinction-to-backscatter ratio is overestimated (more details are given below).
In the central and left parts of Fig. 4, the LIRIC backscat-ter coefficients for non-spherical and spherical particles are shown and compared with the respective POLIPHON re-sult. In addition, the LIRIC backscatter profiles for the fine mode and coarse mode are given. The sphericity as provided by the AERONET retrieval plays an important role in the LIRIC data analysis. The spherical particle volume fraction is 1.7 % after AERONET and finally 0.1 % in the LIRIC data set. According to the POLIPHON volume concentrations the sphericity is 8.5 %. As a consequence, the LIRIC non-spherical particle backscatter coefficients are slightly larger than the respective POLIPHON values in the lofted Saha-ran dust layer and considerably larger in the haze layer be-low 700 m height. By comparing the LIRIC coarse-mode backscatter profile with the one for non-spherical particles, we obtain an impression as to how much of the backscatter is caused by non-spherical fine-mode particles. Because of the low AERONET sphericity value the backscatter coeffi-cient for spherical particles is almost zero at all heights. In contrast, the respective POLIPHON curve shows that spher-ical particles considerably contributed to backscattering in the haze layer. This fine-mode backscatter in the lowermost 700 m is attributed to non-spherical particles after LIRIC (see center plot in Fig. 4).
0 1 2 3 4 5 6 7
0 2 4 0 2 4 0 2 4 6
H
E
IG
H
T
[
k
m
]
Total backscatter
PARTICLE BSC COEFFICIENT [Mm-1
sr-1
] POLIPHON, spherical particles
LIRIC, spherical particles
LIRIC, fine mode
POLIPHON, non-sph. particles
LIRIC, non-sph. particles
LIRIC, coarse mode
POLIPHON
LIRIC
Fig. 4. Comparison of LIRIC- and POLIPHON-derived parti-cle backscatter coefficients observed on 29 May 2008. The blue POLIPHON curves are taken from Fig. 2 of Ansmann et al. (2012). The error bars indicate the uncertainties of the retrieval products as discussed in Sect. 3.1 (LIRIC) and in Ansmann et al. (2011a, 2012) (POLIPHON).
(Eqs. 15–16). The LIRIC profiles are compared with respec-tive POLIPHON profiles for non-spherical and spherical par-ticles (Eqs. 26–27). Particle densities ofρ2=2.6 g cm−3and
ρ1=1.6 g cm−3are assumed for non-spherical and spherical particles, respectively. As can be seen, good agreement of the LIRIC and POLIPHON results for non-spherical and coarse-mode particles is found. The slightly larger LIRIC values are again caused by the low LIRIC sphericity value of 0.1 %, which leads to an overestimation of the non-spherical par-ticle volume fraction (compared to the POLIPHON volume concentrations). This good agreement suggests that the non-spherical (light depolarizing) particle fraction well represents the coarse mode in the particle volume and mass retrievals in this case of a strong Saharan dust outbreak.
As a further consequence of the low AERONET spheric-ity value, the mass concentration for spherical particles is al-most zero (not visible in the right plot of Fig. 5), whereas the POLIPHON approach suggests a considerable mass concen-tration of spherical, roughly as large as the LIRIC fine-mode mass concentration. The POLIPHON results are more realis-tic. It is at least unrealistic to assume that the mass concen-tration of non-depolarizing urban haze over the central Euro-pean city of Leipzig was negligible in the lowermost 700 m of the atmosphere on this specific day with a huge Saharan dust outbreak.
The sphericity parameter is of central importance in the separation of dust (non-spherical particles) and non-dust vol-ume and mass concentrations with the LIRIC method. The spheroidal-particle model can thus be regarded as one un-certainty source leading to too low sphericity values. How-ever, it is also possible that the POLIPHON pure dust de-polarization ratio of 31 % used in the separation of dust and
] [µ ]
0 1 2 3 4 5 6 7
0 200 400 0 50 100 150
POLIPHON, spherical particles
LIRIC, spherical particles
LIRIC, fine mode
POLIPHON, non-sph. particles
LIRIC, non-sph. particles
LIRIC, coarse mode
PARTICLE MASS CONCENTRATION [µg m-3]
H
E
IG
H
T
[
k
m
]
Fig. 5. Comparison of LIRIC- and POLIPHON-derived parti-cle mass concentrations, observed on 29 May 2008. The blue POLIPHON curves are taken from Fig. 2 of Ansmann et al. (2012). Error bars indicate the uncertainties (one standard deviation).
non-dust aerosol components is too high. Lower threshold values (below 30 %) lead to a decrease of the POLIPHON-derived sphericity, i.e., to an increase of the contribution of non-spherical particles to the observed optical effects. On the other hand, as will be discussed below, the use of the spheroidal-particle model causes too low dust depolarization ratios when compared with directly measured depolarization ratios for desert dust (M¨uller et al., 2010, 2012; Gasteiger et al., 2011a) and thus a too large sphericity value.
0 10 20 30 40 0
1 2 3 4 5 6 7
40 50 60 70
FMF=0.22
H
E
IG
H
T
[
k
m
]
LIDAR RATIO [sr]
Lidar
LIRIC
DEPOL. RATIO [%]
Fig. 6.Particle lidar ratio at 532 nm (blue circles) and particle de-polarization ratio at 532 nm (blue curve) observed on 29 May 2008 with Raman lidar and derived by using the LIRIC profiles in Fig. 3 (green curves). Raman lidar signals are smoothed with window lengths of about 1000 m in the case of the lidar ratio (blue symbols). Errors bars indicate the uncertainties (one standard deviation). The depolarization ratio profile is given with 60 m resolution.
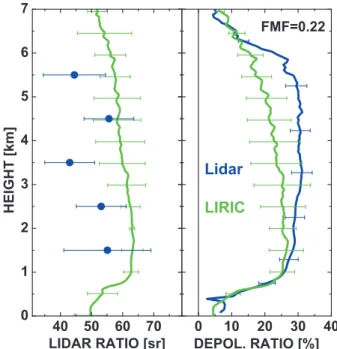
As can be seen, the particle lidar ratio in the dust layer and the spectral slope (or ˚Angstr¨om exponent) of the dust lidar ratio are systematically overestimated by the LIRIC/AERONET approach, and correspondingly the backscatter-related ˚Angstr¨om exponent is clearly underes-timated. In addition, the values of the particle depolariza-tion ratio in the lofted dust layer are systematically lower than the directly measured ones. These discrepancies are in full agreement with the findings from the SAMUM ob-servations in southern Morocco (Gasteiger et al., 2011a; M¨uller et al., 2010, 2012). These deviations of LIRIC pro-files from the measured values (Raman lidar) clearly point to the spheroidal-particle model as main error source. Directly observed lidar ratios for 355 and 532 nm are around 50–55 sr in Fig. 6. These values are typical for the western Saharan dust (Tesche et al., 2009b; Schuster et al., 2012). The LIRIC backscatter and extinction profiles lead to dust lidar ratios of 78–80 sr (355 nm) and 60–62 sr (532 nm) in the height range of 1500 to 3000 m (center part of the dust layer).
However, the lidar ratio (or better the particle backscat-ter coefficient) depends in a complicated way on the chem-ical composition (refractive-index characteristics), size dis-tribution, particle shape, and aspect ratio (particle length-to-width ratio) distributions. It remains an open question to what extent the spheroidal-particle model is responsible for
-0.5 0.0 0.5 1.0 -0.5 0.0 0.5 1.0 1.5 0
1 2 3 4 5 6 7
-0.5 0.0 0.5 1.0
Lidar
LIRIC
H
E
IG
H
T
[
k
m
]
AE-BSC AE-EXT AE-LR
Fig. 7. Backscatter-related Angstr¨om˚ exponent (AE-BSC),
extinction-related ˚Angstr¨om exponent (AE-EXT), and
lidar-ratio-related ˚Angstr¨om exponent (AE-LR) observed on 29 May 2008
with Raman lidar (blue circles) and derived by using the LIRIC profiles in Fig. 3 (green curves). Solid green curve and closed
blue symbols show the ˚Angstr¨om exponents for the 355–532 nm
wavelength range; dashed green curve and open blue symbols for the 532–1064 nm spectral range. As outlined by Ansmann et al. (2002), AE-EXT = AE-BSC + AE-LR. Raman lidar signals are smoothed with window lengths of about 1000 m in the case of extinction coefficients and the lidar ratio, and 60 m in the case of the backscatter coefficients. Errors bars indicate the uncertainties (one standard deviation). LIRIC error bars are given for AE-EXT only.
the observed systematic bias in the ˚Angstr¨om exponents and lidar ratios. Furthermore, the a priori AERONET input data are provided as column values, ignoring the observed aerosol layering with a lofted dust aerosol layer above the central Eu-ropean haze layer. As a last point, in LIRIC the same refrac-tive index is used for both fine-mode and coarse-mode par-ticles, disregarding the fact that fine-mode sulfate particles and coarse-mode desert dust particles show different scat-tering and absorption properties including respective wave-length dependence.
Time [UTC]
H
e
ig
h
t
[km
]
14:00 15:00 16:00 17:00
0 2 4 6 8 10
1064-nm range-corrected signal, Leipzig,19 Apr 2010
15 17 19 21 23
log. of signal
Fig. 8.Range-corrected signal at 1064 nm on 19 April 2010, 13:32– 17:43 UTC. The vertical resolution is 60 m; the temporal resolution is 30 s. The 500 nm AOT was 0.7 up to 6 km height in the afternoon of 19 April.
produce a particle depolarization ratio about 5–6 %, as can be seen in Fig. 6 (right panel), at heights below 500 m (LIRIC profiles).
4.2 Volcanic ash
In April 2010, an aged volcanic aerosol layer consisting of a mixture of volcanic dust, volcanic sulfate particles, and anthropogenic haze occurred over central Europe. These aerosol conditions provided a unique opportunity to apply the LIRIC approach to another type of irregularly shaped aerosol particles. In contrast to desert dust, volcanic dust is hygro-scopic (Lathem et al., 2011), so changes in the shape char-acteristics by water uptake cannot be excluded when relative humidity is high (i.e.,>70 %) (Ansmann et al., 2012). As a consequence, spherical particles may occur not only in the fine-mode but also in the coarse-mode fraction, and thus may complicate the interpretation of POLIPHON results and the comparison with LIRIC results. The contribution of spheri-cal particles to the particle volume concentration was about 15 % according to the AERONET data analysis.
The volcanic layers observed on 19 April 2010 origi-nated from the Eyjafjallaj¨okull volcanic eruptions in Ice-land on 14 April 2010 (Ansmann et al., 2011a; Schumann et al., 2011). Figure 8 shows the situation in the afternoon of 19 April 2010. The 500 nm AOT was about 0.7, and the FMF about 0.8. The well-mixed boundary layer reached up to 1000–1400 m height on that day. Above the boundary layer another layer of 1500 m thickness occurred mainly consist-ing of volcanic dust. Between 3.8 and 5.5 km height a further dust layer was detected consisting of fine-mode and coarse-mode particles. At heights around 9 km a cirrus layer devel-oped after 15:00 UTC. Photometer measurements at cloud-free conditions became almost impossible after 16:00 UTC.
0 40 80
0 2 4 6 8 10
0 3 6
BSC COEF. [Mm-1sr-1]
H
E
IG
H
T
[
k
m
]
19 April 2010 14:35-15:36 UTC
1064 nm 532 nm
355 nm
532c nm
0 250 500
EXT COEF. [Mm-1] VOL. CONC. [µm3 cm-3]
Fine mode Coarse mode
Fig. 9.Same as Fig. 3 except for a volcanic dust observation on 19 April 2010, 14:35–15:36 UTC with retrieval reference height of
zN=8.25 km and minimum measurement height ofzN0=600 m.
Figure 9 shows the LIRIC products in terms of pro-files of particle backscatter coefficient, extinction coefficient, and particle volume concentration for the fine-mode and coarse-mode fraction. LIRIC calculations were performed with cloud-screened lidar signal profiles for the time period from 14:35 to 15:36 UTC on 19 April 2010. The considered photometric measurements were taken at 14:49 UTC. Lidar signals were only used up to 8.25 km height (reference point) because of cirrus cloud evolution above this height. The min-imum measurement heightzN0 was set to 600 m.
According to the volume concentration profiles in Fig. 9, a strongly varying mixture of fine-mode and coarse-mode particles was observed throughout the troposphere. Cumulus cloud development at around 13:45 UTC at 1 km height (see Fig. 8) indicates high relative humidity of>80 % close to the top of the boundary layer. Thus particle water-uptake effects must be taken into account in the data interpretation. The rel-ative humidity was about 60 % in the lofted layer from 1.5 to 2.8 km and less than 30 % in the layer above 3.5 km height around 15:00 UTC (Ansmann et al., 2012). After 16:00 UTC, the relative humidity increased and was high up to 2.8 km height.
The backscatter and extinction coefficients retrieved with LIRIC show a pronounced, fine-mode-dominated wave-length dependence from 1 to 2.2 km. Above 2 km the backscatter coefficients are nearly the same for all wave-lengths, caused by the dominating coarse-mode particle frac-tion. The reversed backscatter wavelength spectrum at low heights (0–1 km) is related to the presence of irregularly shaped volcanic particles and the use of the spheroidal model to compute the extinction-to-backscatter ratios.
0 1 2 3 4 5 6 7
0 2 4 6 0 2 4 6 0 2 4 6 8
H
E
IG
H
T
[
k
m
]
Total backscatter POLIPHON, non-sph. particles
LIRIC, non-sph. particles
LIRIC, coarse mode POLIPHON
LIRIC
POLIPHON, spherical particles
LIRIC, spherical particles
LIRIC, fine mode
PARTICLE BSC COEFFICIENT [Mm-1 sr-1]
Fig. 10.Same as Fig. 4 except for a volcanic dust observation on 19 April 2010. The POLIPHON curves are taken from Fig. 4 of Ansmann et al. (2012).
are much more difficult to interpret than it was the case for the Saharan dust outbreak. Coarse-mode volcanic dust par-ticles were mixed with fine-mode sulfate parpar-ticles. The de-gree of mixing changed with height, and strong gradients in the aerosol concentrations were observed. In view of these complex, height-variable aerosol conditions, a detailed error analysis (identification of specific uncertainty sources) is not possible. The column-related, height-independent volume-specific backscatter and extinction coefficients as derived from the AERONET observations for the different aerosol types introduce uncertainties in the LIRIC as well as the POLIPHON results.
As can be seen in Fig. 10, the profiles of the particle backscatter coefficients do not agree well with the ones directly determined from the Raman lidar observations at heights below 2 km. Part of the systematic deviations in the lowermost 2 km may be caused by an erroneous correction of the overlap effect. The LIRIC backscatter coefficients are based on the elastic backscatter signals and are thus very sen-sitive to uncertainties in the overlap correction. The Raman lidar backscatter values in Fig. 10 are calculated from signal ratios (ratio of elastic backscatter signal to nitrogen Raman signal) so that the overlap effect (affecting both signals in al-most the same manner) widely cancels out. As mentioned, the uncertainty in the overlap correction can cause uncertain-ties of about 25 % in the backscatter coefficients for heights below 1.5 km height that then decrease quickly with height.
The LIRIC and POLIPHON total backscatter coefficients in the layers from 2 to 3 km and 4 to 5.5 km height agree well. The spherical particle volume fraction was about 15 % after AERONET, finally 16.8 % in the LIRIC data set, and 55 % after POLIPHON. This means that the non-spherical particle fraction is much higher in the case of the LIRIC pro-files compared to POLIPHON. As a consequence, the LIRIC
0 1 2 3 4 5 6 7
0 50 100 150 200 0 50 100
POLIPHON, non-sph. particles
LIRIC, non-sph. particles
LIRIC, coarse mode
PARTICLE MASS CONCENTRATION [µg3 cm-3]
H
E
IG
H
T
[
k
m
]
POLIPHON, spherical particles
LIRIC, spherical particles
LIRIC, fine mode
Fig. 11.Same as Fig. 5 except for a volcanic dust observation on 19 April 2010. The POLIPHON curves are taken from Fig. 4 of Ansmann et al. (2012).
non-spherical particle backscatter coefficients are, on aver-age, larger in Fig. 10 (central panel). A pronounced overes-timation occurs in the layer from 1 to 2 km height. Conse-quently a strong underestimation is found in the case of the backscatter profile for spherical particles.
The comparison of the LIRIC coarse-mode backscatter profiles with the LIRIC non-spherical particle backscatter profiles indicates that the coarse-mode values are dominated by spherical particles in the lowermost 1 km of the atmo-sphere. Also, the fine-mode particles are obviously mostly spherical.
As a direct consequence of the strong difference in the sphericity values, considerable deviations between the LIRIC and the POLIPHON mass concentrations are visible in Fig. 11. If we eliminate the particle density impact (ρ1= 1.6 g cm−3 for spherical particles and ρ
0 10 20 30 40 0
1 2 3 4 5 6 7
40 50 60 70
Lidar
LIRIC
FMF=0.79
H
E
IG
H
T
[
k
m
]
LIDAR RATIO [sr] DEPOL. RATIO [%]
Fig. 12.Same as Fig. 6 except for a volcanic dust observation on 19 April 2010, 13:30–15:30 UTC. Lidar signals are smoothed with 660 m vertical window length in the case of the Raman lidar solu-tions for the lidar ratio.
1 to 2 km height. The POLIPHON spherical particle mass concentrations at heights below 2 km are almost a factor of 4 larger than the LIRIC/AERONET values. The comparison of LIRIC coarse-mode and fine-mode mass profiles with the LIRIC profiles for non-spherical and spherical particles show that most of the non-spherical volcanic dust particles in the 1–2 km layer belong to the fine mode.
However, it must be kept in consideration in these POLIPHON/LIRIC comparisons that also the POLIPHON profiles are based on AERONET retrieval products (see Sect. 3.2) and are thus uncertain. Further assumptions and related uncertainties affect the accuracy (Ansmann et al., 2011a, 2012). The respective relative errors are in the range of 20–50 %, as indicated in Fig. 11. Furthermore, if a part of the volcanic particles changes from non-spherical to spheri-cal shape at high relative humidity, the fine-mode mass con-centration will be overestimated and the coarse-mode mass concentration underestimated.
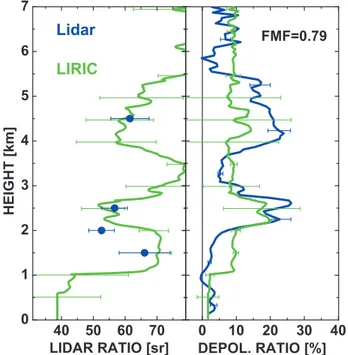
Figures 12 and 13 show the comparison of the LIRIC re-sults with the direct Raman lidar observations of the 532 nm lidar ratio, particle linear depolarization ratio, and several
˚
Angstr¨om exponents. Considering the complicated aerosol situation with all the assumption uncertainties, the agreement of the different lidar ratio profiles is reasonable. The differ-ences between the depolarization ratios result from the as-sumed sphericity of 16.8 % (LIRIC) and derived sphericity of 55 % (POLIPHON).
0.0 0.5 1.0 1.5 -0.5 0.0 0.5 1.0
0 1 2 3 4 5 6 7
0.0 0.5 1.0 1.5
Lidar
LIRIC
H
E
IG
H
T
[
k
m
]
AE-BSC AE-EXT AE-LR
Fig. 13. Same as Fig. 7 except for a volcanic dust observation on 19 April 2010. LIRIC profiles are derived from Fig. 9 (green curves). Raman lidar observations (blue circles) were performed from 13:30 to 15:30 UTC. Raman lidar signals are smoothed with window lengths of 660 m in the case of extinction coefficients and the lidar ratio.
The profiles of the ˚Angstr¨om exponents show partly strong deviations, especially in the case of the backscatter and li-dar ratio values. A negative ˚Angstr¨om exponent for the lidar ratio, as observed with our Raman lidar, indicates an aged aerosol with a high amount of comparably large fine-mode particles (M¨uller et al., 2005; Nicolae et al., 2013). In such aerosol situations, the lidar ratio at 355 nm is significantly lower than the one at 532 nm. LIRIC retrieves the opposite, a positive lidar-ratio-related ˚Angstr¨om exponent. Such a com-plicated aerosol case can obviously not be adequately han-dled by the LIRIC/AERONET data analysis scheme. The found disagreement in the intensive aerosol parameters cor-roborate our statement at the beginning of this section that many basic assumptions of LIRIC are not valid under these conditions.
5 Conclusions
The LIRIC method was applied to two very different aerosol scenarios to evaluate the potential and limits of the retrieval of optical and microphysical properties of irregularly shaped dust particles. This new technique makes use of a combina-tion of aerosol profile measurements with three-wavelength elastic-backscatter lidar and column-integrated aerosol ob-servations with spectrally resolving sun/sky photometers.