RESEARCH ARTICLE
Dynamic Redox Regulation of IL-4 Signaling
Gaurav Dwivedi1, Margaret A. Gran1, Pritha Bagchi1, Melissa L. Kemp1,2*
1Wallace H. Coulter Department of Biomedical Engineering, Georgia Institute of Technology and Emory University, Atlanta, Georgia, United States of America,2Parker H. Petit Institute for Bioengineering and Bioscience, Georgia Institute of Technology, Atlanta, Georgia, United States of America
Abstract
Quantifying the magnitude and dynamics of protein oxidation during cell signaling is techni-cally challenging. Computational modeling provides tractable, quantitative methods to test hypotheses of redox mechanisms that may be simultaneously operative during signal trans-duction. The interleukin-4 (IL-4) pathway, which has previously been reported to induce reactive oxygen species and oxidation of PTP1B, may be controlled by several other puta-tive mechanisms of redox regulation; widespread proteomic thiol oxidation observed via 2D redox differential gel electrophoresis upon IL-4 treatment suggests more than one redox-sensitive protein implicated in this pathway. Through computational modeling and a model selection strategy that relied on characteristic STAT6 phosphorylation dynamics of IL-4 sig-naling, we identified reversible protein tyrosine phosphatase (PTP) oxidation as the primary redox regulatory mechanism in the pathway. A systems-level model of IL-4 signaling was developed that integrates synchronous pan-PTP oxidation with ROS-independent mecha-nisms. The model quantitatively predicts the dynamics of IL-4 signaling over a broad range of new redox conditions, offers novel hypotheses about regulation of JAK/STAT signaling, and provides a framework for interrogating putative mechanisms involving receptor-initiated oxidation.
Author Summary
Incomplete reduction of oxygen during respiration results in the formation of highly reac-tive molecules known as reacreac-tive oxygen species (ROS) that react indiscriminately with cellular components and adversely affect cellular function. For a long time ROS were thought solely to be undesirable byproducts of respiration. Indeed, high levels of ROS are associated with a number of diseases. Despite these facts, antioxidants, agents that neutral-ize ROS, have not shown any clinical benefits when used as oral supplements. This para-dox is partially explained by discoveries over the last two decades demonstrating that ROS are not always detrimental and may be essential for controlling physiological processes like cell signaling. However, the mechanisms by which ROS react with biomolecules are not well understood. In this work we have combined biological experiments with novel computational methods to identify the most important mechanisms of ROS-mediated reg-ulation in the IL-4 signaling pathway of the immune system. We have also developed a
OPEN ACCESS
Citation:Dwivedi G, Gran MA, Bagchi P, Kemp ML (2015) Dynamic Redox Regulation of IL-4 Signaling. PLoS Comput Biol 11(11): e1004582. doi:10.1371/ journal.pcbi.1004582
Editor:Jeffrey J. Saucerman, University of Virginia, UNITED STATES
Received:July 14, 2015
Accepted:September 29, 2015
Published:November 12, 2015
Copyright:© 2015 Dwivedi et al. This is an open access article distributed under the terms of the Creative Commons Attribution License, which permits unrestricted use, distribution, and reproduction in any medium, provided the original author and source are credited.
Data Availability Statement:All data and modeling files are available from the Simtk database (https:// simtk.org/home/il4_redox).
Funding:This work was funded by the National Institutes of Health through the NIH Director’s New Innovator Award Program (https://commonfund.nih. gov/newinnovator/index), 1DP2OD006483-01 awarded to MLK. The funders had no role in study design, data collection and analysis, decision to publish, or preparation of the manuscript.
detailed computer model of the IL-4 pathway and its regulation by ROS dependent and independent methods. Our work enhances the understanding of principles underlying reg-ulation of cell signaling by ROS and has potential implications in advancing therapeutic methods targeting ROS and their adverse effects.
Introduction
From initially being perceived as accidental and harmful byproducts of aerobic respiration, reactive oxygen species (ROS) have emerged as important regulators of physiological cell sig-naling [1]. In particular, due to its relatively long half-life, enzymatic regulation, and specificity for protein thiols, hydrogen peroxide (H2O2) is recognized as an important second messenger
in signal transduction [2]. Activation of many classes of cell surface receptors induces transient ROS production by activating NADPH oxidase (Nox) family enzymes; the enzymatically pro-duced ROS play a role in modulating downstream signaling [3–5]. ROS such as H2O2can
either directly react with the thiol functional group of susceptible cysteine residues in redox sensitive proteins or indirectly oxidize protein thiols through an intermediate“relay”protein [6], converting the cysteine to sulfenic acid form [7]. Alternatively, lipid electrophiles may oxi-dize thiols without ROS directly coming in contact with proteins in the cellular milieu [8]. While further oxidation is irreversible, the sulfenic acid form can be protected by formation of disulfides and sulfenyl amides which can be reduced back by oxidoreductases such as thiore-doxin and glutarethiore-doxin [9–11]. Reversible cysteine oxidation can result in transient changes in protein function, such as gain or loss of catalytic activity, at several points in a signaling path-way resulting in systemic changes in cell signaling dynamics [12]. This reversibility has been noted as particularly relevant for the protein tyrosine phosphatases (PTP), due to a conserved low pKa cysteine residue in their active sites [13–15].
Methods for detecting intracellular changes in protein sulfenic acids are developing [16–18] but technical challenges remain to be addressed before quantitative, systems level measure-ments are possible [19]. Inferring relative contributions of and interactions between various regulatory mechanisms is not straightforward due to inherent complexity of signaling path-ways. Computational modeling can be used to simulate multiple oxidative-regulatory events and evaluate their relative importance in a meaningful way. Development of computational models for redox systems has recently gained traction [12,20–23]; however, to date, most appli-cations have focused on modeling systems in which the system structure is well-defined. The difficulty of experimentally monitoring redox events is well-suited for using available signaling data to infer the underlying interactions in signaling networks by computational methods [24].
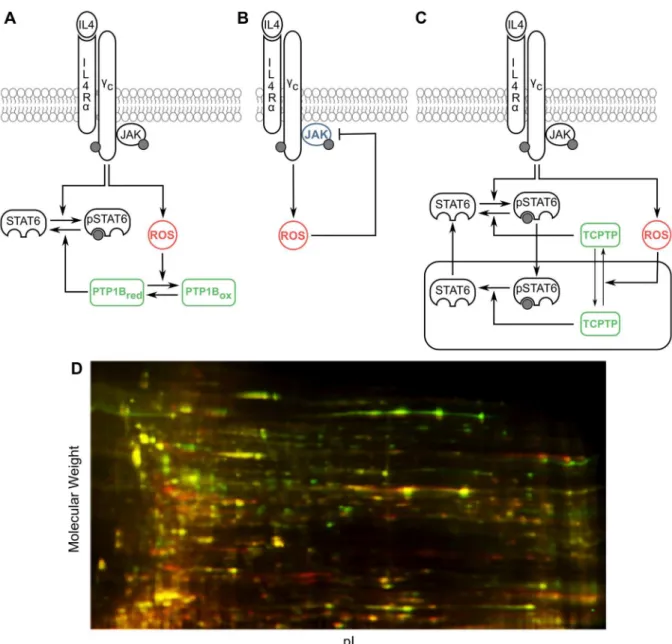
cytosolic and nuclear compartments making it an important nuclear regulator of STAT6 phos-phorylation [33]. Multiple components of the IL-4 pathway described above can act as redox sensors, in that their oxidation confers a functional change in the protein activity [1,35]. Rapid ROS production via PI3K-mediated Nox activation has been observed in IL-4 treated A549 cells, corresponding with concomitant oxidation of PTP1B [25]. ROS such as H2O2have been
reported to reversibly oxidize PTPs including PTP1B, TCPTP, CD45 and SHP-1 following acti-vation of a variety of other cell surface receptors or when H2O2is added exogenously [5,11,36–
38]. Based upon the conservation of the active site cysteine in PTPs, we hypothesized that the other PTPs involved in IL-4 regulation are also redox regulated in a manner similar to PTP1B
(Fig 1A). Furthermore, members of the JAK family have been shown to possess a redox
sensi-tive switch and could be involved in redox regulation of IL-4 signaling (Fig 1B). JAK2 and JAK3 have been shown to become increasingly inactive under oxidizing conditions [39,40]. Structural homology between JAK1 and JAK2 [39] as well as indirect experimental evidence [41] suggest that JAK1 could also be inactivated by oxidation. In addition to catalytic activities of the PTP and JAK proteins, the subcellular localization of TCPTP has also been shown to be affected by redox state of the cell with more oxidizing conditions favoring cytosolic accumula-tion of TCPTP [42] (Fig 1C). All these lines of evidence drawn from various cell types and receptor systems suggest that IL-4 signaling is potentially controlled by multiple mechanisms of redox regulation; however, biochemical and cell-based studies so far have focused on exam-ining individual mechanisms without accounting for competing influences exerted within an intact protein signaling network.
Given that multiple potential points of redox-dependent and independent control points exist in the IL-4 signaling network, how do the various putative mechanisms interact to regu-late overall signaling dynamics? In the scope of physiologically relevant levels of oxidants, to what magnitude does this form of post-translational modification (PTM) alter pathway activa-tion, and on what timescales does oxidation dissipate as a signaling mechanism? These ques-tions are particularly challenging because the outcomes of potential redox regulatory mechanisms are qualitatively opposite in nature. For instance, while PTP oxidation could increase signaling activity, JAK oxidation could suppress it. From our novel computational approaches, we conclude that oxidation of multiple PTPs is the dominant mechanism of redox regulation in IL-4 signaling and the coupling of dynamic phosphatase activity with redox-inde-pendent mechanisms is critical in explaining IL-4 signaling dynamics both at initial ligand-receptor initiation and down-regulation several hours later. We have developed a systems model of the IL-4 pathway that successfully predicts IL-4 signaling dynamics over a wide range of redox conditions, demonstrating how intracellular modulation of receptor-initiated signal-ing can occur by altered cellular redox potential.
Results
Proteome-wide thiol modifications occur upon IL-4 treatment of Jurkat
cells
To examine global oxidative post-translational modifications that may occur across the prote-ome during IL-4 signaling, we performed redox differential 2D gel electrophoresis (Redox-DIGE) [43,44] comparing unstimulated Jurkat cells to 30 minutes post treatment with 100 ng/ mL IL-4. Consistent with the prior report of intracellular oxidation occurring during this time frame [25], we observed a characteristic pattern of Redox-DIGE indicating thiol oxidative modifications of proteins (Fig 1D). We observed three sets of protein spots, green, red, and yel-low. As described in the preceding section, upon treatment with IL-4 proteins can be oxidized
reversibly (green spots) or irreversibly (red spots). A third set (yellow overlay) representing the majority of proteins visualized in this manner, remained unchanged under IL-4 treatment.
ROS are necessary but not sufficient for STAT6 phosphorylation
Jurkat cells were stimulated with 100 ng/mL IL-4 and intracellular oxidation was monitored using flow cytometry by staining the cells with CM-H2DCFDA. Fluorescence of the dyeincreased quickly after addition of IL-4 and the dye approached maximal oxidation 1 hour after IL-4 addition (Fig 2A). To ensure that the saturation in dye oxidation was not due to limi-tation in loading of the dye, a bolus of excess H2O2was added to the cells and time course of
dye fluorescence was measured. The fluorescence exceeded that observed under IL-4 Fig 1. Putative mechanisms of redox regulation in the IL-4 pathway.(A) Reversible oxidative inhibition of PTPs. (B) Reversible oxidative inhibition of kinases. (C) ROS-dependent subcellular localization of TCPTP. The receptor complex consisting of the IL-4 receptor chains and JAK molecules has been conceptually treated as a single entity in our study. (D) Observed differential proteome-wide oxidation with 30 minute treatment of 100 ng/ml IL-4 (green) over control (red) by Redox-DIGE.
stimulation showing that IL-4 did not saturate the dye oxidation signal (S1 Fig). Pretreating the cells with 20μM diphenyleneiodonium chloride (DPI), an inhibitor of phagocytic NOX and
other flavoproteins, lowered the baseline oxidation of the dye and significantly suppressed fluo-rescence/oxidation following stimulation with IL-4 (Fig 2A). Because the oxidation of
H2DCFDA is an irreversible process, the fluorescence time courses shown inFig 2Arepresent
cumulative oxidation of the dye as a function of time. In order to infer instantaneous levels of ROS from the cumulative dye oxidation time courses, Hill curves were fitted to the data points
(Fig 2A) and derivatives of these curves were obtained (Fig 2B). The derivatives indicated that
intracellular oxidation increased rapidly following IL-4 treatment of Jurkat cells, peaked at approximately 20 min and gradually returned to the baseline level. In DPI pretreated cells, the increase in oxidation was observed to be much lower than that in cells not exposed to DPI.
To study the effects of intracellular oxidation on IL-4 signaling, time-dependent phosphory-lation of total intracellular STAT6 (i.e., sum of nuclear and cytosolic pSTAT6; seeS2 Fig) was quantified under a variety of oxidative conditions. Treatment of Jurkat cells with IL-4 signifi-cantly increased STAT6 phosphorylation within 5 min, and the phosphorylation was sustained for 2 hours (Fig 2C). Cells pretreated with DPI showed significantly lower baseline
Fig 2. IL-4 induced ROS is required for STAT6 signaling.(A) Jurkat cells were pretreated or not with 20μM DPI for one hour and stimulated with 100 ng/ml IL-4. Cells were incubated with 5μM CM-H2DCFDA for
30 min before IL-4 addition. Fluorescence intensity of oxidized dye was recorded for each time point using flow cytometry. The lines are Hill curves fitted to the means. (B) Derivatives of the Hill curves shown in A. (C) Jurkat cells pretreated or not with DPI were stimulated with IL-4 and pSTAT6 was quantified using flow cytometry. (D) Jurkat cells were treated with H2O2(10μM), IL4 (100 ng/ml) or both and pSTAT6 was
measured. Values on y-axis represent background subtracted and normalized mean fluorescence intensities. Graphs represent mean±standard error of mean. N = 6 experiments for pSTAT6 under IL4 stimulation for all but the 4th(15 min) and 6th(25 min) time points where N = 3 experiments; N = 3 experiments for all other
experiments; au, arbitrary units.
doi:10.1371/journal.pcbi.1004582.g002
phosphorylation of STAT6 and responded very weakly to IL-4 stimulation (Fig 2C). Addition of exogenous hydrogen peroxide (10μM) in combination with IL-4 further increased STAT6
phosphorylation when compared to IL-4 treatment alone (Fig 2D). However, unlike the MAPK cascade [45,12], addition of H2O2in the absence of IL-4 failed to alter STAT6
phos-phorylation from its basal level (Fig 2D).
Characteristic features of pSTAT6 dynamics require PTP oxidation and
nuclear-cytosolic shuttling of proteins
The pSTAT6 time course in response to IL-4 stimulation of Jurkat cells showed two distinct local maxima over a two-hour period (Fig 2C). Statistical analysis confirmed that the first max-imum is likely to occur between 0 and 25 min, and the second between 25 and 120 min (S3 Fig). We hypothesized that the dynamic information contained in the STAT6 phosphorylation time course, especially the characteristic shape of the curve with two peaks, could be used to infer the regulatory mechanisms involved in IL-4 signaling. We sought to use this information to investigate the importance of four distinct regulatory mechanisms described above: i) revers-ible inactivation of PTPs by oxidation (Fig 1A); ii) reversible inactivation of JAK by oxidation
(Fig 1B); iii) ROS mediated cytosolic accumulation of PTPs (Fig 1C); and iv) dependence of
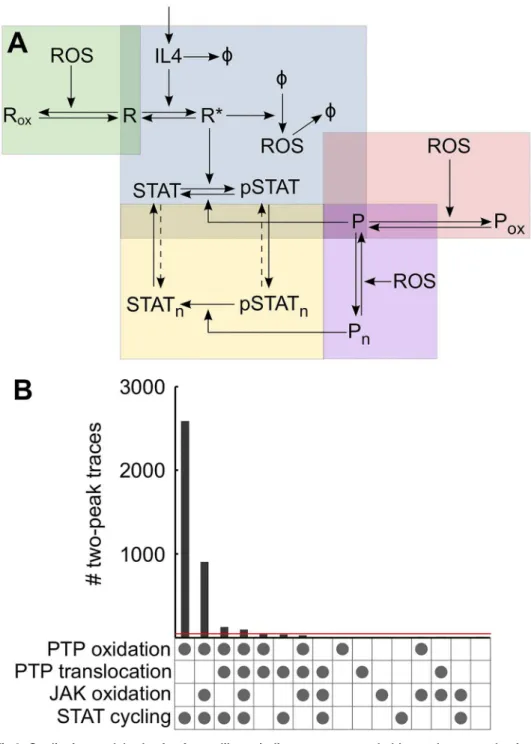
nuclear-cytosolic shuttling of STAT6 on its phosphorylation state. While the first three are directly influenced by the redox state of the cell, the fourth is not. The IL-4 signaling network was conceptually divided into 5 regulatory modules and by taking different combinations of these modules, a library of 16 different models was constructed (Fig 3A;S4 Fig). This library covers all possible combinations of the 4 mechanisms listed above. Next, simplified ODE repre-sentations of all 16 models were obtained using a rationale-based approach to reduce model complexity. Specifically, linear chains of events such as sequential assembly of active receptor complex, or dimerization of phosphorylated STAT6 were collapsed into a single reaction. JAKs, which are constitutively bound to the receptor, were not modeled explicitly and were assumed to be implicit in the receptor. Different PTPs that can dephosphorylate STAT6 were abstracted as a single generic PTP. Similarly, the“ROS”species in the model is a generic repre-sentation of oxidants that can cause direct or indirect thiol-based post-translational modifica-tions that result in modified protein function.
The various network topologies obtained were coded into systems of ordinary differential equations (ODEs) assuming elementary mass action kinetics for all reactions (S2 Text). Next, we assessed these models based on their ability to produce two distinct pSTAT6 peaks with characteristics similar to those seen in the experimental data. Parameters of the models were manually adjusted so that total pSTAT6 dynamics roughly matched the experimentally observed dynamics (rapid increase followed by a slow decrease). For each model, 50,000 sets of parameters were randomly sampled in a fixed space spanning one order of magnitude around the estimated parameter vector, the model was simulated for all sampled parameter vectors and the dynamics of total pSTAT6 were recorded. The predicted pSTAT6 traces from these Monte Carlo (MC) simulations were qualitatively and quantitatively compared with the experi-mental results as described next to judge the fitness of the models.
Fig 3. Qualitative model selection from a library indicates to more probable regulatory mechanisms.
(A) The IL-4 network was divided into conceptual modules. The core module (blue box) comprises IL-4 induced receptor (R) activation and subsequent STAT phosphorylation. Activated receptor upregulates ROS which can affect signaling through three different modules: reversible phosphatase (P) oxidation (red box), reversible JAK (assumed to be implicit in the receptor) oxidation (green box), or by modulating nuclear-cytosolic shuttling of the phosphatase (purple box). The last module (yellow box) relates to nuclear-nuclear-cytosolic translocation of STAT6 representing two possible variations: i) the dashed arrows are absent and STAT6 trafficking is unidirectional and dependent on its phosphorylation state; ii) the dashed arrows are present and STAT6 translocation is independent of its phosphorylation state. Keeping the blue module in place, the other modules were added or not and the dashed arrow in the yellow module were included or not producing a total of 16 different networks representing all possible combinations of the 4 regulatory modules. (B) For each network 50,000 MC simulations were run and dynamics of total phosphorylated STAT6 were analyzed. Counts of simulations that produced pSTAT6 dynamics with two peaks are shown for each of the 16 networks. The dot matrix under each bar indicates the regulatory mechanisms included in the corresponding model. A dot in the last row indicates STAT cycling was phosphorylation dependent. Red line indicates threshold of 0.1% of 50,000.
doi:10.1371/journal.pcbi.1004582.g003
(0.1% of number of MC simulations per model) of pSTAT6 time courses with two peaks (Fig 3B). Using this threshold of 0.1%, 12 network configurations were rejected as likely models on a purely qualitative basis due to their inability to reproduce the two peaks observed experimen-tally. Notably, all 8 models in which STAT6 translocation was independent of its phosphoryla-tion state consistently failed to cross the 0.1% threshold (Fig 3B). This strongly suggests that cycling of STAT6 between nucleus and cytosol is phosphorylation dependent. Only 4 models demonstrated the occurrence of two distinct peaks for more than 0.1% of the 50,000 MC simu-lations, and all 4 of these models included PTP oxidation as a redox regulatory mechanism (Fig 3B). The model that had PTP oxidation as the only ROS-mediated mechanism generated the most instances of pSTAT6 traces with two distinct peaks (first bar inFig 3B). The other two redox regulated mechanisms, JAK oxidation and ROS mediated nuclear translocation of PTP, could not cross the 0.1% threshold when acting alone; however, combining one or both of these mechanisms with PTP oxidation allowed two pSTAT6 peaks to occur. Nevertheless, fewer instances of traces exhibiting two peaks were generated when either one of these mecha-nisms was combined with PTP oxidation, and even fewer when both were added in together.
Quantitative comparison of features of the curves with two distinct peaks generated from the simulations with the experimental data provided further support to PTP oxidation as the prime mechanism of redox regulation in IL-4 signaling. A smoothing spline was fitted to the mean pSTAT6 data and features of the curve including heights of the two peaks, separation between them and the value at the final time point were extracted (Fig 4A). Simulations that produced two distinct local maxima for the total pSTAT6 trace were identified for each model. The features indicated inFig 4Awere extracted from the simulated curves. The ratio of peak heights, separation between the peaks, and the ratio of final value to first peak were computed and compared with the experimental results. Representative results are shown for two models
in (Fig 4B and 4C, corresponding signaling networks in4D and 4E). When only PTP oxidation
was included as a mechanism of redox regulation, not only did the model produce the most instances of curves with two peaks, but the features of these curves also conformed well with the measured dynamics (Fig 4B and 4D). However, when additional ROS dependent mecha-nisms were included in the model, both the number of curves with two peaks and their similar-ity with experimental data decreased (Fig 4C and 4E). Indeed, the network shown inFig 4D
exhibited better qualitative and quantitative fit to experimental data than all the other networks in the mode library.
Collectively, exploitation of the observed dynamic behavior in our data set allowed us to explore topological features of the IL-4 network that dictate regulation of STAT6 phosphoryla-tion. Two of the four regulatory mechanisms considered emerged as most crucial for recapitu-lating proper behavior: i) PTP oxidation; and ii) phosphorylation-dependent nuclear-cytosolic translocation of STAT6.
A systems model of ROS mediated regulation of IL-4 signaling explains
the observed dynamics
on down-regulation mechanisms were used to include SOCS and STAT6 degradation as important control mechanisms.
In the interest of parsimony, several simplifying assumptions were made in the model. The IL-4Rαchain and theγC chain were not modeled separately. Instead, we used an abstraction of
the receptor complex in the form of a single transmembrane molecule that binds IL-4 and becomes activated. The JAK1 and JAK3 molecules that are constitutively bound to the receptor chains were also not modeled explicitly and were assumed to be implicit in the receptor mole-cule. We examined the effects of explicitly modeling JAK and found that the simulation results were not altered significantly by our assumption (S5 Fig). SOCS family proteins have been shown to inhibit JAK/STAT signaling by binding directly to phosphorylated JAK molecules inhibiting their function, or by binding to the receptors and indirectly inhibiting JAK [46]. Since JAK and receptor molecules were abstracted into a single species, SOCS binding to acti-vated receptor was taken to represent both possibilities. Dephosphorylation of the receptor complex was assumed to result in dissociation with SOCS. SOCS1 and SOCS3 are known to Fig 4. Characteristic pSTAT6 dynamics with two distinct peaks provide quantitative metrics for IL-4 network topology determination.(A) A smoothing spline (continuous line) was fitted to mean pSTAT6 time course (dots) under IL-4 stimulation and distinguishing features of the curve were extracted. (B) Ratio of final value to height of peak 1 and time separation between peaks are plotted against the ratio of peak heights. Cyan markers show points corresponding to the fitted spline in A, representing experimentally measured (x, y) pairs. The heat maps indicate smoothed bivariate frequency distribution of (x, y) pairs obtained from MC simulations of network shown in D. (C) Same data for the network in E showing poor match. (D) Network with PTP oxidation as only mode of redox regulation; corresponds to first bar inFig 3B. (E) Network with all mechanisms of redox regulation represented; corresponds to fourth bar inFig 3B.
doi:10.1371/journal.pcbi.1004582.g004
affect IL-4 signaling and were modeled together as a generic SOCS molecule. Multiple phos-phatases including PTP1B and TCPTP have been shown to act on STAT6 [33,34]. Similarly, multiple phosphatases, such as CD45 and SHP-1, can dephosphorylate the receptor and JAK Fig 5. The optimal model of IL-4 signaling network includes transient protein tyrosine phosphatase oxidation in combination with shuttling and feedback mechanisms. (A)Regulatory mechanisms including ROS mediated reversible phosphatase oxidation, proteasome mediated degradation of STAT6 and down-regulation by SOCS are incorporated into the model. P1 and P2 represent PTPs acting on STAT6 and the receptor complex, respectively; red edges, dephosphorylation reactions catalyzed by indicated phosphatases; arrows pointing into other edges, enzyme catalyzed reactions;Φ, infinite sources or sinks; purple edges and nodes, points affected by CHX in the model; green edges and nodes, points affected by MG132. Intermediate complexes formed in enzyme catalyzed reactions are not explicitly shown. The model predicts phosphorylation dynamics under extremes of redox state. (B) DPI pretreatment and addition of exogenous H2O2with IL-4 stimulation were simulated using the fitted model. ROS profiles used to simulate both conditions are
shown. (C) The predictions of the model overlaid with quantitative experimental data without further parameter fitting. (D) Transient oxidation of PTPs as measured by oxPTP immunoprecipitation.
molecules [26,29]. We assumed that STAT6 and the receptor complex were dephosphorylated by distinct, individual PTPs. All reactions were modeled using the law of mass action except active STAT6 mediated SOCS production; the rate of production of SOCS was assumed to increase monotonically with the concentration of active STAT6 in a saturating fashion to model the eventual saturation of transcription factor binding sites.
Activation of the IL-4 receptor in Jurkat cells induced transient production of ROS as shown inFig 2B. ROS dynamics estimated from experimental data were used as an input to the model, thus eliminating the need to explicitly model the calcium and PI3K-mediated initiation of Nox as well as numerous mechanisms of ROS clearance [47]. Reduction of oxidized proteins was assumed to follow first order kinetics; in other words, the reducing capacity of the cell was assumed to be constant over time. The more reducing environment of the nucleus [48,49] was modeled by excluding protein oxidation reactions from the nuclear compartment.
An evolutionary strategy algorithm with hyper-mutation algorithm was used to estimate the parameters of the model. The objective function defined in the Methods section was minimized to fit the model to experimentally measured time courses of multiple species across 3 different experimental conditions (S1 TextandS6 Fig). Jurkat cells were stimulated with IL4 with or without pretreatment by either MG132 or cycloheximide (CHX). MG132 is an inhibitor of the proteasome and prevents degradation of phosphorylated STAT6. CHX is an inhibitor of pro-tein synthesis and is expected to inhibit the expression of pSTAT6 inducible suppressors of cytokine signaling (SOCS) thereby elevating the pSTAT6 signal (effects of MG132 and CHX are discussed further inS1 TextandS7 Fig). The fitted model recapitulates the dynamics of i) pSTAT6 in Jurkat cells following IL-4 stimulation with or without pretreatment by either MG132 or CHX (S6 Fig, panels A and B); ii) total STAT6 following IL-4 stimulation with or without MG132 (S6 Fig, panel C); and iii) SOCS3 under the conditions of IL-4 stimulation with or without inhibition by CHX (S6 Fig, panel D).
Signaling under extremes of intracellular redox state is correctly
predicted by synchronous, transient PTP oxidation
We tested the detailed ODE model’s ability to predict the dynamics of IL-4 signaling under new experimental conditions of high and low cellular oxidative conditions that were not used to train the model. We simulated two conditions, i) DPI pretreatment followed by IL-4 stimu-lation, and ii) addition of exogenous H2O2simultaneously added with IL-4. The experimentally
measured ROS profile under DPI pretreatment (Fig 5B) was used as input to simulate the effect of DPI in the model. To mimic the effect of 10μM exogenous H2O2added along with IL-4, a
bolus of exponentially decaying ROS was added to the experimentally measured ROS profile under IL-4 treatment (Fig 5B). The model predicted severely attenuated STAT6 phosphoryla-tion under DPI pretreatment, whereas addiphosphoryla-tion of exogenous H2O2with IL-4 was predicted to
amplify STAT6 phosphorylation in comparison to IL-4 treatment alone (Fig 5C). Both these predictions matched quantitatively with experimental results, showing that the model is robust enough to predict novel dynamics of IL-4 signaling over a wide range of redox conditions. To further validate the refined IL-4 model, we monitored reversible PTP oxidation using a mono-clonal antibody against the oxidized catalytic domain of PTPs. An increase in PTP oxidation at multiple molecular weights was observed after 30 min of IL-4 treatment followed by a slight decrease in PTP oxidation by 60 min (Fig 5D).
Discussion
While computational models of ROS production and consumption have previously been devel-oped for cells [47,50], competing redox-based mechanisms during cell signaling have not been
sufficiently explored by computational systems biology approaches. The possibility of multiple mechanisms of redox regulation specific to the IL-4 pathway poses challenges for deducing these features from observable experimental data. Our Redox-DIGE result of IL-4 induced thiol oxidation on a proteomic scale suggests that a number of reduction and oxidation post-translational modifications occur during active cytokine signaling (Fig 1D). In prior work, the-oretical analysis of various mechanisms of redox regulation overlaid on signaling network topologies demonstrated that complex signaling behaviors could arise from such interactions; computational modeling is a powerful tool to unravel this complexity [12]. Here, we have com-prehensively examined proposed mechanisms of redox regulation in the IL-4 pathway using computational modeling based on quantitative and easily acquired phosphorylation data to gain insight into the importance of reversible inactivation of PTPs by oxidation in IL-4 signaling.
The model and experimental results collectively suggest ROS may be playing two roles; first, to keep the system ready to respond to an input signal and second, to amplify the response once it is initiated by IL-4 input. Consistent with previous reports in A549 cells [25], IL-4 treated Jurkat cells were observed to quickly increase fluorescence of DCFDA, a molecular probe often used as a surrogate reporter of intracellular oxidation. DPI suppressed this ROS production indicating that Nox, isoforms of which are known to be expressed in Jurkat cells [51], could be involved in the transient ROS production. Pretreatment with DPI also signifi-cantly lowered baseline STAT6 phosphorylation and severely attenuated pSTAT6 response to IL-4 treatment; the oxidation of CM-H2DCFDA at the initial time point was also lower in the
DPI pretreated cells. We interpret this result as a sustained basal ROS production that main-tains a fraction of STAT6 in the phosphorylated state. Failure of the DPI treated cells to respond to IL-4 suggests that baseline ROS also have a role in sustaining the system in a "primed" state so that it is ready to quickly respond to an activating stimulus. Supplementing IL-4 induced ROS with exogenous H2O2amplified the pSTAT6 response; however, on its own,
the same concentration of H2O2did not elicit STAT6 phosphorylation.
Having confirmed that IL-4 signaling in Jurkat cells is redox regulated, we used computa-tional analysis to understand the control mechanisms by which ROS regulate IL-4 signaling. A key feature of our studies was examining a duration of signaling in which down-regulation occurred (~ 2 hours), which provided information about the summative effects of transient (i.e. reversible) thiol-based oxidation of phosphatases, SOCS feedback, and proteasomal degra-dation. The experimentally acquired time course of IL-4 induced STAT6 phosphorylation in Jurkat cells had a distinctive shape, presenting two distinct peaks over a two hour time period. This feature combined with combinatorial exploration of simplified models of the pathway proved a remarkably useful tool for selecting models based simply on their ability to reproduce experiment-like pSTAT6 time course with two peaks. When possible combinations of mecha-nisms were systematically examined, PTP oxidation stood out as the most likely mechanism by which redox-mediated regulation can take place. The other mechanisms considered, namely JAK oxidation and redox-mediated PTP translocation, were not sufficient on their own to explain the observed dynamics. Models with increased complexity that incorporated multiple redox mechanisms did not result in improved fits when tested within the selected parameter bounds. This double failure of the more complex models is compelling evidence in support of the PTP oxidation model, which is, firstly, parsimonious, and secondly, matches the data bet-ter, both qualitatively and quantitatively.
An important concern regarding the ability of ROS to play a significant role in modulating cell signaling has to do with the relatively slow rates of H2O2mediated cysteine oxidation in
inactivation regardless of how this occurs at the molecular level. Since intracellular ROS con-centration was modeled using scaling of fluorescence-based measurements, it could not be assigned real units in the model. This means that protein oxidation rates are also to be under-stood in terms of these arbitrary units. However, the scaling factor was chosen such that the absolute value of ROS concentration was in the order of 100 units of ROS in simulations of IL-4 stimulated cell. Since intracellular H2O2concentration is thought to be in the
sub-micromo-lar range [52], a 1:1 scaling can be assumed between the model's arbitrary ROS units and nano-molarity. Thus, assuming 1 unit of ROS in the model corresponds to 1 nM ROS in the real cell, the simulated ROS levels scale to the order of 100 nM, which is a reasonable estimate of intra-cellular H2O2concentration [47,53]. Assuming this scaling, the estimated rate of PTP
oxida-tion turns out to be 2×10⁶M-1s-1. In a previously published systems model of H2O2dispersion
in Jurkat cells, the second order rate of H2O2mediated protein oxidation was estimated to
range between 10×107M-1s-1for the fastest reactions involving catalase and peroxiredoxin to 10×104M-1s-1for the average intracellular protein [47]. The estimated rate of PTP oxidation in our model lies within this range. These rates are still much higher thanin vitromeasurements of PTP oxidation rates, butin vitroestimates themselves have been found to be much slower than observed rates of PTP oxidation (e.g. [14]). Several mechanisms have been discovered which may explain this high apparent rate of oxidation, including localization of ROS to create high concentration [54,55] and transfer of oxidation state through relay proteins [6,53], and this continues to be an area of active investigation.
Based on inferences from analysis of reduced models of redox regulation and knowledge gained from experimental data, we developed a highly detailed model of the IL-4 signaling pathway. This model includes two reversibly oxidized phosphatases, P1 and P2, responsible for receptor complex/JAK and STAT6 dephosphorylation. Because PTPs have been associated with multiple targets within the IL-4 pathway, we did not assign these variables specifically to TCPTP, PTP1B, SHP1, or CD45. The oxPTP immunoblots (Fig 5D) are consistent with model estimates of increased PTP oxidation at 30–60 minutes, with changes observed at molecular weights approximating these PTPs (45, 50, 67.5, and 147 kD, respectively). Interactions between the transient inactivation of PTPs coupled with STAT6 degradation and SOCS feed-back allowed the model to successfully predict the pathway dynamics over a wide range of oxi-dized and reduced experimental conditions. Collectively, the computational analysis indicates that while ROS mediated regulation is a very important arm of the control machinery in IL-4 signaling, systemic behavior of the pathway emerges from interactions of redox and non-redox regulatory mechanisms. For instance, none of the redox regulation mechanisms considered in our analysis were sufficient to explain pSTAT6 dynamics when working alone (Fig 3B), but combining them with other ROS-independent mechanisms changed the behavior of the system qualitatively. In other words, without considering all forms of regulation we would have reached a faulty conclusion.
In developing our models we have made several assumptions that could limit the scope of the results obtained from the modeling analysis. We have assumed mass action kinetics for the biochemical reactions included in the model with lack of compartmentation or spatial defini-tion. While there is ample precedence for modeling interleukin signaling using mass action kinetics [56–59] as well as for modeling redox kinetics [12,47], it is possible that it is not the most appropriate mechanism for some of the reactions. With respect to the library of reduced models, we have tested a fixed set of network topologies within constrained parameter ranges. While the structures are based on current knowledge of the biology of the IL-4 pathway, the parameter space or the set of network structures explored is a subset of all possible topology-parameter combination space. Additionally, in the reduced models as well as the detailed model, we have used several simplifying assumptions (seeResults), including ignoring the
time-dependent variation of the intracellular reducing pool and abstracting direct and indirect protein oxidation into a single oxidation step. While our model is built with these assumptions and simplifications, we have validated it with independent experimental data, which provides strong support to our modeling strategy.
This quantitative, model-based approach to investigating redox mechanisms responsible for systemic regulation of the IL-4 pathway provides several future venues for further computa-tional and experimental analysis. Hypothetical roles of relay proteins [53] or lipid electrophiles [8,60] as intermediates for electron transfer, for example, or the proximity to Nox for subcellu-lar localization of redox control [55] can be tested further with this modeling framework. Itera-tive feedback between modeling and experimentation will help elucidate the operating
principles in redox regulation of cell signaling, especially as technical advances in measuring redox PTMs continue.
Materials and Methods
Cell culture and reagents
Jurkat T cells were cultured in supplemented RPMI media as previously described [47]. For all experiments Jurkat cells were first serum starved at a concentration of 2×10⁶cells/ml in media containing 0.5% FBS for 4 hours. Cells were treated with 100 ng/ml human recombinant IL-4 (R&D Systems). The inhibitors cycloheximide (CHX), diphenyleneiodonium chloride (DPI) and MG132 (all EMD Millipore) were administered at 20μg/ml, 20μM and 10μM,
respec-tively. Rabbit anti-STAT6 phosphotyrosine 641 antibody (Cell Signaling Technology) was used at 1:100 dilution. Rabbit anti-SOCS3 antibody (Abcam) was used at 1:500 dilution. R-PE con-jugated anti-rabbit IgG (Life Technologies) was used as secondary antibody for flow cytometry at 1:500 dilution. R-PE conjugated anti-STAT6 (BD) was used per manufacturer's recommen-dation. Jurkat cells were incubated in 5μM CM-H2DCFDA (Life Technologies) for 30 min to
measure intracellular oxidation.
Treatment with inhibitors and flow cytometry
Serum starved cells were suspended in PBS at 4×10⁶cells/ml. For each time point in an experi-ment, the appropriate inhibitor was added one hour before IL-4 stimulation. Cells were fixed in 1.5% paraformaldehyde for 10 min at room temperature and permeabilized in 90% metha-nol for 30 min at 4°C. After staining with suitable antibodies, the samples were analyzed on a BD LSR II flow cytometer. Fluorescence data were analyzed using in-house code written in Matlab; mean fluorescence intensity (MFI) was used to summarize the observations for ana-lyzed cell populations. For pSTAT6 and SOCS3 analysis, cells non-specifically labeled only with secondary antibody were used to acquire the background signal. For STAT6, unstained cells (because the primary Ab was fluorophore conjugated) were used as background. To enable comparison between experimental conditions, background corrected MFIs were nor-malized by dividing by the background corrected MFI of Jurkat cells not treated with inhibitors and IL-4 as follows:
MFInorm¼
MFIsample MFIbk
MFIuntreat MFIbk
where,MFInormis the background corrected, normalized MFI,MFIsampleis the experimentally
measured MFI of the sample,MFIbkdenotes the background MFI, andMFIuntreatis the
To detect intracellular redox state, CM-H2DCFDA was added 30 min prior to IL-4
stimula-tion. After adding IL-4, samples were analyzed on BD LSR II Flow Cytometer to measure MFI of DCFDA. MFI time course of DCFDA stained cells not treated with IL-4 was subtracted as background from all other DCFDA time courses.
Detection of reversibly oxidized PTPs by western blotting
For detecting reversibly oxidized PTPs, we used thiol chemistry to irreversibly oxidize cysteines that were oxidized during IL-4 treatment and used immunoblotting with a monoclonal anti-body against the irreversibly oxidized catalytic domain of PTPs [61,62] to measure PTP oxida-tion. Jurkat T cells were serum starved and stimulated with IL-4 as described in the previous section. Cells were lysed with Argon purged lysis buffer (20 mM Tris HCl, 10% glycerol, 1 mM benzamidine hydrochloride, and 10μg/ml containing 100 mM iodoacetamide to protect
reduced thiols and prevent disulfide exchange) for 20 min in the dark in an Argon purged AtmosBag (Sigma Aldrich). Lysates were then sonicated for 10 min at 4°C. Following the removal of insoluble cellular debris by centrifugation at 18000 x g for 20 min at 4°C, excess iodoacetamide was removed from the lysates using Microspin G-25 columns (GE Healthcare). Samples were normalized by protein concentration using measurements obtained by BCA. Samples were then frozen overnight. Reversibly oxidized thiols were reduced with 500 mM DTT for 30 min on ice. Excess DTT was removed with Microspin G-25 columns. Nascent thi-ols were irreversibly oxidized for 1 h at room temperature using freshly prepared 1 mM perva-nadate. Samples were diluted in Laemmli sample buffer for Western blotting according to standard procedures. For measurement of oxidized PTPs, membranes were blocked for 1 h at room temperature with Rockland blocking buffer (Rockland) and incubated overnight with 10μg/ml Mouse anti-oxidized PTP antibody (R&D Systems) with 0.1% Tween 20. Membranes
were washed three times in TBS-T and probed with Donkey anti-Mouse IRDye680 (Licor) with 0.1% Tween 20 and 0.01% SDS for 1 h at room temperature. Membranes were stripped at 50°C for 15 min, blocked overnight at 4°C, and reprobed for 1 h with Rabbit anti-actin (Sigma) in Rockland blocking buffer with 0.1% Tween 20 and 0.1% SDS as a loading control. Mem-branes were imaged using a Licor Odyssey scanner and ImageStudio software.
Sample preparation for Redox-DIGE
After the individual treatments, the harvested cells were resuspended in ice-cold PBS contain-ing 50 mM NEM and transferred to 2.0 mL tubes. The cells were washed twice by 30 s centrifu-gation in NEM/PBS at 10,000 g. After the second PBS wash, the cells were resuspended in the lysis buffer (50 mM NEM, 40 mM HEPES, 50 mM NaCl, 1 mM EDTA, 1 mM EGTA, protease inhibitors, pH 7.4) to a density of 2 x 10⁷cells/mL and incubated at 37°C for 5 min. 1% w/v CHAPS was then added to the cell lysate, vortexed, and incubated for a further 5 min at 37°C. The sample was centrifuged at 8000 g for 5 min to remove the insoluble material. SDS was then added to a final concentration of 1% w/v and the supernatant vortexed and incubated for another 5 min at 37°C. The unreacted NEM was removed using Micro Bio-Spin 6 columns (Bio-Rad) equilibrated with the lysis buffer. Protease inhibitors were not present in the lysis buffer from this step. The samples were then reduced with 2.5 mM DTT for 10 min at room temperature. Excess DTT was removed with Micro Bio-Spin 6 columns (Bio-Rad) equilibrated with argon sparged lysis buffer. The samples were immediately labeled with 40μM CyDye
DIGE Fluor Cy3 and Cy5 saturation dyes (GE Healthcare). After 30 min at 37°C, the reaction was quenched with 2.5 mM DTT. Unreacted dyes and salts were removed using Micro Bio-Spin 6 columns (Bio-Rad) equilibrated with the first-dimension rehydration buffer (7M urea, 2M thiourea, 2% CHAPS, 0.28% DTT, and 2% IPG buffer 3–10 NL). Protein concentrations
were measured using the 2-D Quant kit (GE Healthcare). Equal amounts of the Cy3 and Cy5 maleimide labeled samples were pooled and resolved by two-dimensional electrophoresis. All experiments were replicated by swapping the dyes between treatments.
Two-dimensional gel electrophoresis
40μg of fluorescently labeled protein was diluted to 200μL with first-dimension rehydration
buffer and absorbed overnight onto 11 cm pH 3–10 IPG strips (Bio-Rad). IEF was performed on Ettan IPGphor 3 (GE Healthcare) instrument for a total of 20,000 V-h at 20°C at 50μA.
Prior to SDS-PAGE, the strips were equilibrated with rocking for 10 min in 75 mM Tris-HCl, pH 6.8, 30% glycerol, 6 M urea, 2% SDS, 0.5% DTT. The strips were loaded onto a 8–16% Pre-cast Criterion Gel and were run for approximately one hour at 200 V. A protein mixture was made in the laboratory by mixing equal amount of Cy3 and Cy5-labeled reduced proteins from a different cell lysate as a control for imaging artifacts. The bromophenol blue dye front from this sample was monitored to determine the completion of the second dimension run. After two-dimensional electrophoresis, gels were transferred to a Typhoon imager (GE Healthcare), and fluorescent spots were viewed using 532 and 633 nm lasers in conjunction with 580 and 670 nm emission filters (band pass 30 nm), respectively.
Computational modeling of the IL-4 pathway
All modeling, simulation and analyses were performed in Matlab. For Monte Carlo (MC) sim-ulations, all the networks to be analyzed were coded as ordinary differential equation (ODE) systems assuming mass action kinetics and solved using the ode23 numerical ODE solver in Matlab. The ODE system representing the largest model with all regulatory mechanisms and the parameter bounds used for the MC simulations are shown inS2 Text. The systems model of the IL-4 pathway was implemented using the Simbiology toolbox in Matlab. Equations and parameters of the model are presented inS3 Text. Derivatives of Hill curves fitted to experi-mentally measured DCFDA fluorescence were taken to represent instantaneous intracellular ROS trends. The time derivative of the fitted Hill curve,f(x), was modified toa+bf(x), wherea andbare model parameters representing baseline ROS level and a scaling factor, respectively. The modified curve was supplied to the model as an input. Simulated time coursex(t) of spe-ciesxwas also similarly scaled toy(t) =αx+βxx(t), whereαxandβxare constants defined for
speciesxand are independent of experimental conditions. Different scaling is required for dif-ferent species because the antibody used to measure each protein has difdif-ferent characteristics and the measured MFI scales differently to actual amount.
Initial estimates of parameters were obtained from [47,56]. A variation of the evolutionary strategy algorithm was developed in house and coded in Matlab to fit the model to experimen-tal data using these initial estimates. The following error function was minimized to obtain the fit:
e¼X
i
X
j
X
t
yijðtÞ eijðtÞ
eijðtÞsijðtÞ
!2
whereyij(t) is the scaled and shifted value (as described above) of thejthspecies under theith
experimental condition at timet;eij(t) represents the experimentally measured value under the
Supporting Information
S1 Fig. Dye saturation control.
(PDF)
S2 Fig. Whole cell staining.
(PDF)
S3 Fig. pSTAT6 time course shows two distinct peaks.
(PDF)
S4 Fig. Model library used for MC simulation.
(PDF)
S5 Fig. Explicitly modeling JAK.
(PDF)
S6 Fig. IL-4 signaling downregulation mechanisms.
(PDF)
S7 Fig. Total STAT6 under various experimental conditions
(PDF)
S1 Text. Regulation by SOCS and proteasomal degradation.
(PDF)
S2 Text. Monte Carlo simulations.
(PDF)
S3 Text. Systems model of the IL-4 pathway.
(PDF)
Acknowledgments
The authors would like to thank Ariel Kniss for her valuable suggestions that helped to improve the manuscript.
Author Contributions
Conceived and designed the experiments: GD MAG PB MLK. Performed the experiments: GD MAG PB. Analyzed the data: GD MAG PB. Contributed reagents/materials/analysis tools: GD. Wrote the paper: GD MAG PB MLK.
References
1. Finkel T. Signal transduction by reactive oxygen species. J Cell Biol. 2011; 194: 7–15. doi:10.1083/jcb. 201102095PMID:21746850
2. Rhee SG. Cell signaling. H2O2, a necessary evil for cell signaling. Science (80-). 2006; 312: 1882– 1883. doi:10.1126/science.1130481PMID:16809515
3. Sundaresan M, Yu ZX, Ferrans VJ, Irani K, Finkel T. Requirement for generation of H2O2 for platelet-derived growth factor signal transduction. Science (80-). 1995; 270: 296–299. Available:http://www. ncbi.nlm.nih.gov/pubmed/7569979PMID:7569979
4. DeYulia GJ Jr., Carcamo JM, Borquez-Ojeda O, Shelton CC, Golde DW, DeYulia GJ, et al. Hydrogen peroxide generated extracellularly by receptor-ligand interaction facilitates cell signaling. Proc Natl Acad Sci U S A. 2005; 102: 5044–5049. doi:10.1073/pnas.0501154102PMID:15795385
5. Mahadev K, Zilbering A, Zhu L, Goldstein BJ. Insulin-stimulated hydrogen peroxide reversibly inhibits protein-tyrosine phosphatase 1b in vivo and enhances the early insulin action cascade. J Biol Chem. 2001; 276: 21938–21942. doi:10.1074/jbc.C100109200PMID:11297536
6. Sobotta MC, Liou W, Stöcker S, Talwar D, Oehler M, Ruppert T, et al. Peroxiredoxin-2 and STAT3 form a redox relay for H2O2 signaling. Nat Chem Biol. 2014; 11: 64–70. doi:10.1038/nchembio.1695PMID: 25402766
7. Finkel T. From sulfenylation to sulfhydration: what a thiolate needs to tolerate. Sci Signal. 2012; 5: pe10. doi:10.1126/scisignal.2002943PMID:22416275
8. Rudolph TK, Freeman B a. Transduction of redox signaling by electrophile-protein reactions. Sci Sig-nal. 2009; 2: re7. doi:10.1126/scisignal.290re7PMID:19797270
9. Van Montfort RLM, Congreve M, Tisi D, Carr R, Jhoti H. Oxidation state of the active-site cysteine in protein tyrosine phosphatase 1B. Nature. 2003; 423: 773–7. doi:10.1038/nature01681PMID: 12802339
10. Salmeen A, Andersen JN, Myers MP, Meng T-CC, Hinks J a, Tonks NK, et al. Redox regulation of pro-tein tyrosine phosphatase 1B involves a sulphenyl-amide intermediate. Nature. 2003; 423: 769–773. doi:10.1038/nature01680PMID:12802338
11. Chen C-YY, Willard D, Rudolph J. Redox regulation of SH2-domain-containing protein tyrosine phos-phatases by two backdoor cysteines. Biochemistry. 2009; 48: 1399–1409. doi:10.1021/bi801973z PMID:19166311
12. Dwivedi G, Kemp ML. Systemic redox regulation of cellular information processing. Antioxid Redox Sig-nal. 2012; 16: 374–380. doi:10.1089/ars.2011.4034PMID:21939387
13. Peters GH, Frimurer TM, Olsen OH. Electrostatic evaluation of the signature motif (H/V)CX5R(S/T) in protein-tyrosine phosphatases. Biochemistry. American Chemical Society; 1998; 37: 5383–93. doi:10. 1021/bi971187iPMID:9548920
14. Tanner JJ, Parsons ZD, Cummings AH, Zhou H, Gates KS. Redox regulation of protein tyrosine phos-phatases: structural and chemical aspects. Antioxid Redox Signal. 2011; 15: 77–97. doi:10.1089/ars. 2010.3611PMID:20919935
15. Ostman A, Frijhoff J, Sandin A, Böhmer F- D. Regulation of protein tyrosine phosphatases by reversible oxidation. J Biochem. 2011; 150: 345–56. doi:10.1093/jb/mvr104PMID:21856739
16. Poole LB, Klomsiri C, Knaggs S a., Furdui CM, Nelson KJ, Thomas MJ, et al. Fluorescent and affinity-based tools to detect cysteine sulfenic acid formation in proteins. Bioconjug Chem. 2007; 18: 2004– 2017. doi:10.1021/bc700257aPMID:18030992
17. Leonard SE, Reddie KG, Carroll KS. Mining the thiol proteome for sulfenic acid modifications reveals new targets for oxidation in cells. ACS Chem Biol. 2009; 4: 783–799. doi:10.1021/cb900105qPMID: 19645509
18. Jones DP, Go YM. Mapping the cysteine proteome: analysis of redox-sensing thiols. Curr Opin Chem Biol. 2011; 15: 103–112. doi:10.1016/j.cbpa.2010.12.014PMID:21216657
19. Gupta V, Carroll KS. Sulfenic acid chemistry, detection and cellular lifetime. Biochim Biophys Acta. 2014; 1840: 847–75. doi:10.1016/j.bbagen.2013.05.040PMID:23748139
20. Pillay CS, Hofmeyr JH, Olivier BG, Snoep JL, Rohwer JM. Enzymes or redox couples? The kinetics of thioredoxin and glutaredoxin reactions in a systems biology context. Biochem J. 2009; 417: 269–275. doi:10.1042/BJ20080690PMID:18694397
21. Finn NA, Kemp ML. Pro-oxidant and antioxidant effects of N-acetylcysteine regulate doxorubicin-induced NF-kappa B activity in leukemic cells. Mol Biosyst. 2012; 8: 650–662. doi:10.1039/ c1mb05315aPMID:22134636
22. Finn NA, Findley HW, Kemp ML. A switching mechanism in doxorubicin bioactivation can be exploited to control doxorubicin toxicity. PLoS Comput Biol. 2011; 7: e1002151. doi:10.1371/journal.pcbi. 1002151PMID:21935349
23. Kembro JM, Aon MA, Winslow RL, O’Rourke B, Cortassa S. Integrating mitochondrial energetics, redox and ROS metabolic networks: a two-compartment model. Biophys J. 2013; 104: 332–343. doi: 10.1016/j.bpj.2012.11.3808PMID:23442855
24. Kholodenko B, Yaffe MB, Kolch W. Computational approaches for analyzing information flow in biologi-cal networks. Sci Signal. 2012; 5: re1. doi:10.1126/scisignal.2002961PMID:22510471
25. Sharma P, Chakraborty R, Wang L, Min B, Tremblay ML, Kawahara T, et al. Redox regulation of inter-leukin-4 signaling. Immunity. 2008; 29: 551–564. doi:10.1016/j.immuni.2008.07.019PMID:18957266
26. Kelly-Welch A, Hanson EM, Keegan AD. Interleukin-4 (IL-4) pathway. Sci STKE. 2005; 2005: cm9. doi: 10.1126/stke.2932005cm9PMID:16030287
28. Wills-Karp M, Finkelman FD. Untangling the complex web of IL-4- and IL-13-mediated signaling path-ways. Sci Signal. 2008; 1: pe55. doi:10.1126/scisignal.1.51.pe55PMID:19109238
29. Irie-Sasaki J, Sasaki T, Matsumoto W, Opavsky A, Cheng M, Welstead G, et al. CD45 is a JAK phos-phatase and negatively regulates cytokine receptor signalling. Nature. 2001; 409: 349–54. doi:10. 1038/35053086PMID:11201744
30. Yamada T, Zhu D, Saxon A, Zhang K. CD45 controls interleukin-4-mediated IgE class switch recombi-nation in human B cells through its function as a Janus kinase phosphatase. J Biol Chem. 2002; 277: 28830–28835. doi:10.1074/jbc.M201781200PMID:11994288
31. Hanson EM, Dickensheets H, Qu C-KK, Donnelly RP, Keegan AD. Regulation of the dephosphorylation of Stat6. Participation of Tyr-713 in the interleukin-4 receptor alpha, the tyrosine phosphatase SHP-1, and the proteasome. J Biol Chem. 2003; 278: 3903–3911. doi:10.1074/jbc.M211747200PMID: 12459556
32. Haque SJ, Harbor P, Tabrizi M, Yi T, Williams BRG. Protein-tyrosine phosphatase Shp-1 is a negative regulator of IL-4-and IL-13-dependent signal transduction. J Biol Chem. ASBMB; 1998; 273: 33893– 33896. PMID:9852037
33. Lu X, Chen J, Sasmono RT, Hsi ED, Sarosiek K a, Tiganis T, et al. T-cell protein tyrosine phosphatase, distinctively expressed in activated-B-cell-like diffuse large B-cell lymphomas, is the nuclear phospha-tase of STAT6. Mol Cell Biol. 2007; 27: 2166–2179. doi:10.1128/MCB.01234-06PMID:17210636
34. Lu X, Malumbres R, Shields B, Jiang X, Sarosiek K a, Natkunam Y, et al. PTP1B is a negative regulator of interleukin 4-induced STAT6 signaling. Blood. 2008; 112: 4098–4108. doi: 10.1182/blood-2008-03-148726PMID:18716132
35. Biswas S, Chida AS, Rahman I. Redox modifications of protein-thiols: emerging roles in cell signaling. Biochem Pharmacol. 2006; 71: 551–564. doi:10.1016/j.bcp.2005.10.044PMID:16337153
36. Meng T-C, Buckley D a, Galic S, Tiganis T, Tonks NK. Regulation of insulin signaling through reversible oxidation of the protein-tyrosine phosphatases TC45 and PTP1B. J Biol Chem. 2004; 279: 37716–25. doi:10.1074/jbc.M404606200PMID:15192089
37. Rider DA, Sinclair AJ, Young SP. Oxidative inactivation of CD45 protein tyrosine phosphatase may contribute to T lymphocyte dysfunction in the elderly. Mech Ageing Dev. 2003; 124: 191–198. Available: http://www.ncbi.nlm.nih.gov/pubmed/12633939PMID:12633939
38. Weibrecht I, Böhmer S-A, Dagnell M, Kappert K, Ostman A, Böhmer F-D. Oxidation sensitivity of the catalytic cysteine of the protein-tyrosine phosphatases SHP-1 and SHP-2. Free Radic Biol Med. 2007; 43: 100–10. doi:10.1016/j.freeradbiomed.2007.03.021PMID:17561098
39. Smith JK, Patil CN, Patlolla S, Gunter BW, Booz GW, Duhé RJ, et al. Identification of a redox-sensitive switch within the JAK2 catalytic domain. Free Radic Biol Med. Elsevier Inc.; 2012; 52: 1101–1110. doi: 10.1016/j.freeradbiomed.2011.12.025PMID:22281400
40. Duhe RJ, Evans GA, Erwin RA, Kirken RA, Cox GW, Farrar WL. Nitric oxide and thiol redox regulation of Janus kinase activity. Proc Natl Acad Sci. 1998; 95: 126–131. doi:10.1073/pnas.95.1.126PMID: 9419340
41. Kurdi M, Booz GW. Evidence that IL-6-type cytokine signaling in cardiomyocytes is inhibited by oxida-tive stress: parthenolide targets JAK1 activation by generating ROS. J Cell Physiol. 2007; 212: 424–31. doi:10.1002/jcp.21033PMID:17385713
42. Lam MH, Michell BJ, Fodero-Tavoletti MT, Kemp BE, Tonks NK, Tiganis T. Cellular stress regulates the nucleocytoplasmic distribution of the protein-tyrosine phosphatase TCPTP. J Biol Chem. 2001; 276: 37700–7. doi:10.1074/jbc.M105128200PMID:11479308
43. Hurd TR, James AM, Lilley KS, Murphy MP. Chapter 19 Measuring Redox Changes to Mitochondrial Protein Thiols With Redox Difference Gel Electrophoresis (Redox-Dige). Methods in Enzymology. 2009. pp. 343–361. doi:10.1016/S0076-6879(08)04419-4PMID:19348898
44. Hurd TR, Prime TA, Harbour ME, Lilley KS, Murphy MP. Detection of reactive oxygen species-sensitive thiol proteins by redox difference gel electrophoresis: Implications for mitochondrial redox signaling. J Biol Chem. 2007; 282: 22040–22051. doi:10.1074/jbc.M703591200PMID:17525152
45. Chen KC, Zhou Y, Xing K, Krysan K, Lou MF. Platelet derived growth factor (PDGF)-induced reactive oxygen species in the lens epithelial cells: the redox signaling. Exp Eye Res. 2004; 78: 1057–1067. doi: 10.1016/j.exer.2004.02.004PMID:15109912
46. Babon JJ, Kershaw NJ, Murphy JM, Varghese LN, Laktyushin A, Young SN, et al. Suppression of Cyto-kine Signaling by SOCS3: Characterization of the Mode of Inhibition and the Basis of Its Specificity. Immunity. 2012; 36: 239–250. doi:10.1016/j.immuni.2011.12.015PMID:22342841
47. Adimora NJ, Jones DP, Kemp ML. A model of redox kinetics implicates the thiol proteome in cellular hydrogen peroxide responses. Antioxid Redox Signal. Mary Ann Liebert, Inc. 140 Huguenot Street, 3rd Floor New Rochelle, NY 10801 USA; 2010; 13: 731–743. doi:10.1089/ars.2009.2968PMID:20121341
48. Kemp M, Go Y-MM, Jones DP. Nonequilibrium thermodynamics of thiol/disulfide redox systems: a per-spective on redox systems biology. Free Radic Biol Med. ELSEVIER SCIENCE INC; 2008; 44: 921– 937. doi:10.1016/j.freeradbiomed.2007.11.008PMID:18155672
49. Lukosz M, Jakob S, Büchner N, Zschauer T-C, Altschmied J, Haendeler J. Nuclear redox signaling. Antioxid Redox Signal. Mary Ann Liebert, Inc. 140 Huguenot Street, 3rd Floor New Rochelle, NY 10801 USA; 2010; 12: 713–42. doi:10.1089/ars.2009.2609PMID:19737086
50. Aon MA, Stanley BA, Sivakumaran V, Kembro JM, O’Rourke B, Paolocci N, et al. Glutathione/thiore-doxin systems modulate mitochondrial H2O2 emission: an experimental-computational study. J Gen Physiol. 2012; 139: 479–91. doi:10.1085/jgp.201210772PMID:22585969
51. Van Buul JD, Fernandez-Borja M, Anthony EC, Hordijk PL. Expression and localization of NOX2 and NOX4 in primary human endothelial cells. Antioxid Redox Signal. 2005; 7: 308–17. doi:10.1089/ars. 2005.7.308PMID:15706079
52. Stone JR, Yang S. Hydrogen peroxide: a signaling messenger. Antioxid Redox Signal. Mary Ann Lie-bert, Inc. 2 Madison Avenue Larchmont, NY 10538 USA; 2006; 8: 243–70. doi:10.1089/ars.2006.8.243 PMID:16677071
53. Gutscher M, Sobotta MC, Wabnitz GH, Ballikaya S, Meyer AJ, Samstag Y, et al. Proximity-based pro-tein thiol oxidation by H2O2-scavenging peroxidases. J Biol Chem. 2009; 284: 31532–40. doi:10.1074/ jbc.M109.059246PMID:19755417
54. Terada LS. Specificity in reactive oxidant signaling: think globally, act locally. J Cell Biol. 2006; 174: 615–623. doi:10.1083/jcb.200605036PMID:16923830
55. Chen K, Kirber MT, Xiao H, Yang Y, Keaney JF Jr. Regulation of ROS signal transduction by NADPH oxidase 4 localization. J Cell Biol. 2008; 181: 1129–1139. doi:10.1083/jcb.200709049PMID: 18573911
56. Yamada S, Shiono S, Joo A, Yoshimura A. Control mechanism of JAK/STAT signal transduction path-way. FEBS Lett. 2003; 534: 190–196. doi:10.1016/s0014-5793(02)03842-5PMID:12527385
57. Swameye I, Müller TG, Timmer J t, Sandra O, Klingmüller U, Muller TG, et al. Identification of nucleocy-toplasmic cycling as a remote sensor in cellular signaling by databased modeling. Proc Natl Acad Sci U S A. National Acad Sciences; 2003; 100: 1028–1033. doi:10.1073/pnas.0237333100PMID:12552139
58. Singh A, Jayaraman A, Hahn J. Modeling regulatory mechanisms in IL-6 signal transduction in hepato-cytes. Biotechnol Bioeng. 2006; 95: 850–62. PMID:16752369
59. Dwivedi G, Fitz L, Hegen M, Martin SW, Harrold J, Heatherington A, et al. A multiscale model of inter-leukin-6-mediated immune regulation in Crohn’s disease and its application in drug discovery and development. CPT pharmacometrics Syst Pharmacol. 2014; 3: e89. doi:10.1038/psp.2013.64PMID: 24402116
60. Parvez S, Fu Y, Li J, Long MJC, Lin H-Y, Lee DK, et al. Substoichiometric Hydroxynonenylation of a Single Protein Recapitulates Whole-Cell-Stimulated Antioxidant Response. J Am Chem Soc. 2015; 137: 10–13. doi:10.1021/ja5084249PMID:25544059
61. Persson C, Kappert K, Engstrom U, Ostman A, Sjoblom T. An antibody-based method for monitoring in vivo oxidation of protein tyrosine phosphatases. Methods. 2005; 35: 37–43. doi:10.1016/j.ymeth.2004. 07.006PMID:15588984