AMTD
8, 4095–4135, 2015An examination of the long-term CO records from MOPITT
and IASI
M. George et al.
Title Page
Abstract Introduction
Conclusions References
Tables Figures
◭ ◮
◭ ◮
Back Close
Full Screen / Esc
Printer-friendly Version Interactive Discussion
Discussion
P
a
per
|
Discussion
P
a
per
|
Discussion
P
a
per
|
Discussion
P
a
per
|
Atmos. Meas. Tech. Discuss., 8, 4095–4135, 2015 www.atmos-meas-tech-discuss.net/8/4095/2015/ doi:10.5194/amtd-8-4095-2015
© Author(s) 2015. CC Attribution 3.0 License.
This discussion paper is/has been under review for the journal Atmospheric Measurement Techniques (AMT). Please refer to the corresponding final paper in AMT if available.
An examination of the long-term CO
records from MOPITT and IASI:
comparison of retrieval methodology
M. George1, C. Clerbaux1,2, I. Bouarar3, P.-F. Coheur2, M. N. Deeter4, D. P. Edwards4, G. Francis4, J. C. Gille4, J. Hadji-Lazaro1, D. Hurtmans2, A. Inness5, D. Mao4, and H. M. Worden4
1
Sorbonne Universités, UPMC Univ. Paris 06; Université Versailles St-Quentin; CNRS/INSU, LATMOS-IPSL, Paris, France
2
Spectroscopie de l’Atmosphère, Chimie Quantique et Photophysique, Université Libre de Bruxelles (U.L.B.), Brussels, Belgium
3
Max Planck Institute for Meteorology, Hamburg, Germany
4
Atmospheric Chemistry Division, National Center for Atmospheric Research, Boulder, Colorado, USA
5
European Centre for Medium-Range Weather Forecasts, Reading, UK
Received: 12 February 2015 – Accepted: 20 March 2015 – Published: 23 April 2015 Correspondence to: M. George ([email protected])
AMTD
8, 4095–4135, 2015An examination of the long-term CO records from MOPITT
and IASI
M. George et al.
Title Page
Abstract Introduction
Conclusions References
Tables Figures
◭ ◮
◭ ◮
Back Close
Full Screen / Esc
Printer-friendly Version Interactive Discussion
Discussion
P
a
per
|
Discussion
P
a
per
|
Discussion
P
a
per
|
Discussion
P
a
per
|
Abstract
Carbon monoxide (CO) is a key atmospheric compound that can be remotely sensed by satellite on the global scale. Fifteen years of continuous observations are now avail-able from the MOPITT/Terra mission (2000 to present). Another fifteen and more years of observations will be provided by the IASI/MetOp instrument series (2007–2023>).
5
In order to study long term variability and trends, a homogeneous record is required, which is not straightforward as the retrieved products are instrument and processing dependent. The present study aims at evaluating the consistency between the CO products derived from the MOPITT and IASI missions, both for total columns and ver-tical profiles, during a six year overlap period (2008–2013). The analysis is performed
10
by first comparing the available 2013 versions of the retrieval algorithms, and second using a dedicated reprocessing of MOPITT CO profiles and columns based on the IASI a priori constraints. MOPITT v5T total columns are generally slightly higher over land (bias ranging from 0 to 13 %) than IASI v20100815 data. When IASI and MOPITT data are retrieved with the same a priori constraints, correlation coefficients are slightly
im-15
proved. Large discrepancies (total column bias over 15 %) observed in the Northern Hemisphere during the winter months are reduced by a factor of 2 to 2.5. The detailed analysis of retrieved vertical profiles compared with collocated aircraft data from the MOZAIC-IAGOS network, illustrates the advantages and disadvantages of a constant vs. a variable a priori. On one hand, MOPITT agrees better with the aircraft profiles
20
for observations with persisting high levels of CO throughout the year due to pollu-tion or seasonal fire activity (because the climatology-based a priori is supposed to be closer to the real atmospheric state). On the other hand, IASI performs better when unexpected events leading to high levels of CO occur, due to the less constrained variance-covariance matrix.
AMTD
8, 4095–4135, 2015An examination of the long-term CO records from MOPITT
and IASI
M. George et al.
Title Page
Abstract Introduction
Conclusions References
Tables Figures
◭ ◮
◭ ◮
Back Close
Full Screen / Esc
Printer-friendly Version Interactive Discussion
Discussion
P
a
per
|
Discussion
P
a
per
|
Discussion
P
a
per
|
Discussion
P
a
per
|
1 Introduction
Measuring the variability and trends in carbon monoxide (CO) on the global scale is essential as it is an ozone and carbon dioxide precursor, and it regulates the oxidizing capacity of the troposphere through its destruction cycle involving the hydroxyl radi-cal (OH) (Duncan and Logan, 2008). The background CO atmospheric loading varies
5
as a function of season and latitude and is significantly perturbed by human activities related to combustion processes: car traffic, heating/cooking systems, industrial activi-ties, etc. CO accumulates in the Northern Hemisphere (NH) during the winter months due to low solar insolation corresponding to less chemical destruction, and concentra-tions peak in early spring each year. Natural and human-induced fires also affect the
10
CO budget, in particular in boreal areas where intense fires occur during the dry season and in the Tropics where large emissions are linked to agricultural practices (Edwards et al., 2006). CO emissions inventories still present large uncertainties (Streets et al., 2013), and separating anthropogenic and biomass burning contributions is essential for attributing CO long term trends (Strode and Pawson, 2013).
15
Due to its moderate lifetime (1–3 months), CO is an excellent tracer of tropospheric pollution, which can often travel far downwind, even between continents (HTAP, 2010). CO can easily be measured by infrared remote sensing as it combines high variabil-ity and significant perturbations over background concentration levels with a strong in-frared absorption signature. Over the last two decades, Earth-observing satellites have
20
revolutionized our ability to map CO and to understand its evolving concentration on regional and global scales. At the moment several satellite missions using the thermal infrared (TIR) spectral range to sound the atmosphere are delivering CO data, includ-ing MOPITT on EOS/Terra launched at the end of 1999 (Pan et al., 1995; Deeter et al., 2003), AIRS on the EOS/Aqua satellite launched in 2002 (Aumann et al., 2003;
McMil-25
AMTD
8, 4095–4135, 2015An examination of the long-term CO records from MOPITT
and IASI
M. George et al.
Title Page
Abstract Introduction
Conclusions References
Tables Figures
◭ ◮
◭ ◮
Back Close
Full Screen / Esc
Printer-friendly Version Interactive Discussion
Discussion
P
a
per
|
Discussion
P
a
per
|
Discussion
P
a
per
|
Discussion
P
a
per
|
foreseen lifetimes. More recently, the CrIS (Gambacorta et al., 2013) and IASI/MetOp-B instruments were launched onboard the SNPP and MetOp-IASI/MetOp-B satellites, in 2011 and 2012, respectively.
Each of these thermal infrared sensors has a dedicated CO retrieval algorithm that was improved over time and has benefited from cross comparisons with other
prod-5
ucts. The Optimal Estimation (OE) retrieval approach (Rodgers, 2000) is a widely used inverse method in atmospheric sciences to derive geophysical products from recorded data. It constrains the under-determined inverse problem and provides the best esti-mates given the observations and some prior knowledge of the atmospheric state. For MOPITT and IASI, one CO vertical profile and its associated integrated total column
10
are retrieved at each sounding location and the OE provides useful diagnostic variables such as the averaging kernel matrix (the sensitivity of both the instrument and the re-trieval to the abundance of CO at different altitudes), the Degrees of Freedom for Signal (DOFS, information content of the retrieval, given by the trace of the averaging kernel matrix) and the posterior error covariance matrix. The latter includes the contributions
15
from the limited vertical sensitivity (smoothing error), from the instrumental noise, and from uncertainties to all other parameters included in the forward model (temperature profile, surface emissivity, interfering gases, spectroscopy, etc.). The retrieved CO pro-file can be expressed as a linear combination of the true atmospheric propro-file and the a priori profile, weighted by the averaging kernel matrix, plus contributions from errors
20
associated with both the observation and the other parameters (see Rodgers, 2000 for more details). A key element of the retrieval process is the choice of the a priori, which consists of a expected profile (xa) and its associated variance-covariance matrix
(Sa), to constrain the retrieved CO profile to fall within the range of physically realistic
solutions (based on the known variability of this species).
25
AMTD
8, 4095–4135, 2015An examination of the long-term CO records from MOPITT
and IASI
M. George et al.
Title Page
Abstract Introduction
Conclusions References
Tables Figures
◭ ◮
◭ ◮
Back Close
Full Screen / Esc
Printer-friendly Version Interactive Discussion
Discussion
P
a
per
|
Discussion
P
a
per
|
Discussion
P
a
per
|
Discussion
P
a
per
|
et al. (2007) compared, for 2 days in September 2004, TES retrieved CO profiles ad-justed to the MOPITT a priori with the MOPITT retrievals and also the adad-justed TES CO profiles with the MOPITT profiles vertically smoothed by the TES averaging ker-nels. Warner et al. (2007) used the MOPITT a priori profile as AIRS first guess and showed global improvements to the agreements between CO at 500 hPa from these
5
two instruments, for the 2 month time period of the INTEX-A campaign. Ho et al. (2009) applied TES a priori profiles and covariance matrix to a modified MOPITT retrieval al-gorithm, for a one month study. George et al. (2009) compared the IASI CO columns with MOPITT, AIRS and TES CO columns, adjusted with the IASI a priori assumptions, for three different months (August 2008, November 2008 and February 2009) and on
10
the global scale. Illingworth et al. (2011) compared IASI CO with MOPITT CO data over a localized region of Africa, for one day. They first retrieved the MOPITT profiles using IASI a priori assumptions and then applied the averaging kernels resulting from these new MOPITT retrievals to the IASI CO profiles. Finally, Worden et al. (2013) examined hemispheric and regional trends for CO from all four missions, from 2000 through 2011.
15
The present study compares the CO record from MOPITT and IASI on the global scale, in order to setup a framework for building a consistent long term dataset. These two sensors together already provided a 15 year record of data, including 6 years of common observation (2008–2013). The analysis is performed on both retrieved total columns and vertical profiles, and focuses on identifying differences in the retrievals
20
due to a priori assumptions. Extended comparison is performed at several locations, over the 6 year overlap period, representative of diverse geophysical situations. Sec-tion 2 describes the MOPITT and IASI instrument characteristics, as well as the current retrieval algorithms and CO products. Section 3 compares the total columns for the 2008–2013 period, first using each retrieval algorithm, and then using the IASI a
pri-25
AMTD
8, 4095–4135, 2015An examination of the long-term CO records from MOPITT
and IASI
M. George et al.
Title Page
Abstract Introduction
Conclusions References
Tables Figures
◭ ◮
◭ ◮
Back Close
Full Screen / Esc
Printer-friendly Version Interactive Discussion
Discussion
P
a
per
|
Discussion
P
a
per
|
Discussion
P
a
per
|
Discussion
P
a
per
|
2 MOPITT and IASI data
2.1 The instruments
2.1.1 Orbit, geometry and absorption spectral range
MOPITT and IASI are both sun-synchronous polar-orbiting missions designed to mea-sure the spectral radiance at the top of the atmosphere, in the infrared spectral range,
5
using a nadir geometry. IASI and MOPITT cross the equator at around 09:30 and 10:30 LT respectively, each morning and evening. To measure CO they take advan-tage of absorption in the fundamental 1-0 CO rotation-vibration band centered around 4.7 µm. Note that MOPITT also has the ability to measure the 2-0 overtone at 2.3 µm (Deeter et al., 2013). For consistency only the products derived from the inversion in
10
the thermal infrared is compared in this paper.
2.1.2 Measurement technique
The MOPITT and IASI measurement techniques differ. MOPITT uses gas filter corre-lation radiometry where the signal passes through cells containing gaseous CO in the instrument. These act as a high spectral resolution filter, matching the signature of the
15
atmospheric gas. The transmission through the gas cells is modulated by varying either cell pressure (PMC) or cell length (LMC) to create signals corresponding to high and low cell gas optical depth. These signals are then averaged (A-signals) or differenced (D-signals) for use in the retrieval of CO profiles (Edwards et al., 1999; Drummond et al., 2010). The D-signal is only significant at the target gas absorption line
frequen-20
cies, thus providing high spectral resolution information on CO abundance, while the A-signal provides information on the underlying scene such as surface temperature and emissivity. The two thermal infrared channels on MOPITT use PMC and LMC gas cells at different pressures to provide sensitivity to the pressure-broadened absorption of CO at different altitudes in the troposphere.
AMTD
8, 4095–4135, 2015An examination of the long-term CO records from MOPITT
and IASI
M. George et al.
Title Page
Abstract Introduction
Conclusions References
Tables Figures
◭ ◮
◭ ◮
Back Close
Full Screen / Esc
Printer-friendly Version Interactive Discussion
Discussion
P
a
per
|
Discussion
P
a
per
|
Discussion
P
a
per
|
Discussion
P
a
per
|
IASI is a Fourier Transform Spectrometer with a spectral coverage extending from 15.5 to 3.62 µm (645 to 2760 cm−1), associated with an imaging instrument. The spec-trometer part of the instrument is based on a Michelson interferometer, and the optical part consists of a cold box subsystem cooled to a temperature of 94 K that provides measurements in 3 spectral bands with different photo-detectors; hot optics elements
5
which form the heart of the interferometer; and a black body subsystem for calibra-tion views. The raw measurements performed by IASI are interferograms, which have to be processed to get radiances. To reduce the IASI transmission rate raw interfer-ograms are transformed into radiometrically calibrated spectra before transmission to the ground. The maximum optical path difference is±2 cm which leads to 0.5 cm−1Full
10
Width at Half Maximum resolution (apodized). The radiometric noise below 2250 cm−1 ranges between 0.1 and 0.3 K for a reference blackbody at 280 K.
2.1.3 Horizontal sampling and vertical sensitivity
MOPITT observations are made with a four-pixel linear detector array which scans across the satellite track forming a 650 km-wide swath. At nadir, the footprint of each
15
pixel is approximately 22 by 22 km. Each cross-track scan is composed of 116 pixels. It produces nearly continuous coverage within that swath as the satellite flies. IASI views the ground through a cross-track rotary scan mirror which provides±48.3◦ground cov-erage along the swath with views towards on board calibration sources every scan cycle during 8 s. The along track drift is compensated during the acquisition of each
20
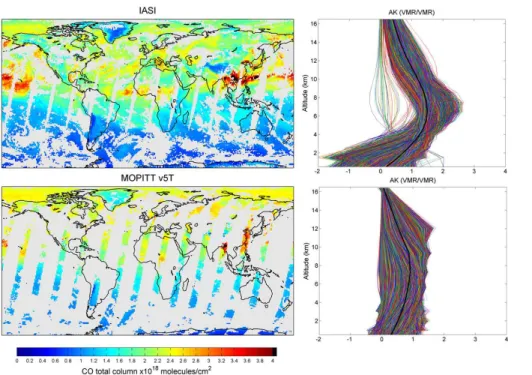
measurement. A total of 120 views are collected over a swath of∼2200 km (30 arrays of 4 individual elliptical pixels – each of which of 12 km diameter at nadir, increasing at the larger viewing angles). Figure 1 illustrates one day/morning overpasses of typi-cal CO total column maps measured by IASI and MOPITT in April 2013. For MOPITT the Earth’s surface is mostly covered in about 3 days. For IASI a global coverage is
25
AMTD
8, 4095–4135, 2015An examination of the long-term CO records from MOPITT
and IASI
M. George et al.
Title Page
Abstract Introduction
Conclusions References
Tables Figures
◭ ◮
◭ ◮
Back Close
Full Screen / Esc
Printer-friendly Version Interactive Discussion
Discussion
P
a
per
|
Discussion
P
a
per
|
Discussion
P
a
per
|
Discussion
P
a
per
|
CO is retrieved at each location with a specific vertical sensitivity (characterizing the part of the atmosphere that is sounded), which is a function of wavenumbers (posi-tion and shapes of absorp(posi-tion lines), the overlaps with other absorbing species, the concentration profile of the species, the local surface temperature/emissivity, the tem-perature profile, and the instrumental specifications (noise and spectral resolution). For
5
CO sensing in the TIR, the information is in the majority of the cases coming from the mid troposphere, as can be seen from the averaging kernels represented in Fig. 1. A key variable affecting sensitivity is temperature, with hotter surface providing gen-erally a stronger signal relative to instrument and geophysical noise and thus allow-ing retrieval of CO with a higher accuracy. Another important parameter for soundallow-ing
10
the lower part of the atmosphere is thermal contrast, which is the temperature diff er-ence between the surface and the near-surface atmosphere, which determines the instrument sensitivity to the boundary layer (Deeter et al., 2007; Clerbaux et al., 2008). Note that bright land surfaces, such as ice and desert sand, sometimes lead to poor retrievals, because of insufficiently detailed knowledge of the surface emissivity and
15
reflectivity (in the CO spectral range, solar radiation is not negligible).
2.2 Retrieved CO products
The MOPITT and IASI missions have now accumulated 15 and 7 years respectively of near-continuous global data for tropospheric CO. For this comparison we used the retrieval algorithm versions that were running in 2013 (MOPITT v5T and IASI FORLI
20
v20100815) and the retrieved CO profile products, from which integrated total columns are derived, along with their associated averaging kernel matrices (for profiles) or vec-tor (for columns). Only the data from the IASI/MetOp-A mission are analyzed here.
Table 1 provides a detailed description of the retrieved products, the a priori informa-tion, and the auxiliary data (temperature, emissivity, cloud content) for each mission.
25
AMTD
8, 4095–4135, 2015An examination of the long-term CO records from MOPITT
and IASI
M. George et al.
Title Page
Abstract Introduction
Conclusions References
Tables Figures
◭ ◮
◭ ◮
Back Close
Full Screen / Esc
Printer-friendly Version Interactive Discussion
Discussion
P
a
per
|
Discussion
P
a
per
|
Discussion
P
a
per
|
Discussion
P
a
per
|
Previous validation studies using ground-based, aircraft and satellite data have shown that CO total columns from MOPITT and IASI are retrieved with an error gen-erally below 10–15 % at mid and tropical latitudes, but can have larger errors in polar regions (MOPITT: Deeter et al., 2012, 2013; Emmons et al., 2004, 2009; IASI: George et al., 2009; Pommier et al., 2010; De Wachter et al., 2012; Kerzenmacher et al., 2012).
5
The profiles are only weakly resolved, with<1 to∼2.5 independent pieces of informa-tion, depending mostly on the thermal state of the atmosphere. A DOFS of less than 1 indicates that the a priori information dominates the calculated total column whereas two or more means that at least two independent partial columns can be retrieved. The highest sensitivity is achieved in the inter-tropical region or at mid-latitudes during
10
daytime and over land: for instance, there is a gain of 0.5 DOFS above the Northern mid-latitude continental surfaces between the morning and evening orbits (Hurtmans et al., 2012).
A major difference between MOPITT and IASI retrievals resides in the choice of the a priori, which is fixed for IASI, and variable for MOPITT. Having a variable or a static
15
a priori has implications on the retrieved dataset, with both choices presenting ad-vantages and disadad-vantages as discussed hereafter. Figure 2 represents the a priori profile(s) and the variance-covariance matrices (Sa), for MOPITT (in September 2010)
and for IASI (invariant). These were built using chemistry-transport model simulations and other available data. For MOPITT v5T the a priori profile varies as a function of
20
location and time of year and it is based on a monthly climatology of the MOZART-4 chemistry transport model. For each retrieval, the climatology is spatially and tempo-rally interpolated to match the date and location of the observation. The fixedSamatrix allows for a 30 % variability in each retrieved layer. The off-diagonal elements which define the correlations between the different layers are consistent with a short
verti-25
cal correlation length which limits the spread of information from one layer to another (Deeter et al., 2010). On the contrary, the IASI a priori consists on a single profile, and a fixed Sa matrix, built from a climatology that uses LMDz-INCA model outputs,
pri-AMTD
8, 4095–4135, 2015An examination of the long-term CO records from MOPITT
and IASI
M. George et al.
Title Page
Abstract Introduction
Conclusions References
Tables Figures
◭ ◮
◭ ◮
Back Close
Full Screen / Esc
Printer-friendly Version Interactive Discussion
Discussion
P
a
per
|
Discussion
P
a
per
|
Discussion
P
a
per
|
Discussion
P
a
per
|
ori profile is around 90±20 ppbv from the surface to the middle troposphere, and then smoothly decreases to 40 ppbv from 7 up to 19 km, which is the altitude of the last retrieved layer. TheSa matrix allows a maximum variability in the first layers (63 %),
decreases to 35 % between 5 and 6 km, to 30 % (as MOPITT) between 6 and 10 km, and is increasing again, reaching 45 % between 15 and 16 km (see Fig. 2). Off
diag-5
onal elements are calculated from the ensemble profiles, and allow the information to be projected from layers with high sensitivity to layers where the sensitivity is much weaker. The correlation length, therefore variable, is about 5 km.
3 Comparison of CO total column products for selected periods and regions
3.1 Global scale comparison
10
The comparison analysis is performed over the period extending from January 2008 to December 2013, a period when MOPITT and IASI were both in operation. As the two instruments are not onboard the same platform, neither the measurement time nor the location are exactly the same.
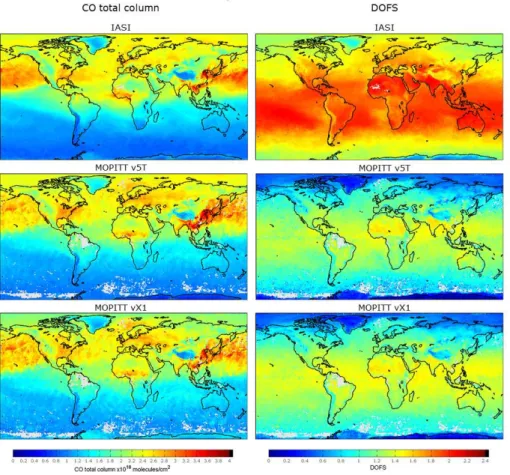
The top and middle panels of Fig. 3 show the monthly average for CO total column
15
distribution (daytime data) for April 2010 along with the monthly average of the DOFS for the profile retrieval, for each instrument. As expected, it can be seen that large concentrations of CO are found near emission sources, and plumes are transported downwind. In the NH elevated levels of CO are found above the West and East USA coasts, over Europe, and over East Asia. Due to long range transport, high CO
con-20
centrations are also observed over the Northern Pacific and Atlantic oceans. In the Tropics, elevated CO concentrations are found over the Guinea gulf countries (fires). Note that reduced CO at the location of mountains in North and South America, as well as in the Himalayas, is due to surface height. Figure 4 provides in addition a time series of zonal mean total column CO over the entire period. NH concentrations peak
25
AMTD
8, 4095–4135, 2015An examination of the long-term CO records from MOPITT
and IASI
M. George et al.
Title Page
Abstract Introduction
Conclusions References
Tables Figures
◭ ◮
◭ ◮
Back Close
Full Screen / Esc
Printer-friendly Version Interactive Discussion
Discussion
P
a
per
|
Discussion
P
a
per
|
Discussion
P
a
per
|
Discussion
P
a
per
|
the increasing solar insolation activates tropospheric chemistry (except over Siberia and Alaska fire regions where CO concentrations increase in summer). In the Tropics the CO maximum is mainly associated with fires occurring in the Amazon basin, in central and southern Africa and sometimes over Australia, with maximum in August– November. Major fires occurring in Russia in August 2010 (Yurganov et al., 2011; Krol
5
et al., 2013; R’Honi et al., 2013) and in Siberia in July 2012 (Ponomarev, 2013) are also visible on the zonal mean total column plots. The associated DOFS distributions (right panels of Fig. 3) illustrate the strong latitudinal variations due to temperature changes. The patterns look similar, but MOPITT is showing lower associated DOFS than IASI. Note that as the instruments are intrinsically different we don’t expect their DOFS
val-10
ues to be the same, and that both the a priori and the measurement covariance matrix (Se) will impact the DOFS values.
Even if the general horizontal spatial concentration patterns agree well, differences in the CO total columns can be seen when comparing the MOPITT and IASI data for the same areas/periods. In Fig. 5a representing the relative differences between IASI
15
and MOPITT v5T for one month (April 2010), more than 70 % of the plotted data do not exceed 10 % (ratio calculated from the original grid), which is the CO accuracy specifi-cation for both missions (Pan et al., 1995, and IASI Science Plan, 1998). Note that here we discuss the agreement between the two products, not the absolute accuracy which was evaluated in previous validation papers (e.g. see references provided in Sect. 2.2).
20
MOPITT concentrations are generally larger than the IASI concentrations over land, in particular close to the location of strong emission sources (USA East coast, China). In contrast, IASI concentrations are generally larger over the ocean, between 30◦S and 45◦N, and above 75◦N. Major fire events such as in Russia and Siberia (in 2010 and 2012, respectively) appear to be more marked in the IASI data, and likewise for the
25
AMTD
8, 4095–4135, 2015An examination of the long-term CO records from MOPITT
and IASI
M. George et al.
Title Page
Abstract Introduction
Conclusions References
Tables Figures
◭ ◮
◭ ◮
Back Close
Full Screen / Esc
Printer-friendly Version Interactive Discussion
Discussion
P
a
per
|
Discussion
P
a
per
|
Discussion
P
a
per
|
Discussion
P
a
per
|
It is the aim of this paper to investigate the possible sources of the differences be-tween IASI and MOPITT data measured at the same location. We expect differences to be associated with (i) the different vertical sensitivity of the two sensors, (ii) with the a priori assumptions, (iii) the auxiliary data (e.g. surface temperature, temperature profiles, emissivity, cloud information, etc.) used in the retrieval process, as well as (iv)
5
due to the different air masses sounded (different sounding angles, and between one and two hours time lag for the observation time). Because the two instruments fly on different satellites, and rely on different auxiliary datasets (temperature, clouds, etc.), only the differences associated with the a priori assumptions are studied in this paper.
3.2 Impact of the change of the a priori at global scale
10
To study the impact of a change of a priori on the retrieval we made a two-step com-parison: first with the native retrieved data, and second with a dedicated retrieval chain set-up at the National Center for Atmospheric Research (NCAR), where the MOPITT data were reprocessed using the IASI a priori profile andSa matrix (hereafter refered as MOPITT vX1). Since theSamatrix cannot be extrapolated or interpolated and has
15
to fulfill necessary properties (it has to be positive definite and the sum of its elements has to be conserved), a challenging step in this process was to convert the IASI Sa
matrix expressed in altitude and partial columns into a MOPITT-compatible matrix, ex-pressed in pressure levels and log(VMR). This was achieved by building a new profile and matrix from the original profiles in VMR used for theSamatrix generation in FORLI,
20
on a common 35-pressure layer grid. Indeed the MOPITT algorithm uses a priori infor-mation on a 35-pressure grid to compute 10-pressure grid profiles.
The CO total column distribution measured by MOPITT in April 2010 and repro-cessed with the IASI a priori constraints (MOPITT vX1) is shown in Fig. 3 (bottom part). Figure 5 provides the relative difference plots between IASI and MOPITT v5T, MOPITT
25
AMTD
8, 4095–4135, 2015An examination of the long-term CO records from MOPITT
and IASI
M. George et al.
Title Page
Abstract Introduction
Conclusions References
Tables Figures
◭ ◮
◭ ◮
Back Close
Full Screen / Esc
Printer-friendly Version Interactive Discussion
Discussion
P
a
per
|
Discussion
P
a
per
|
Discussion
P
a
per
|
Discussion
P
a
per
|
over the polar regions, where the v5T concentrations are larger than the vX1 ones at the North Pole (15 % on average between 60 and 90◦N) and smaller over Antarctica (−60 % on average between 60 and 90◦S). Between 60◦S and 60◦N, the differences generally range between−5 and 5 %, with the MOPITT v5T columns being larger than the vX1 ones above emissions sources (EU East coast, Mexico and China).
5
From Fig. 5a and c we see that the reprocessing of MOPITT data slightly improves the agreement with IASI over the USA East coast and China, i.e. for regions where emission sources are usually high. Between 20◦S and 20◦N and between 20 and 60◦N, the statistics are alike: when looking at the histograms (Fig. 5i–m), the probability density functions (100×(IASI-MOPITT v5T)/IASI and 100×(IASI-MOPITT vX1)/IASI)
10
look similar. But in the Southern Hemisphere between 20 and 60◦S the reprocessing of MOPITT does not reconcile the differences with IASI, in fact the difference percentages are larger for the comparison with MOPITT vX1 (the probability density functions peaks at−10 %, and it was−5 % with v5T), and it is the same at high Northern latitudes (20 % for vX1 compared to 5 % for v5T). Finally, the differences are about the same amplitude
15
in Antarctica, but with the opposite sign (−30 % for vX1 and+30 % for v5T). These differences will be discussed in details in the next two sections.
3.3 Impact of the change of a priori on selected regions
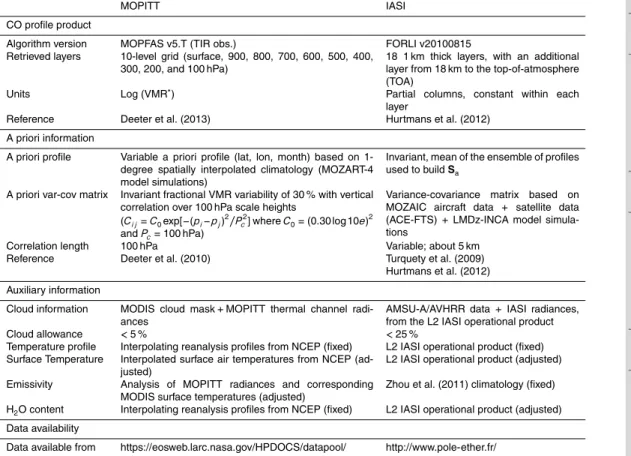
In order to investigate the observed differences, a detailed analysis was performed over the six-year seasonal record, on 12 selected regions spread over the globe (listed
20
in Table 2, and also identified by green boxes in Fig. 8). The areas are representative of different ecosystems (water, sand, forest) and of various seasonal CO atmospheric content (cities, fire seasonal activity, background). The size of the grid boxes (5◦×5◦for nine regions and 2◦×2◦ for three cities) was chosen so that the number of data is sta-tistically significant for each instrument. For each box, 15 day averages are calculated,
25
AMTD
8, 4095–4135, 2015An examination of the long-term CO records from MOPITT
and IASI
M. George et al.
Title Page
Abstract Introduction
Conclusions References
Tables Figures
◭ ◮
◭ ◮
Back Close
Full Screen / Esc
Printer-friendly Version Interactive Discussion
Discussion
P
a
per
|
Discussion
P
a
per
|
Discussion
P
a
per
|
Discussion
P
a
per
|
the absolute biases, along with their SD, as well as the correlation coefficients for each region.
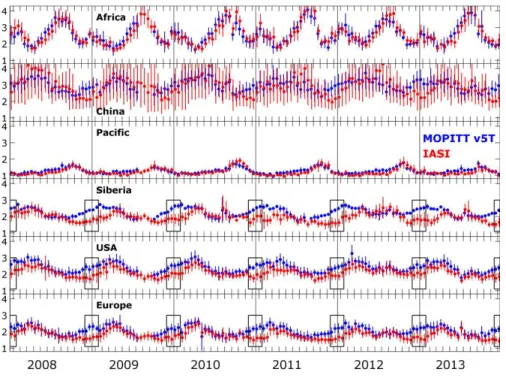
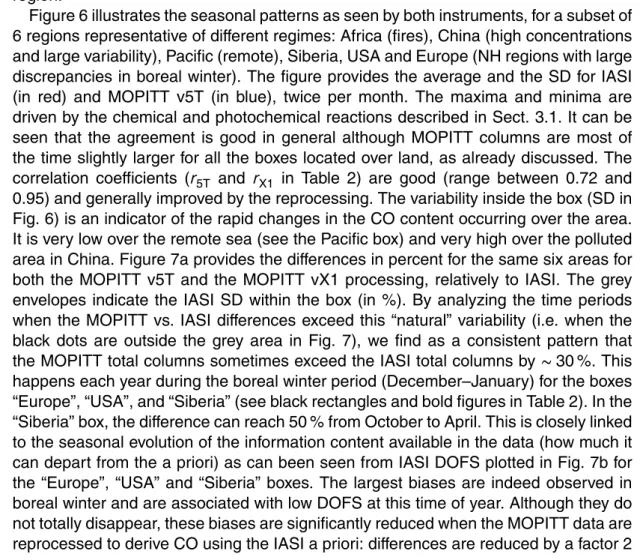
Figure 6 illustrates the seasonal patterns as seen by both instruments, for a subset of 6 regions representative of different regimes: Africa (fires), China (high concentrations and large variability), Pacific (remote), Siberia, USA and Europe (NH regions with large
5
discrepancies in boreal winter). The figure provides the average and the SD for IASI (in red) and MOPITT v5T (in blue), twice per month. The maxima and minima are driven by the chemical and photochemical reactions described in Sect. 3.1. It can be seen that the agreement is good in general although MOPITT columns are most of the time slightly larger for all the boxes located over land, as already discussed. The
10
correlation coefficients (r5T and rX1 in Table 2) are good (range between 0.72 and
0.95) and generally improved by the reprocessing. The variability inside the box (SD in Fig. 6) is an indicator of the rapid changes in the CO content occurring over the area. It is very low over the remote sea (see the Pacific box) and very high over the polluted area in China. Figure 7a provides the differences in percent for the same six areas for
15
both the MOPITT v5T and the MOPITT vX1 processing, relatively to IASI. The grey envelopes indicate the IASI SD within the box (in %). By analyzing the time periods when the MOPITT vs. IASI differences exceed this “natural” variability (i.e. when the black dots are outside the grey area in Fig. 7), we find as a consistent pattern that the MOPITT total columns sometimes exceed the IASI total columns by∼30 %. This
20
happens each year during the boreal winter period (December–January) for the boxes “Europe”, “USA”, and “Siberia” (see black rectangles and bold figures in Table 2). In the “Siberia” box, the difference can reach 50 % from October to April. This is closely linked to the seasonal evolution of the information content available in the data (how much it can depart from the a priori) as can been seen from IASI DOFS plotted in Fig. 7b for
25
AMTD
8, 4095–4135, 2015An examination of the long-term CO records from MOPITT
and IASI
M. George et al.
Title Page
Abstract Introduction
Conclusions References
Tables Figures
◭ ◮
◭ ◮
Back Close
Full Screen / Esc
Printer-friendly Version Interactive Discussion
Discussion
P
a
per
|
Discussion
P
a
per
|
Discussion
P
a
per
|
Discussion
P
a
per
|
for “Europe” (absolute mean bias of 35 % in December–January compared to 18.1 % after the reprocessing) and for “USA” (27.2 vs. 11.4 %), and by a factor 2.5 for the “Siberia” region (35.9 vs. 12.9 %) (See Table 2). Surprisingly, the use of the same a priori information slightly increases the biases for some other regions (Pacific, Atlantic and Mexico City), for which we have no clear explanation.
5
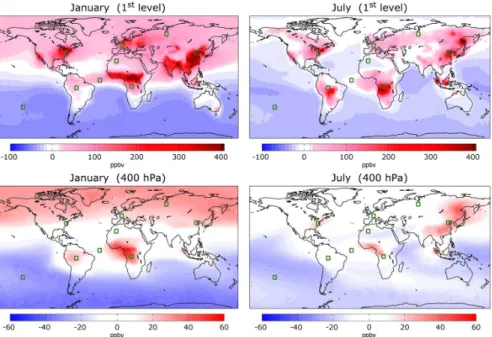
A global map of the differences in a priori for both missions is provided in Fig. 8, which shows the global difference between the IASI and MOPITT a priori CO data, for both January and July, at the lowest vertical level and at 400 hPa (∼7 km). The larger differences are found near the surface, close to pollution and fire emission sources, mostly in the Northern Hemisphere, and peak in winter over the selected areas as
10
discussed in Sect. 3.2. An in-depth look at the retrieved profiles will provide more infor-mation on how the a priori profiles and associatedSa matrix and actual observations
combine.
4 Comparison of CO profiles products: case studies
4.1 General description
15
Even more than for total column values, the shape of the retrieved CO profiles will be determined by the vertical instrumental sensitivity, modulated by the thermal contrast which governs the sensitivity to the lower atmospheric layers, and by the a priori as-sumptions. If the measurement sensitivity is low and/or the background covariance is small relative to that of the measurement, then the retrieval tends toward the a priori
20
profile value at these altitudes. When the a priori profiles differ significantly for IASI and MOPITT, large differences can appear in the retrieved profile products.
As explained in Sect. 2.2, the IASI a priori profile is always the same, and the Sa
matrix allows a large variability, in particular near the surface. On the contrary MOPITT v5T a priori profiles rely on a monthly/latitudinal varying climatology, and theSamatrix
25
AMTD
8, 4095–4135, 2015An examination of the long-term CO records from MOPITT
and IASI
M. George et al.
Title Page
Abstract Introduction
Conclusions References
Tables Figures
◭ ◮
◭ ◮
Back Close
Full Screen / Esc
Printer-friendly Version Interactive Discussion
Discussion
P
a
per
|
Discussion
P
a
per
|
Discussion
P
a
per
|
Discussion
P
a
per
|
to compare the profiles from both the original IASI and MOPITT v5T products, and the profiles obtained after the reprocessing (MOPITT vX1). Figure 9 illustrates a typi-cal finding. It shows the CO profiles for one day of observation (9 April 2010) for the “Europe” box, when high levels of CO were observed. The total column means are similar for each product but the shape of the profiles differs. We see that the MOPITT
5
v5T retrieved profiles remain quite close to the a priori profiles near the surface, and depart at around 400 hPa, where its maximum sensitivity lies. This corresponds also to the altitude where the Pressure Modulated Cell (PMC) channels provide most in-formation. The quasi-diagonal MOPITT Sa matrix limits the “extrapolation” effects to
the adjacent levels. For IASI, it can be seen that the retrieved profiles depart from the
10
a priori at all altitudes but especially near the surface given the high variance of itsSa
matrix at this altitude. Interestingly, for MOPITT vX1, the shape of the profiles differs from the MOPITT v5T profiles and departs more from the a priori. However MOPITT vX1 profiles do not show the large concentrations at the surface that IASI profiles do, despite the fact that the same a priori is used. This could point to a weaker sensitivity
15
of MOPITT retrieval to surface CO concentrations. Another possible explanation lies in the constraint applied to the measurements (theSe in the OE), which might be looser in FORLI, increasing further the range of variability.
In order to go further in the analysis we selected three illustrative cases, representa-tive of different situations, for which aircraft profile data from the MOZAIC-IAGOS
pro-20
gram (Nédélec et al., 2003; http://www.iagos.org/) were available within a±12 h time slot. Figures 10 to 12 show for different locations the IASI, MOPITT v5T and MOPITT vX1 averaged profiles with their corresponding a priori profiles, along with the collo-cated MOZAIC-IAGOS profile. All data within 0.5◦ of the MOZAIC-IAGOS profile path (which corresponds to 36 to 56 km, depending on latitude) were selected and then
av-25
AMTD
8, 4095–4135, 2015An examination of the long-term CO records from MOPITT
and IASI
M. George et al.
Title Page
Abstract Introduction
Conclusions References
Tables Figures
◭ ◮
◭ ◮
Back Close
Full Screen / Esc
Printer-friendly Version Interactive Discussion
Discussion
P
a
per
|
Discussion
P
a
per
|
Discussion
P
a
per
|
Discussion
P
a
per
|
provided for each product, in order to evaluate the altitudes where the retrievals are mostly sensitive.
4.2 Nagoya case (high CO in the mid-low troposphere)
For the “Nagoya” case plotted in Fig. 10, the MOZAIC-IAGOS profile shows a pollution plume around 600 hPa (∼4 km) measured on 25 June 2012. The shape of the
collo-5
cated satellite retrieved profiles differs, with MOPITT peaking around 300–400 hPa and at the surface, and IASI peaking at lower troposphere and at the surface. The MO-PITT averaging kernel functions show that the retrieval is most sensitive just above the plume altitude, where the MOPITT v5T profile peaks. Due to the fact that there is no sensitivity at the surface the retrieved CO sticks to its a priori at this altitude. The IASI
10
averaging kernel functions show a sensitivity of the retrieval slightly lower in altitude, with a maximum around 700 hPa, as well as a slight sensitivity near the surface. The IASI retrieved profile underestimates the amount of CO around 600 hPa and overes-timates it at surface level. Due to the loosely constrained covariance matrix near the surface, the CO amount “seen” by IASI is extrapolated toward the surface. The
MO-15
PITT vX1 profile lies “in between”, with lower concentrations than the v5T one in the first layers close to the surface, and larger concentrations than the IASI profile above 400 hPa.
4.3 Caracas case (high surface CO with sensitivity at the surface)
The case at the Caracas airport (Fig. 11) shows a typical aircraft profile measured at
20
this location, with CO mixing ratios reaching more than 300 ppbv around 900–800 hPa (1–2 km). The total columns retrieved by both MOPITT v5T and IASI are quite similar, but again the profiles shape differs. The IASI retrieval shows some sensitivity close to the surface as the averaging kernels functions associated with the lower altitudes peak between 700 and 900 hPa. The IASI profile somewhat departs from the a priori for the
25
AMTD
8, 4095–4135, 2015An examination of the long-term CO records from MOPITT
and IASI
M. George et al.
Title Page
Abstract Introduction
Conclusions References
Tables Figures
◭ ◮
◭ ◮
Back Close
Full Screen / Esc
Printer-friendly Version Interactive Discussion
Discussion
P
a
per
|
Discussion
P
a
per
|
Discussion
P
a
per
|
Discussion
P
a
per
|
hand, the altitude of MOPITT retrieval sensitivity maximum is higher, around 300 hPa (∼9 km) and its sensitivity is low near the surface. MOPITT does not capture the plume (−40 ppbv compared to IASI near the surface), and the retrieved profiles (v5T and vX1) are close to their a priori profiles (and the climatology is far from the observation in this case).
5
4.4 Frankfurt case (high CO at the surface)
The “Frankfurt” case (Fig. 12) shows large mixing ratios measured by the MOZAIC-IAGOS aircraft near the surface. Both MOPITT and IASI are sensitive in the mid tro-posphere (between 500 and 300 hPa) but not at the surface. All the retrieved profiles stick to their a priori profiles, especially at the surface. The MOPITT v5T profile agrees
10
very well with the MOZAIC-IAGOS profile, sticking to the a priori profile which in this case shows large mixing ratios at the surface (reaching more than 250 ppb). For IASI, the plume is missed and for MOPITT vX1, the profile has a similar behavior than IASI profile.
These three cases were selected to illustrate the impacts of choosing a single or
15
a variant a priori profile and a strongly or loosely constrained Sa matrix. In
sum-mary, when there is a good sensitivity of the satellite instrument at the altitude of the plume, both instruments manage to detect the CO increase, but MOPITT generally puts it where its maximum sensitivity lies (around 300–400 hPa), whereas IASI tends to project high CO observed in the middle-troposphere towards the surface (because
20
of the 5 km correlation length). For the altitudes where the instrument is not sensitive, in particular at the surface level when the thermal contrast is low, each instrument sticks to its a priori. This leads to a better agreement for the MOPITT retrieved profile when the measured CO profile at one location is close to the climatology used to build the a priori, which is usually the case for seasonal fires and highly polluted areas (e.g.
25
AMTD
8, 4095–4135, 2015An examination of the long-term CO records from MOPITT
and IASI
M. George et al.
Title Page
Abstract Introduction
Conclusions References
Tables Figures
◭ ◮
◭ ◮
Back Close
Full Screen / Esc
Printer-friendly Version Interactive Discussion
Discussion
P
a
per
|
Discussion
P
a
per
|
Discussion
P
a
per
|
Discussion
P
a
per
|
In order to confirm the important role of the choice of the a priori assumptions and especially the weight of theSa matrix, we also performed some tests processing the
IASI algorithm with the MOPITTSamatrix (but with the single IASI a priori profile). As
expected, the reprocessed IASI profiles (not shown here) show lower CO concentration than the native IASI profiles near the surface because the allowed variability (used for
5
MOPITT) around the a priori profile is lower.
5 Discussion and conclusion
CO is a key atmospheric species to be analyzed on the global scale, as a precursor of other gases, and as a sink for OH, which contributes largely to the removal of many pollutants. Since the year 2000 there have been several satellite borne instruments able
10
to map CO on the global scale, including MOPITT and IASI, two different instruments that have provided long term observations for CO from space. Because of the ill-posed character of the inverse problem, the choice of the a priori impacts strongly on the retrieved profiles and columns. We have investigated this by reprocessing a six-year MOPITT dataset using the same a priori constraints as those used for IASI. For total
15
columns we found that it leads to a better agreement for source regions and periods of low sensitivity (such as boreal winter months at mid-latitude) where the differences in total columns are largely reduced, but it is surprisingly not the case everywhere and the global differences are even larger at some locations.
For vertical profiles the comparison was achieved above selected sites where
correl-20
ative aircraft measurements were available. We show that when the sensitivity is good, both instruments detect CO concentrations but as expected the shape of the profiles differs. When the sensitivity is low, MOPITT retrieved CO profiles are closer to the air-craft ones than IASI when the a priori profile is already close to the truth. When the opposite occurs (large variation around the a priori profile) IASI provides a more
real-25
AMTD
8, 4095–4135, 2015An examination of the long-term CO records from MOPITT
and IASI
M. George et al.
Title Page
Abstract Introduction
Conclusions References
Tables Figures
◭ ◮
◭ ◮
Back Close
Full Screen / Esc
Printer-friendly Version Interactive Discussion
Discussion
P
a
per
|
Discussion
P
a
per
|
Discussion
P
a
per
|
Discussion
P
a
per
|
which limits our ability to generalize these findings. Note that data with a single a priori are also easier to interpret.
MOPITT and IASI are currently both being assimilated into the Monitoring Atmo-spheric Composition and Climate (MACC) system (the pre-operational Copernicus At-mosphere Service of the European Union, see http://www.copernicus.eu/), which
pro-5
vides analyses and forecasts of global reactive gases and aerosol fields (Inness et al., 2013). The assimilation system relies on CO total column and averaging kernel infor-mation, provided by retrieval algorithms described in this paper. Known discrepancies exist between the model and the CO satellite observed data, which have been re-ported in previous publications (e.g. Stein et al., 2014), but also among the satellite
10
data themselves as demonstrated here. This is accounted for in the assimilation pro-cess by using a bias correction scheme for the CO data. Validation with ground based observations (Wagner et al., 2015) pointed to the need for a more detailed assessment of both datasets, and clearer identification of where differences come from. This work is a step in that direction.
15
On a longer term/climate perspective, as trend studies rely on continued and unbi-ased long-term data records, and as only the IASI program will continue in the future, this work is also paving the way for establishing a long term compatible record for these two valuable datasets. MOPITT initiated a record of more than 15 years, which is being continued for the next>30 years by the IASI series of instruments, with the
20
launch of MetOp-C currently scheduled at the end of 2018, and the IASI-New Gen-eration intruments to be embarked on the MetOp-SG/Sentinel5 Plateforms (Clerbaux and Crevoisier, 2013; Crevoisier et al., 2014). A systematic processing of both datasets using the same a priori assumptions is also foreseen in the framework of the EU-FP7 projects QA4ECV.
25
Acknowledgements. The French scientists are very grateful to NCAR and its visitor program,
AMTD
8, 4095–4135, 2015An examination of the long-term CO records from MOPITT
and IASI
M. George et al.
Title Page
Abstract Introduction
Conclusions References
Tables Figures
◭ ◮
◭ ◮
Back Close
Full Screen / Esc
Printer-friendly Version Interactive Discussion
Discussion
P
a
per
|
Discussion
P
a
per
|
Discussion
P
a
per
|
Discussion
P
a
per
|
France). The IASI L1 data are distributed in near real time by EUMETSAT through the Eu-metCast system distribution. The MOPITT project is supported by the NASA Earth Observing System (EOS) Program. The MOPITT team also acknowledges support under NASA grant NNX11AE19G. The authors acknowledge the European Commission for the support to the MOZAIC project (1994–2003) and the preparatory phase of IAGOS (2005–2012). The
LAT-5
MOS team also acknowledges the French Ether atmospheric database (www.pole-ether.fr) for providing the IASI L1C data and L2 temperature data, as well as CNES and CNRS for financial support. This work is also part of the EUMETSAT/O3M-SAF project. The research in Belgium is funded by the Belgian State Federal Office for Scientific, Technical and Cultural Affairs and the European Space Agency (ESA Prodex arrangement 4000111403 IASI.Flow) and by the
10
EU-FP7 projects QA4ECV (grant agreement 607405) and PANDA (grant agreement 606719). P.-F. Coheur is Senior Research Associate with F.R.S-FNRS.
References
Aumann, H. H., Chahine, M. T., Gautier, C., Goldberg, M. D., Kalnay, E., McMillin, L. M., Rever-comb, H., Rosenkranz, P. W., Smith, W. L., Staelin, D. H., Strow, L. L., and Susskind, J.:
15
AIRS/AMSU/HSB on the Aqua mission: design, science objectives, data products, and pro-cessing systems, IEEE T. Geosci. Remote, 41, 2, 253–264, 2003.
Beer, R.: TES on the AURA mission: scientific objectives, measurements and analysis overview, IEEE T. Geosci. Remote, 44, 1102–1105, 2006.
Clerbaux, C. and Crevoisier, C.: New Directions: infrared remote sensing of
20
the troposphere from satellite: less, but better, Atmos. Environ., 72, 24–26 doi:10.1016/j.atmosenv.2013.01.057, 2013.
Clerbaux, C., Hadji-Lazaro, J., Payan, S., Camy-Peyret, C., Wang, J., Edwards, D. P., and Luo, M.: Retrieval of CO from nadir remote-sensing measurements in the infrared by use of four different inversion algorithms, Appl. Optics, 41, 7068–7078, doi:10.1364/AO.41.007068,
25
2002.
AMTD
8, 4095–4135, 2015An examination of the long-term CO records from MOPITT
and IASI
M. George et al.
Title Page
Abstract Introduction
Conclusions References
Tables Figures
◭ ◮
◭ ◮
Back Close
Full Screen / Esc
Printer-friendly Version Interactive Discussion
Discussion
P
a
per
|
Discussion
P
a
per
|
Discussion
P
a
per
|
Discussion
P
a
per
|
Clerbaux, C., Boynard, A., Clarisse, L., George, M., Hadji-Lazaro, J., Herbin, H., Hurtmans, D., Pommier, M., Razavi, A., Turquety, S., Wespes, C., and Coheur, P.-F.: Monitoring of atmo-spheric composition using the thermal infrared IASI/MetOp sounder, Atmos. Chem. Phys., 9, 6041–6054, doi:10.5194/acp-9-6041-2009, 2009.
Crevoisier, C., Clerbaux, C., Guidard, V., Phulpin, T., Armante, R., Barret, B., Camy-Peyret, C.,
5
Chaboureau, J.-P., Coheur, P.-F., Crépeau, L., Dufour, G., Labonnote, L., Lavanant, L., Hadji-Lazaro, J., Herbin, H., Jacquinet-Husson, N., Payan, S., Péquignot, E., Pierangelo, C., Sel-litto, P., and Stubenrauch, C.: Towards IASI-New Generation (IASI-NG): impact of improved spectral resolution and radiometric noise on the retrieval of thermodynamic, chemistry and climate variables, Atmos. Meas. Tech., 7, 4367–4385, doi:10.5194/amt-7-4367-2014, 2014.
10
Deeter, M. N., Emmons, L. K., Francis, G. L., Edwards, D. P., Gille, J. C., Warner, J. X., Khattatov, B., Ziskin, D., Lamarque, J. F., Ho, S. P., Yudin, V., Attié, J. L., Packman, D., Chen, J., Mao, D., and Drummond, J. R.: Operational carbon monoxide retrieval algo-rithm and selected results for the MOPITT instrument, J. Geophys. Res., 108, 4399, doi:10.1029/2002JD003186, 2003.
15
Deeter, M. N., Edwards, D. P., Gille, J. C., and Drummond, J. R.: Sensitivity of MOPITT ob-servations to carbon monoxide in the lower troposphere, J. Geophys. Res., 112, D24306, doi:10.1029/2007JD008929, 2007.
Deeter, M. N., Edwards, D. P., Gille, J. C, Emmons, L. K., Francis, G., Ho, S.-P., Mao, D., Masters, D., Worden, H., Drummond, J. R., and Novelli, P. C.: The MOPITT version 4 CO
20
product: algorithm enhancements, validation, and long-term stability, J. Geophys. Res., 115, D07306, doi:10.1029/2009JD013005, 2010.
Deeter, M. N., Worden, H. M., Edwards, D. P., Gille, J. C., and Andrews, A. E.: Evaluation of MO-PITT retrievals of lower-tropospheric carbon monoxide over the United States, J. Geophys. Res., 117, D13306, doi:10.1029/2012JD017553, 2012.
25
Deeter, M. N., Martínez-Alonso, S., Edwards, D. P., Emmons, L. K., Gille, J. C., Worden, H. M., Pittman, J. V., Daube, B. C., and Wofsy, S. C.: Validation of MOPITT Version 5 thermal-infrared, near-thermal-infrared, and multispectral carbon monoxide profile retrievals for 2000–2011, J. Geophys. Res., 118, 6710–6725, doi:10.1002/jgrd.50272, 2013.
De Wachter, E., Barret, B., Le Flochmoën, E., Pavelin, E., Matricardi, M., Clerbaux, C.,
Hadji-30
AMTD
8, 4095–4135, 2015An examination of the long-term CO records from MOPITT
and IASI
M. George et al.
Title Page
Abstract Introduction
Conclusions References
Tables Figures
◭ ◮
◭ ◮
Back Close
Full Screen / Esc
Printer-friendly Version Interactive Discussion
Discussion
P
a
per
|
Discussion
P
a
per
|
Discussion
P
a
per
|
Discussion
P
a
per
|
Drummond, J. R., Zou, J., Nichitiu, F., Kar, J., Deschambaut, R., and Hackett, J.: A review of 9-year performance and operation of the MOPITT instrument, Adv. Space Res., 45, 760–774, doi:10.1016/j.asr.2009.11.019, 2010.
Duncan, B. N. and Logan, J. A.: Model analysis of the factors regulating the trends and vari-ability of carbon monoxide between 1988 and 1997, Atmos. Chem. Phys., 8, 7389–7403,
5
doi:10.5194/acp-8-7389-2008, 2008.
Edwards, D. P., Halvorson, C. M., and Gille, J. C.: Radiative transfer modeling for the EOS Terra satellite Measurement of Pollution in the Troposphere (MOPITT) instrument, J. Geophys. Res., 104, 16755–16775, doi:10.1029/1999JD900167, 1999.
Edwards, D. P., Emmons, L. K., Gille, J. C., Chu, A., Attié, J.-L., Giglio, L., Wood, S. W.,
Hay-10
wood, J., Deeter, M. N., Massie, S. T., Ziskin, D. C., and Drummond, J. R.: Satellite observed pollution from Southern Hemisphere biomass burning, J. Geophys. Res., 111, D14312, doi:10.1029/2005JD006655, 2006.
Emmons, L. K., Deeter, M. N., Gille, J. C., Edwards, D. P., Attié, J.-L., Warner, J., Ziskin, D., Francis, G., Khattatov, B., Yudin, V., Lamarque, J.-F., Ho, S.-P., Mao, D., Chen, J. S.,
Drum-15
mond, J., Novelli, P., Sachse, G., Coffey, M. T., Hannigan, J. W., Gerbig, C., Kawakami, S., Kondo, Y., Takegawa, N., Schlager, H., Baehr, J., and Ziereis, H.: Validation of Measure-ments of Pollution in the Troposphere (MOPITT) CO retrievals with aircraft in situ profiles, J. Geophys. Res., 109, D03309, doi:10.1029/2003JD004101, 2004.
Emmons, L. K., Edwards, D. P., Deeter, M. N., Gille, J. C., Campos, T., Nédélec, P., Novelli, P.,
20
and Sachse, G.: Measurements of Pollution In The Troposphere (MOPITT) validation through 2006, Atmos. Chem. Phys., 9, 1795–1803, doi:10.5194/acp-9-1795-2009, 2009.
Gambacorta, A., Barnet, C., Wolf, W., King, T., Maddy, E., Strow, L., Xiong. X., Nalli, N., and Goldberg, M.: An experiment using high spectral resolution NPP CrIS measurements for atmospheric trace gases: carbon monoxide retrievals impact study, IEEE Geosci. Remote
25
Sens. Lett., 11, 9, 1639–1643, doi:10.1109/LGRS.2014.2303641, 2014.
George, M., Clerbaux, C., Hurtmans, D., Turquety, S., Coheur, P.-F., Pommier, M., Hadji-Lazaro, J., Edwards, D. P., Worden, H., Luo, M., Rinsland, C., and McMillan, W.: Carbon monoxide distributions from the IASI/METOP mission: evaluation with other space-borne re-mote sensors, Atmos. Chem. Phys., 9, 8317–8330, doi:10.5194/acp-9-8317-2009, 2009.
30
AMTD
8, 4095–4135, 2015An examination of the long-term CO records from MOPITT
and IASI
M. George et al.
Title Page
Abstract Introduction
Conclusions References
Tables Figures
◭ ◮
◭ ◮
Back Close
Full Screen / Esc
Printer-friendly Version Interactive Discussion
Discussion
P
a
per
|
Discussion
P
a
per
|
Discussion
P
a
per
|
Discussion
P
a
per
|
Emission Spectrometer (TES) and Measurements of Pollution in the Troposphere (MO-PITT), J. Geophys. Res., 114, D21307, doi:10.1029/2009JD012242, 2009.
Hemispheric Transport of Air Pollution (HTAP): Part 1: Ozone and Particulate matter, United Na-tions PublicaNa-tions, available at: http://www.htap.org/publicaNa-tions/assessment_reports.htm, 2010.
5
Hurtmans, D., Coheur, P.-F., Wespes, C., Clarisse, L., Scharf, O., Clerbaux, C., Hadji-Lazaro, J., George, M., and Turquety, S.: FORLI radiative transfer and retrieval code for IASI, J. Quant. Spectrosc. Ra., 113, 1391–1408, doi:10.1016/j.jqsrt.2012.02.036, 2012.
IASI Science Plan, C. Camy-Peyret, J. Eyre et al., ISSWG/Eumetsat, available at: http://smsc. cnes.fr/IASI/IASI_Science_Plan_Issue1_released_version.pdf, 1998.
10
Illingworth, S. M., Remedios, J. J., Boesch, H., Ho, S.-P., Edwards, D. P., Palmer, P. I., and Gonzi, S.: A comparison of OEM CO retrievals from the IASI and MOPITT instruments, Atmos. Meas. Tech., 4, 775–793, doi:10.5194/amt-4-775-2011, 2011.
Inness, A., Baier, F., Benedetti, A., Bouarar, I., Chabrillat, S., Clark, H., Clerbaux, C., Coheur, P., Engelen, R. J., Errera, Q., Flemming, J., George, M., Granier, C., Hadji-Lazaro, J.,
Huij-15
nen, V., Hurtmans, D., Jones, L., Kaiser, J. W., Kapsomenakis, J., Lefever, K., Leitão, J., Razinger, M., Richter, A., Schultz, M. G., Simmons, A. J., Suttie, M., Stein, O., Thépaut, J.-N., Thouret, V., Vrekoussis, M., Zerefos, C., and the MACC team: The MACC reanalysis: an 8 yr data set of atmospheric composition, Atmos. Chem. Phys., 13, 4073–4109, doi:10.5194/acp-13-4073-2013, 2013.
20
Kerzenmacher, T., Dils, B., Kumps, N., Blumenstock, T., Clerbaux, C., Coheur, P.-F., De-moulin, P., García, O., George, M., Griffith, D. W. T., Hase, F., Hadji-Lazaro, J., Hurtmans, D., Jones, N., Mahieu, E., Notholt, J., Paton-Walsh, C., Raffalski, U., Ridder, T., Schneider, M., Servais, C., and De Mazière, M.: Validation of IASI FORLI carbon monoxide retrievals using FTIR data from NDACC, Atmos. Meas. Tech., 5, 2751–2761, doi:10.5194/amt-5-2751-2012,
25
2012.
Krol, M., Peters, W., Hooghiemstra, P., George, M., Clerbaux, C., Hurtmans, D., McInerney, D., Sedano, F., Bergamaschi, P., El Hajj, M., Kaiser, J. W., Fisher, D., Yershov, V., and Muller, J.-P.: How much CO was emitted by the 2010 fires around Moscow?, Atmos. Chem. Phys., 13, 4737–4747, doi:10.5194/acp-13-4737-2013, 2013.
30
AMTD
8, 4095–4135, 2015An examination of the long-term CO records from MOPITT
and IASI
M. George et al.
Title Page
Abstract Introduction
Conclusions References
Tables Figures
◭ ◮
◭ ◮
Back Close
Full Screen / Esc
Printer-friendly Version Interactive Discussion
Discussion
P
a
per
|
Discussion
P
a
per
|
Discussion
P
a
per
|
Discussion
P
a
per
|
characteristics on nadir atmospheric species retrievals, J. Geophys. Res., 112, D09303, doi:10.1029/2006JD007663, 2007.
McMillan, W. W., Barnet, C., Strow, L., Chahine, M. T., McCourt, M. L., Warner, J. X., Novelli, P. C., Korontzi, S., Maddy, E. S., and Datta, S.: Daily global maps of carbon monoxide from NASA’s Atmospheric Infrared Sounder, Geophys. Res. Lett., 32, L11801,
5
doi:10.1029/2004GL021821, 2005.
Nedelec, P., Cammas, J.-P., Thouret, V., Athier, G., Cousin, J.-M., Legrand, C., Abonnel, C., Lecoeur, F., Cayez, G., and Marizy, C.: An improved infrared carbon monoxide anal-yser for routine measurements aboard commercial Airbus aircraft: technical validation and first scientific results of the MOZAIC III programme, Atmos. Chem. Phys., 3, 1551–1564,
10
doi:10.5194/acp-3-1551-2003, 2003.
Pan, L. W., Edwards, D. P., Gille, J. C., Smith, M. W., and Drummond, J. R.: Satellite remote-sensing of tropospheric CO and CH4 – forward model studies of the MOPITT instrument, Appl. Optics, 34, 6976–6988, doi:10.1364/AO.34.006976, 1995.
Pommier, M., Law, K. S., Clerbaux, C., Turquety, S., Hurtmans, D., Hadji-Lazaro, J.,
Co-15
heur, P.-F., Schlager, H., Ancellet, G., Paris, J.-D., Nédélec, P., Diskin, G. S., Podolske, J. R., Holloway, J. S., and Bernath, P.: IASI carbon monoxide validation over the Arctic dur-ing POLARCAT sprdur-ing and summer campaigns, Atmos. Chem. Phys., 10, 10655–10678, doi:10.5194/acp-10-10655-2010, 2010.
Ponomarev, E. I.: Radiative power of wildfires in Siberia on the basis of TERRA/Modis
im-20
agery 897 processing, Folia Forestalia Polonica, Seria A, 55, 102–110, doi:10.2478/ff p-2013-00011, 2013.
R’Honi, Y., Clarisse, L., Clerbaux, C., Hurtmans, D., Duflot, V., Turquety, S., Ngadi, Y., and Coheur, P.-F.: Exceptional emissions of NH3 and HCOOH in the 2010 Russian wildfires, Atmos. Chem. Phys., 13, 4171–4181, doi:10.5194/acp-13-4171-2013, 2013.
25
Rinsland, C. P., Luo, M., Logan, J. A., Beer, R., Worden, H., Kulawik, S. S., Rider, D., Oster-man, G., Gunson, M., Eldering, A., GoldOster-man, A., Shephard, M., Clough, S. A., Rodgers, C., Lampel, M., and Chiou, L.: Nadir measurements of carbon monoxide (CO) distributions by the tropospheric emission spectrometer instrument onboard the Aura spacecraft: overview of analysis approach and examples of initial results, Geophys. Res. Lett., 33, L22806,
30
doi:10.1029/2006GL027000, 2006.
AMTD
8, 4095–4135, 2015An examination of the long-term CO records from MOPITT
and IASI
M. George et al.
Title Page
Abstract Introduction
Conclusions References
Tables Figures
◭ ◮
◭ ◮
Back Close
Full Screen / Esc
Printer-friendly Version Interactive Discussion
Discussion
P
a
per
|
Discussion
P
a
per
|
Discussion
P
a
per
|
Discussion
P
a
per
|
Stein, O., Schultz, M. G., Bouarar, I., Clark, H., Huijnen, V., Gaudel, A., George, M., and Cler-baux, C.: On the wintertime low bias of Northern Hemisphere carbon monoxide found in global model simulations, Atmos. Chem. Phys., 14, 9295–9316, doi:10.5194/acp-14-9295-2014, 2014.
Streets, D., Canty, T., Carmichael, G., de Foy, B., Dickerson, R., Duncan, B., Edwards, D.,
5
Haynes, J., Henze, D., Houyoux, M., Jacob, D., Krotkov, N., Lamsal, L., Liu, Y., Lu, Z., Martin, R., Pfister, G., Pinder, R., Salawitch, R., and Wecht, K.: Emissions estimation from satellite retrievals: a review of current capability, Atmos. Environ., 77, 1011–1042, doi:10.1016/j.atmosenv.2013.05.051, 2013.
Strode, S. A. and Pawson, S.: Detection of carbon monoxide trends in the presence interannual
10
variability, J. Geophys. Res., 118, 21, 12257–12273, doi:10.1002/2013JD020258, 2013. Turquety, S., Hurtmans, D., Hadji-Lazaro, J., Coheur, P.-F., Clerbaux, C., Josset, D., and
Tsamalis, C.: Tracking the emission and transport of pollution from wildfires using the IASI CO retrievals: analysis of the summer 2007 Greek fires, Atmos. Chem. Phys., 9, 4897–4913, doi:10.5194/acp-9-4897-2009, 2009.
15
Wagner, A., Blechschmidt, A.-M., Bouarar, I., Brunke, E.-G., Clerbaux, C., Cupeiro, M., Cristo-fanelli, P., Eskes, H., Flemming, J., Flentje, H., George, M., Gilge, S., Hilboll, A., Inness, A., Kapsomenakis, J., Richter, A., Ries, L., Spangl, W., Stein, O., Weller, R., and Zerefos, C.: Evaluation of the MACC operational forecast system – potential and challenges of global near-real-time modelling with respect to reactive gases in the troposphere, Atmos. Chem.
20
Phys. Discuss., 15, 6277–6335, doi:10.5194/acpd-15-6277-2015, 2015.
Warner, J., Comer, M. M., Barnet, C. D., McMillan, W. W., Wolf, W., Maddy, E., and Sachse, G.: A comparison of satellite tropospheric carbon monoxide measurements from AIRS and MO-PITT during INTEX-A, J. Geophys. Res., 112, D12S17, doi:10.1029/2006JD007925, 2007. Worden, H. M., Deeter, M. N., Frankenberg, C., George, M., Nichitiu, F., Worden, J., Aben, I.,
25
Bowman, K. W., Clerbaux, C., Coheur, P. F., de Laat, A. T. J., Detweiler, R., Drummond, J. R., Edwards, D. P., Gille, J. C., Hurtmans, D., Luo, M., Martínez-Alonso, S., Massie, S., Pfis-ter, G., and Warner, J. X.: Decadal record of satellite carbon monoxide observations, Atmos. Chem. Phys., 13, 837–850, doi:10.5194/acp-13-837-2013, 2013.
Yurganov, L. N., Rakitin, V., Dzhola, A., August, T., Fokeeva, E., George, M., Gorchakov, G.,
30
AMTD
8, 4095–4135, 2015An examination of the long-term CO records from MOPITT
and IASI
M. George et al.
Title Page
Abstract Introduction
Conclusions References
Tables Figures
◭ ◮
◭ ◮
Back Close
Full Screen / Esc
Printer-friendly Version Interactive Discussion
Discussion
P
a
per
|
Discussion
P
a
per
|
Discussion
P
a
per
|
Discussion
P
a
per
|
of top-down estimates based on thermal IR satellite data, Atmos. Chem. Phys., 11, 7925– 7942, doi:10.5194/acp-11-7925-2011, 2011.
Zhou, D. K., Larar, A. M., Liu, X., Smith, W. L., Strow, L. L., Yang, P., Schlussel, P., and Cal-bet, X.: Global land surface emissivity retrieved from satellite ultraspectral IR measurements, IEEE T. Geosci. Remote Sens., 49, 1277–1290, doi:10.1109/TGRS.2010.2051036, 2011.
![Table 2. Column 1: Name and localization [latitude; longitude] of the 12 selected regions.](https://thumb-eu.123doks.com/thumbv2/123dok_br/18360581.354113/29.918.65.641.194.609/table-column-localization-latitude-longitude-selected-regions.webp)