A mathematical representation is given and physically described for the shape of the very hot material that immediately surrounds a black hole and the warm material located at a greater distance from the black hole, as related to active galactic nuclei. The shape of the material surrounding the black hole is interpreted in terms of asymmetry of the neutrino flux. Detailed experimental measurements on radioactive decay influenced by astrophysical events are given to support this interpretation.
1 Introduction
Recent work [1] that examined over 200 active galactic nu-clei has shown that all have a common shape of the material surrounding the black hole core, and that this shape seems to be independent of the size of the black hole. The Active galactic nuclei (AGN) are cores of galaxies that are energized by disks of hot material that act as ingress/feeder to super-massive black holes. the shape of the hot material that sur-rounds the black hole was inferred from the observation of x-rays that emanate from very hot material that is close to the black hole, and from infra-red radiation that derives from warm material much further from the core of the black hole.
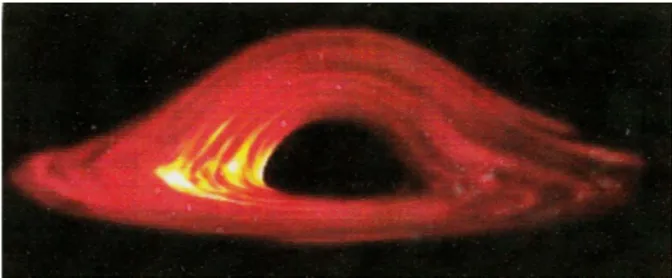
Through comparing the ratio of x-rays to infrared radia-tion, the contour shape of the black hole is indirectly mapped [1]. The results are shown in Fig. 1. Inspection of the in-ferred topology of the surrounding material indicates that al-though approximate symmetry is shown across the vertical axis, the horizontal axis shows no indication whatsoever of mirror plane symmetry, and thus the upper and lower regions of the 2-d projection must derive from very different func-tional representations. Stars, planets, and moons do not show a significant asymmetry, other than equatorial bulge. The non-symmetry of the material surrounding the black hole ap-pears thus at first surprising, however, when considered in terms of a collision-induced gravity model [2], the asymme-try could be hypothesized to be a consequence of observing the black hole from a location closer to the centre of the uni-verse where the neutrino flux density is far greater than at position coordinates that are associated with the expansion of the periphery region of the universe, even though that locus of positions is considered unbounded. Asymmetries, such as shown in Fig. 1 are generally thought to be associated with tidal effects — and in the case at hand, this would mean grav-itational interactions, such as a form of lensing. Although there is a consideration of the red shift associated with the receding of the galaxies, the cores of which are powered by disks of very hot material “feeding” the supper massive black
Fig. 1: Material shape near black hole. Courtesy of Anna Morton, moderator of 4D WorldX Yahoo Science Groups. See [1].
hole, I do not think that the asymmetry shown in Fig. 1 arises purely from considerations of Relativity, but instead arises at least to some significant level from collision criteria [2].
2 Analysis and interpretation
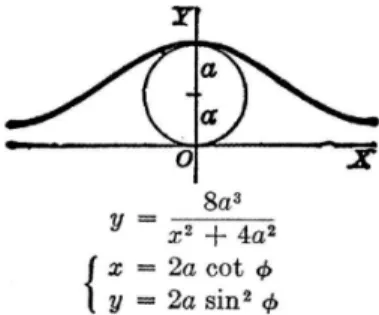
Fig. 2: The Witch of Agnesi function.
material from the black hole, which may be influenced by the magnetic properties of the super dense collapsed star. The comparatively slight asymmetry in the horizontal direction must relate to inhomogeneous temperatures and non-isotropic mass distributions of the black hole because of specific local conditions at thexyztspatial-temporal location of the highly dense aggregating of matter.
The 2-d geometry shown in Fig. 1 above the horizontal axis that passes through the extrema of the inferred contoured distribution of mass, shows the appearance of the mathe-matical function known as the Witch of Agnesi. (The term “witch” is an involvement of a misnomer, caused by an in-correct translation of the work of Maria Agnesi who devel-oped the function geometrically in 1768). The Agnesi func-tion (Fig. 2) is generally given by,y = [(8a3)=(x2+ 4a2)], whereais the radius of the circle that is utilized to geometri-cally form the functional curve. In polar coordinates the Ag-nesi function is given byx = 2a cot , andy = 2 sin2. The function can be generated geometrically by rotating the radius of the circle whereby they-coordinate of the function is the
y-value of the radial vector as it sweeps the associated circle, and thex-coordinate is thex-value of the ordered pair that represents the intersection of the extrapolation of the radial vector with the line,y = a. Although many world class math-ematicians explored the geometric development of this func-tion, including Fermat, no application in astrophysics to the author’s knowledge was established for what became known as the Witch of Agnesi function, until now — general appli-cations of the function being confined to probability theory.
Some properties of the Agnesi function are associated with gravitational criteria, such as thex-squared term appear-ing in the denominator, and suggestive of an inverse square relationship, which in Newtonian gravity derives from New-ton’s postulate of a central force, which he interpreted from Kepler’s First Law of Planetary Action-namely that the orbits of the planet must be elliptical from consideration of years of visual data of Tycho Brahe. The inverse square relationship in the collision-induced gravity model/theory derives from the properties of a flux, as in the photon inverse-square light in-tensity fall-off, or the equivalent for the distance dependency of the amplitude/intensity of magnetic or electrostatic prop-erties. The relationship of the sweeping rotating radius of the function-forming circle, and its extension to intersect the line
Fig. 3: Representation of the shape of material near a black hole using Agnesi function contours and quadratic function.
y = acan be arguably topologically associated with the no-tion of accreno-tion and event horizon, andcontinuousprocesses. The asymptotes of the function (the positive and negativex -axes) relate to the convergence of the shape of the constituent material as temperature decreases because of distance from the “donut” core of the black hole.
The region of Fig. 1 below the horizontal axis can in 2-d projection be well represented by a wide parabola that opens upward. Thus the combined representation of the 2-d geom-etry shown in Fig. 1 requires the use of a two-function coa-lescence, and implies the involvement of two different physi-cal phenomena, whereby the quadratic is typiphysi-cally associated with gravitational interactions but the Agnesi function is not. Using the Agnesi function, and varying the value of the radius,a, combined with the parabola,y = ax2 k, wherea is a very small positive constant 1, the contoured represen-tation shown in Fig. 3 is readily developed. The knee shaped curve given also in Fig. 3 represents the calculation of vol-ume of integration of the region surrounding the black hole as a function of the position coordinate,x, showing a threshold effect above which the volume increases rapidly with high slope. The volume function involves an arc tangent term which which is consistent with involvement of an event horizon.
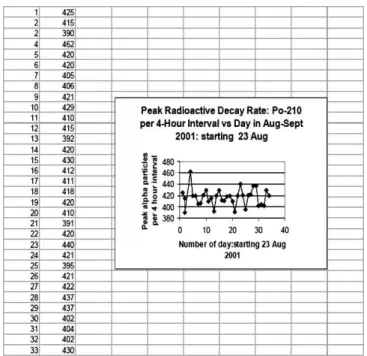
Fig. 4: Radioactive decay data for Po-210 during August-September 2001 measured at Harvard University using the Rad-7 solid-state detector.
On the other hand, it has been reported [6] that propaga-tion of fermions in curved space-time generates gravitapropaga-tional interaction due to the coupling of its spin with space time cur-vature connection, and causes a CPT violating term in the La-grangian, generating an asymmetry between the left-handed and the right-handed partners under the CPT transformation. (CPT refers to charge conjugation, space reversal, and time interval, and thus deals with parity). It is interpreted [6] that in the case of neutrinos this property can generate neutrino asymmetry in the Universe, causing the dispersion energy re-lation for the neutrino and its anti-neutrino to be different giv-ing rise to differences in their number density, and associated with the left-hand helicity of the neutrino. These effects may have an influence in contributing to the asymmetry shown in Fig. 1. It has also been shown [7] that particle interactions in the black-hole accretion disks cause an excess production of positrons as compared to electrons, however, this disparity alone, without emission directionality considerations, does not constitute a non-conservation of parity.
Although the behaviour of each type of galaxy or AGN isdependentupon the angle of observation relative to the ac-cretion plane of the black hole core, the asymmetry shown in Fig. 1 is common to all 200 AGN’s that were studied in [1], yet the angles of observation relative to the accretion zones had to be different, and the azimuths from the observation coordinates also had to be different.
Our own work [8] has suggested that near the periphery of the current universe, gravitational interactions must have a net repulsive, rather than attractive, dependence — this owing to the far lower neutrino flux in the far distant regions of the
the earth born measurement laboratory and the very distant black holes, the neutrino flux that is emanating from the outer regions of the universe, and opposing the escape of both x-rays and infra-red radiation toward the observer, has a higher particle density, than the neutrino flux that isopposing(due to collisions and associated net exchange of total momenta) the escape of electromagnetic radiation in the direction of the periphery of the universe. This higher level of particles per square centimetre per second escaping toward the periphery of the universe diffuses in curved directions because of the collision basis of gravity, and the net result contributes to the asymmetry detected by the observer, as in Fig. 1, and shown functionally in Figs. 2 and 3.
3 Supporting evidence for the significance of the neu-trino flux
In a work previously published in this journal [10] I pre-sented the explanation of the physical cause of the decades of radioactive decay data histograms determined by Shnoll et al. [11–13] which reported characteristic histograms for the decay of Pu-239 which were periodic over a 24 h interval (the solar day, thus the spin of the Earth), a 28 day in-terval (the lunar month, thus the period of the Moon), and the sidereal year, and also reported characteristic histograms of radioactive decay rate associated with a New Moon and a total solar eclipse. My explanation [10] was based on the Moon and/or the Earth periodically interrupting through scattering and capture some of the neutrinos that emanated from the Sun, and which would have otherwise transferred their momentum to the radioactive source, the decay rate of which was being studied in the experiments (taking place in Moscow, and aboard two research ships that travelled all over the world, including the polar regions). Also, the Sun and Moon intercept neutrinos emanating from deep space.
Ar-Fig. 5: Data showing three decreases in radioactive decay data of Po-210, 24 hours apart, corresponding to period of 6–10 AM Sept. 7–10 during time interval of Jupiter eclipsing quasar JO842+1835. Reproduced from [16].
boretum, studying the negative geotropism of a heavy vine, Aristolochia macrophylla. Although, conclusions could not be definitely established regarding a diurnal variation of the radioactive decay, a clear peak was observed in the 12:00– 4:00 PM time interval on 26 August 2001, far exceeding two-sigma in alpha particles per 4 hour interval. These data are given in Fig. 4, and are digitally reproduced from [14]. It was not until over a year later that I learned that on 26–27 August 2001, radiation from the explosion of supernova SN 2001 dz (in UGC 47) reached the Earth [15]. A supernova explosion is associated with a very significant release of neu-trinos, and I interpret that the radioactive alpha particle decay rate peak, shown in Fig. 4, is a consequence of the impinge-ment of the neutrinos, associated with the supernova explo-sion burst, upon the radioactive isotope source which then pertubed and further de-stabilized a nucleus that was already unstable due to the ratio of neutrons to protons.
During the period September 7–11, 2002, the planet Jupiter eclipsed the deep space quasar JO842+1835, and measurements of alpha particle decay rate were conducted by Dr. Lane-Smith in the Boston area at my request. The averaged data are given in Fig. 5 (digitally reproduced from [16]), showing a decrease in decay rate from approximately 6:00AM to 10:00 AM every 24 hours during the 3-day time interval of the eclipsing event. This variation is attributed to the rotation of the Earth such that once per day Jupiter, in-terrupted the particle-path from the deep-space quasar to the earth laboratory where the radioactive source was located for the experiment. This interruption of neutrinos, due to the nu-cleons of Jupiter scattering and inelastically capturing some small, but non-trivial, proportion of particles and/or radiation causes a decrease in radioactive decay rate because of the consequent decrease in the particle flux transferring
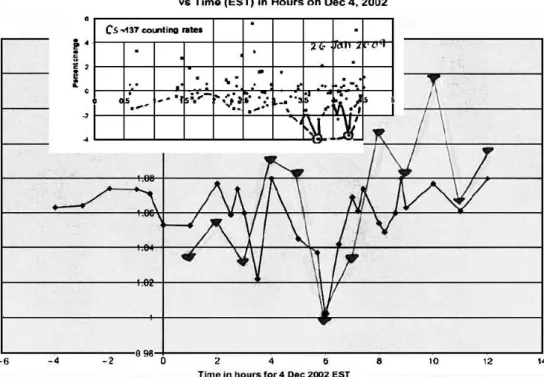
Fig. 6: Decrease in radioactive decay rate for Co-60 and for Po-210 during total eclipse of 4 Dec. 2002, and decrease in radioactive decay rate for Cs-137 during annular solar eclipse of 26 Jan. 2009.
— but now shown to depend upon momenta transfer from externally impinging particles including primarily the muon neutrino and the electron neutrino.
Additional supporting data regarding the significance of the neutrino flux on radioactivity, and highly supportive of my own work and interpretations given herein, are as follows:
1. A major multi-year study by Purdue University re-searchers at Brookhaven National Laboratory clearly show that the radioactive decay rates of many isotopes correlate very well with the distance of the source iso-tope from the Sun, as well as changes in radioactive decay rate correlated with major solar flares [22]. 2. Positron annihilation measurements [23] that show
pe-riodic variation with the phases of the Moon, yielding peaks associated with the New Moon (which approxi-mates a solar eclipse), and troughs correlated with the presence of the Full Moon. The source of positrons in this study was Na-22, and the dependent variable of the experiment measured the yield of molecular iodine (I2). Thus the peaks in I2% correlated with the presence of the New Moon, and hence the interference by the Moon of a flow of particles from the Sun and from space. The data also showed a general trend increase in I2 production over the course of the months of the experiment (November through February), that the au-thors tentatively attribute to seasonal changes of the distance between the Earth and the Sun. The exact phenomena causing the peaks is not yet established
since in this case an interruption of neutrino flow by the Moon enhances positronium production. It is possi-ble that the peaks are due to more molecular iodine be-ing produced associated with a different collision cross-section caused by change-in-flavor of the neutrino due to collision with nucleons of the Moon.
3. Periodic oscillations have been reported [24] in Pm-142 which show an oscillating sinusoidal decay for electron capture (as contrasted to a conventionally es-tablished exponential decay) which the authors at-tribute to modulations caused by the oscillation of neu-trinos between two different mass states (flavors), that of the electron neutrino emitted in the original decay, and that of the muon neutrino which is observed in de-cays of the muon (a particle 200 times more massive than the electron).
4. The standard deviation of decay rate of radioactive isotopes is periodic with respect to the phases of the Moon, being maximum at Full Moon (whereby exter-nal particle impingement from the Sun is unobstructed) and minimum at New Moon (whereby external particle impingement is obstructed by the Moon [25]), akin an eclipse condition.
4 Conclusion
prin-cipal cause of the non-symmetry shown in Fig. 1, owing to neutrino-photon collisions in the AGN or black hole regimes where the collision cross-sections of neutrinos and photons is many orders of magnitude higher than in the solar system regime. This conclusion is supported by our previous exper-imental work using both very-close-proximity gravitational pendula, and a magnetic pendulum system, interrogated by laser scattering, showing asymmetry in gravitational parti-cle/wave impinging flux in theX-Y plane as compared to the zed (Z) direction [16].
Note added in proof
Recent work by G. C. Vezzoli and R. Morgan has shown that the 1444 minute annually periodic histogram reported by Shnol and Rubenstein in this journal for the period 24 July 2005 into August correlates with the NASA report of the Sun beginning the occulting of Saturn on that date; and thus also correlates with the work of Vezzoli reporting a dip in grav-ity on 18 May 2001 when earth, Sun, and Saturn were in syzygy [15]. The Morgan-Vezzoli work will be reported in a Letter-to-the-Editor of this journal authored by Morgan.
Acknowledgements
The author wishes to gratefully acknowledge the assistance, collegial cooperation, fruitful discussions of Prof. C. Blatch-ley, Dr. Derek Lane-Smith, Dr. William StanBlatch-ley, Sandra Smalling, and the faculty, administration, staff, and students at Lebanon College.
Submitted on February 24, 2009/Accepted on June 03, 2009
References
1. McKernan B. American Museum of Natural History and
Man-hattan Community College, City University of New York, 17 Dec 2008 See also Kaku M. and Thompson J. Beyond Einstein. Anchor, Random House, New York, 1995.
2. Stanley W. and Vezzoli G.C. Induced gravity model based on external impinging neutrinos: calculation of G in terms of col-lision phenomena and inferences to inertial mass and atomic-quantization.arXiV: astro-ph/0102109
3. The new physics. Ed. by P. Davies, Cambridge University
Press, 1989.
4. Longair M.Ibid., p.141
5. Watarai K-Y. Ecipsing light-curve asymmetry for black hole ac-cretion flows.Publ. Astron. Soc. Jpn., 2005, v. 57(5), 827–833.
6. Banibrata M. Neutrino asymmetry around black holes.Modern Physics Letters A, 2005, v. 20(28), 2145–2155.
7. Akujar C.E. Contribution of black hole accretion disks to symmetric lepton production.Astrophysics and Space Science, 1984, v. 100, 1–2, 413–415.
8. Vezzoli G.C. Note on indication of nano local short range order in liquid iron from analysis of recovered products from molten state: geophysical inferences from the materials science,Mat. Res. Innov., 2002, v. 5, 222–225.
9. Hoyle C.D.Phys. Rev. Lett., 2001, v. 86(8), 1418.
10. Vezzoli G.C. On the explaination of the physical cause of the Shnoll characteristic histograms and observed fluctuations. Progress in Physics, 2008, v. 2, 158–161.
11. Shnoll S., Kolombet V., Pozharski E., Zenchenko T., Zvere-va I., and Konradov A. Realization of discrete states during fluctuations in macroscopic processes.Physics-Uspekhi, 1998, v. 162(10), 1139–1140.
12. Shnoll S., Zenchenko T., Zenchenko K., Pozharski E., Kolom-bet V., and Konradov A. Regular variation of the fine structure of statistical distributions as a consequence of cosmophysical agents.Physics-Uspekhi, 2000, v. 43(2), 205–209.
13. Shnoll S., Zenchenko K., Shapovalov S., Gorshkov S., Makare-vich., and Troshichev O.A. The specific form of histograms pre-senting the distribution of data of alpha decay measurements appears simultaneously in the moment of New Moon in differ-ent points from Artic to Antartic. arXiv: physics/0412152.
14. Vezzoli G.C. Radioactive decay of Po-210 and Co-60 at two U.S. Observation Stations in the Path of the Umbra/Penumbra of the total eclipse of the Sun of December 4, 2002 in Southern Australia.Infinite Energy, 2005, v. 11(61), 48–53.
15. Photograph of this supernova was taken by T. Boles and
G. M. Hurst in Basingstoke, England, August 27–28 2001. The supernova SN 2001 is described at website http://www. theastronomer.org/supernovae.html. Code symbols are SN 2001dw-20010825-tb.jpg or SN 2001dz.
16. Vezzoli G.C. Gravitational data during the syzygy of May 18, 2001 and related studies.Infinite Energy, 2004, v. 9(53), 18–27. 17. Co-60 was conducted by Professor C. Blatchley at Pittsburg State University during time interval of total solar eclipse of 4 Dec 2002 showing a decrease in decay rate at the time of totality in Southern Australia. Dr. Blatchley asked me to point out in this citation that he is not certain whether his data are supportive of my conclusions because of inherent noise effects and barometric effects that relate to these type of radioactive decay measurements.
18. Po-210 study was conducted by Dr. Derek Lane-Smith of Dur-ridge Corporation in Bedford, MA, during time interval of total solar eclipse of 4 Dec 2002 showing a decrease in radioactive decay rate at the time of totality in southern Australia.
253; Yang X. Private communications, 2005–2007.
22. Jenskin J., Fischbach E., Buncher J., Gruenwald J., Krause D., and Mattes J. Evidence for correlations between nuclear decay rates and earth-Sun distance. arXiv: 00808.3283.
23. Vikin B.P. Gravitational pertubations as a possible cause for in-stability in the measurements of positron annihilation.Progress in Physics, 2008, v. 2, 76–77.
24. Litvinov Y.A. et al.Phys. Rev. Lett., 2008, v. 664, 162–168.