ACPD
9, 7615–7643, 2009CH4 characterization from IASI
A. Razavi et al.
Title Page
Abstract Introduction
Conclusions References
Tables Figures
◭ ◮
◭ ◮
Back Close
Full Screen / Esc
Printer-friendly Version
Interactive Discussion
Atmos. Chem. Phys. Discuss., 9, 7615–7643, 2009 www.atmos-chem-phys-discuss.net/9/7615/2009/ © Author(s) 2009. This work is distributed under the Creative Commons Attribution 3.0 License.
Atmospheric Chemistry and Physics Discussions
This discussion paper is/has been under review for the journalAtmospheric Chemistry and Physics (ACP). Please refer to the corresponding final paper inACPif available.
Characterization of methane retrievals
from the IASI space-borne sounder
A. Razavi1, C. Clerbaux2,1, C. Wespes1,*, L. Clarisse1,*, D. Hurtmans1, S. Payan3, C. Camy-Peyret3, and P. F. Coheur1,*
1
Service de Chimie Quantique et Photophysique, Universit ´e Libre de Bruxelles (U.L.B.), Brussels, Belgium
2
UPMC Univ Paris 06, CNRS UMR8190, LATMOS/IPSL, Paris, France 3
UPMC Univ Paris 06, CNRS UMR7092, LPMAA/IPSL, Paris, France *
They are, respectively FRIA researcher, Scientific collaborator and Research Associate with FRS-FNRS, Belgium
Received: 6 February 2009 – Accepted: 9 March 2009 – Published: 23 March 2009
Correspondence to: A. Razavi ([email protected])
ACPD
9, 7615–7643, 2009CH4 characterization from IASI
A. Razavi et al.
Title Page
Abstract Introduction
Conclusions References
Tables Figures
◭ ◮
◭ ◮
Back Close
Full Screen / Esc
Printer-friendly Version
Interactive Discussion
Abstract
Although the global methane (CH4) concentration has more than doubled since
pre-industrial times, local emission sources are still poorly identified and quantified. In-struments onboard satellites can improve our knowledge about the methane global distribution owing to their very good spatial coverage. The IASI (Infrared Atmospheric
5
Sounding Interferometer) instrument launched on the European MetOp platform is a Fourier transform spectrometer which measures the thermal infrared radiation emitted by the Earth and its atmosphere. In this paper, we present the first global distribu-tion of methane total columns from the IASI spectra using the methaneν4absorption
band. The retrieval spectral range was set in order to minimize possible spectroscopic
10
issues. Results are discussed in terms of error budget and vertical sensitivity. In addi-tion, we study the gain of information on surface methane concentrations provided by using theν3band, which is partly covered by IASI on the short-wave end of the spectra
(extending to 2760 cm−1), where solar reflection contributes significantly.
1 Introduction
15
Despite the fact that methane (CH4) is the second most important anthropogenic
greenhouse gas in our atmosphere, there still exist large uncertainties on the location and intensity of the emission sources. These emissions are mostly related to anaerobic decomposition and can be classified into natural sources (wetlands, oceans, forests, fire, termites and geological sources) and anthropogenic sources (rice agriculture,
live-20
stock, landfills, waste treatment, biomass burning, and fossil fuel combustion). About 60% of the CH4 released in the atmosphere is related to human activities in such a way that its concentration has more than doubled since pre-industrial times, reach-ing 1774.62±1.22 ppb in 2005 (Forster et al., 2007). From the 1980’s, the increase in methane has been slowing down, reaching a steady state around the year 2000 (but
25
stabiliza-ACPD
9, 7615–7643, 2009CH4 characterization from IASI
A. Razavi et al.
Title Page
Abstract Introduction
Conclusions References
Tables Figures
◭ ◮
◭ ◮
Back Close
Full Screen / Esc
Printer-friendly Version
Interactive Discussion
tion of CH4emissions have been suggested (Dlugokencky et al., 2003). Methane also plays a key role in the chemical processes occurring in the troposphere through its oxidation by the OH radical. This reaction is the main CH4 sink, contributing to more
than 80% of its total loss in the troposphere. Other minor removal processes include uptake by soil and transport to the stratosphere where CH4is rapidly destructed.
5
Observations from space which offer a very good spatio-temporal coverage, are
use-ful to improve our knowledge of the relative strengths of the methane sources and sinks. In recent years, different instruments on board satellites have enabled mapping
the methane concentrations in our atmosphere. The SCIAMACHY instrument onboard ENVISAT, operating in the UV, visible and near infrared spectral regions has delivered
10
annual global distributions of CH4 (Frankenberg et al., 2006). These have been re-cently revised after using a new set of spectroscopic parameters (Frankenberg et al., 2008a), leading to improved retrievals of water vapor and methane, with a net decrease of tropical CH4concentrations (Frankenberg et al., 2008b). The SCIAMACHY methane distributions present high concentrations in the tropical region, which are possibly
re-15
lated to methane emission from terrestrial plants (Keppler et al., 2006). This question is still subject to some controversy (Dueck et al., 2007) but has recently been confirmed in two studies (Keppler et al., 2008; Vigano et al., 2008). CH4 profiles can also be
retrieved from thermal infrared nadir sounders, as was shown from the IMG/ADEOS mission (Clerbaux et al., 2003) and more recently from the AIRS/AQUA and TES/Aura
20
sounders (Xiong et al., 2008; Kulawik et al., 2008). Space-borne instruments working in a limb viewing geometry (ACE-FTS, HALOE, MIPAS) add information on the verti-cal distribution of methane but are only sensitive from the upper troposphere to higher altitudes (De Mazi `ere et al., 2008; Raspollini et al., 2006; Park et al., 2004).
The IASI (Infrared Atmospheric Sounding Interferometer) (Phulpin et al., 2007)
ther-25
ACPD
9, 7615–7643, 2009CH4 characterization from IASI
A. Razavi et al.
Title Page
Abstract Introduction
Conclusions References
Tables Figures
◭ ◮
◭ ◮
Back Close
Full Screen / Esc
Printer-friendly Version
Interactive Discussion
trace gases important for climate monitoring (CO2, H2O (Herbin et al., 2009), CH4) and atmospheric chemistry, such as CO (George et al., 2009; Turquety et al., 2009), O3(Boynard et al., 2009), HNO3(Wespes et al., 2009) and NH3(Clarisse et al., 2009).
It also allows the detection of minor trace gases during exceptional events such as fires (Coheur et al., 2005) or volcanic eruptions (Clarisse et al., 2008). IASI covers an
5
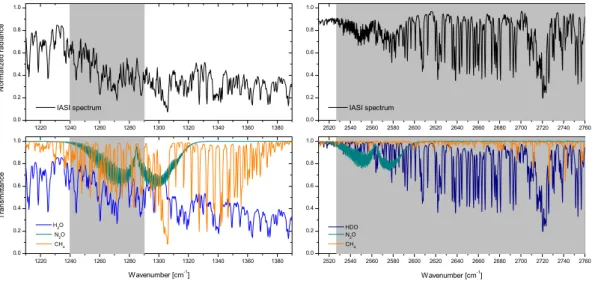
extended spectral range which allows the retrieval of methane using two different
spec-tral regions corresponding to the ν4 and ν3 rovibrational bands (Fig. 1). In this work, we focus on the characterization of CH4retrievals from theν4band and we investigate
the possibility of retrieving additional information on surface concentrations using the
ν3band.
10
In the next section, we briefly describe the IASI measurements and the method used to retrieve methane. The importance of the methane line mixing is discussed as well. Global distributions of methane retrieved from theν4band are presented and
discussed in Sect. 3 along with detailed characterizations of retrieved profiles in both bands. Finally, in Sect. 4 we draw conclusions and perspectives on future work.
15
2 IASI instrument and concentration measurement
2.1 Description of IASI
The IASI instrument, consisting of a nadir-looking Fourier transform spectrometer, was launched onboard the MetOp-A platform on 19 October 2006 and flies at about 817 km on a polar sun-synchronous orbit. It records the Earth’s outgoing radiation from 645 to
20
2760 cm−1with an apodized resolution of 0.5 cm−1. Because of the wide scans across its track (2200 km swaths), IASI provides global Earth’s coverage twice a day with a field of view defined at nadir by a matrix of 4 circular pixels of 12 km diameter each. Moreover, IASI offers a very good signal-to-noise ratio. The on-flight Noise Equivalent
Delta Temperature (NEDT) at 280 K has been estimated to be well below 0.1 K in the
25
ACPD
9, 7615–7643, 2009CH4 characterization from IASI
A. Razavi et al.
Title Page
Abstract Introduction
Conclusions References
Tables Figures
◭ ◮
◭ ◮
Back Close
Full Screen / Esc
Printer-friendly Version
Interactive Discussion
since late May 2007 and is planned to last 15 years with the successive launch of two other identical instruments, providing consistent measurements on a large time scale.
The IASI spectral range covers entirely the ν4 rovibrational band, corresponding to
the bending mode of methane around 1306 cm−1as well as some lines of theν3band
(stretching mode) near 2700 cm−1. The region above 2200 cm−1 is significantly
af-5
fected by the solar radiation reflected on the Earth’s surface. The use of theν3 band
eliminates the negative effect of weak thermal contrast on the IR sounding in the
bound-ary layer and is accordingly expected to improve the retrievals of CH4 concentration near the Earth’s surface. These two absorption regions are illustrated in Fig. 1 together with the overlapping contributions of other molecules (mainly N2O, H2O and HDO). The
10
gray areas represent the spectral windows selected for the retrievals. These choices will be explained in Sects. 2.3 and 3.3 for theν4andν3bands, respectively.
2.2 Retrieval method
In this section we describe the method used to retrieve methane concentrations. The inversion model is based on the Optimal Estimation Method (OEM) (Rodgers, 2000)
15
implemented in the Atmosphit software developed at the “Universit ´e Libre de Brux-elles”. The latter also includes a sophisticated forward line-by-line radiation transfer model. For more details about the software, we refer the reader to Clarisse et al. (2008) and Coheur et al. (2005).
2.2.1 Forward model
20
ACPD
9, 7615–7643, 2009CH4 characterization from IASI
A. Razavi et al.
Title Page Abstract Introduction Conclusions References Tables Figures ◭ ◮ ◭ ◮ Back Close
Full Screen / Esc
Printer-friendly Version
Interactive Discussion
the upward paths↑,
L↑ν˜(a)=L↑ ˜
ν(0)τ ↑
˜
ν(s ↑)+Z
s↑
Bν˜(T(s))
∂τν↑˜(s)
∂s d s (1)
whereBν˜(T(s)) is the Planck function for a blackbody at temperatureT(s) andτ
↑
˜
ν(s ↑
) is the transmittance along the paths↑ which is given by
τν↑˜(s↑)=exp − Z
s↑
X
i
Φν,i˜ [p(s′), T(s′), ni(s′)]ni(s′)d s′ !
(2)
5
The sum in Eq. 2 applies over each molecular speciesi and the coefficientspandni
represent the atmospheric pressure and the number density, respectively. The quantity
Φν,i˜ corresponds to a discrete absorption line or to a continuous band (cross section
or continuum) of a given speciesi.
For nadir looking satellites in the IR, the source is the Earth’s thermal emission.
10
The contribution of the averaged downward fluxL↓ν˜ from the atmosphere, which is not absorbed by the Earth’s surface needs also to be taken into account. Furthermore, for wavenumbers higher than about 2200 cm−1, an additional term must be introduced in the definition of the radiation source in order to account for the solar radiation reflected on the Earth’s surface. As a result, the source term is given by
15
L↑ν˜(0)=ǫBν˜(Tskin)+(1−ǫ)
π
Z2π
0 Zπ/2
0
L↓ν˜(θ) sin(θ) cos(ϕ)d θd ϕ+ηBν˜(TSun)τ↓ ˜
ν(s
↓). (3)
In the first term, ǫ is the emissivity of the Earth and Tskin is the temperature derived
from the thermal emission of the Earth’s surface. The second term represents the con-tribution of the downward fluxL↓ν˜averaged over a half sphere. In the third term,Bν˜(TSun)
corresponds to the blackbody radiation emitted by the Sun andη, the reflectance, is
20
ACPD
9, 7615–7643, 2009CH4 characterization from IASI
A. Razavi et al.
Title Page
Abstract Introduction
Conclusions References
Tables Figures
◭ ◮
◭ ◮
Back Close
Full Screen / Esc
Printer-friendly Version
Interactive Discussion
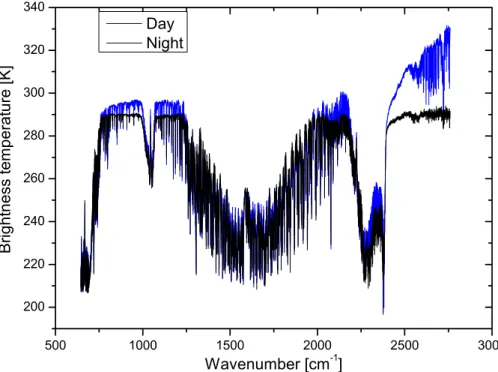
measurement, the type of surface and the angle between the sun and the satellite. Figure 2 illustrates the importance of reflected solar radiation in the shortwave end of IASI spectra by comparing, in brightness temperature, one spectrum measured at night and another measured during daytime with significant solar reflection.
2.2.2 Inverse model
5
Equation (1) can be written as
y=F(x;b)+ρ, (4)
whereF represents the radiative transfer function,y is the measurement vector which contains the recorded radiances,xrepresents the state vector (i.e. the atmospheric pa-rameters we want to retrieve, which is the methane profile in our case),bare the other
10
parameters which have an influence on the measurement (temperature and pressure profiles, instrumental properties, etc.) andρis the measurement noise.
The inverse problem derived from Eq. (4) is generally ill-posed. An approximation ˆ
xof the true state xcan be found using the OEM described in Rodgers (2000). This statistical approach is based on the combination of the measurement vectory and an
15
a priori statexawhich represents the best knowledge of the statex(from atmospheric model or prior measurements). These two quantities are weighted by covariance ma-trices, respectivelySρ andSa, which define their spectral and/or spatio-temporal vari-ations.
If we assume that the forward model is linear, Eq. 4 becomes y=Kx+ρ and the
20
solutionxˆ of the OEM can be written as ˆ
x=Ax+(I−A)xa+Gρ (5)
whereA=∂xˆ/∂xis the averaging kernel matrix andG=∂xˆ/∂yis the gain matrix. The
averaging kernel matrix represents the sensitivity of the retrieved profile to the true state and allows to characterize the retrieval in terms of vertical sensitivity. Indeed,
25
ACPD
9, 7615–7643, 2009CH4 characterization from IASI
A. Razavi et al.
Title Page
Abstract Introduction
Conclusions References
Tables Figures
◭ ◮
◭ ◮
Back Close
Full Screen / Esc
Printer-friendly Version
Interactive Discussion
corresponding row ofAand corrected with the other terms accounting for the a priori information and the measurement noise. In addition, the trace of theAmatrix, called degrees of freedom for signal (DFS), gives an estimation of the number of vertical independent pieces of information obtained. It follows also that the position of the largest diagonal element ofA corresponds to the altitude where the sensitivity is the
5
highest.
In our case, the problem is moderately non-linear and may be solved through an iterative process (fit) of the form
ˆ
xi+1=xa+
S−1a +KT
iS −1
ρ Ki
−1
KTiS−1ρ
y−F( ˆxi)+Ki( ˆxi −xa)
(6)
whereK=∂y/∂xis the Jacobian matrix andKi=K(xi). The solution is obtained when
10
convergence is achieved i.e. when|F(xi+1)−F(xi)| ≤0.7×σρ, whereσρare the
diago-nal elements of the matrixSρ=σρ2I.
2.3 Spectral range selection
The accuracy achieved in the retrieval of trace species from remote sensing measure-ments relies on the performance of the sounders, on the availability of auxiliary data
15
such as H2O and temperature profiles and on the quality of spectroscopic data
intro-duced as input of the radiative transfer algorithms. Standard line-by-line spectroscopic data include line positions and intensities, broadening and shifting coefficients as well
as their temperature dependence. For this work, they are taken from the HITRAN 2004 database (Rothman et al., 2005). These parameters must be complemented by
20
information on physical effects affecting the shape of atmospheric lines beyond the
usual Voigt profile approximation. These include line narrowing and line interference effects, which are to be considered when processing high spectral resolution
atmo-spheric spectra. In addition, the instrumental lineshape of IASI is also included in the computations.
25
ACPD
9, 7615–7643, 2009CH4 characterization from IASI
A. Razavi et al.
Title Page
Abstract Introduction
Conclusions References
Tables Figures
◭ ◮
◭ ◮
Back Close
Full Screen / Esc
Printer-friendly Version
Interactive Discussion
the retrieval of concentration profiles of this molecule from IASI spectra in theν4
spec-tral band around 1300 cm−1. Similar studies evaluating the impact on the methane retrievals of fine spectroscopy in the ν3 band (Mondelain et al., 2007) have been
performed using balloon and ground based high resolution spectra in solar absorp-tion (Tran et al., 2006). Concerning theν4band, the maximum information content is
5
centered on the methaneQbranch located around 1306 cm−1. As obvious from Fig. 1, this region also contains strong water and nitrous oxide lines, which complicates the retrievals.
A first retrieval test has been done using the entire ν4 spectral range. In this case,
the residual was found to be significantly higher than the instrumental noise. In order
10
to improve the fits, the line mixing parameters from Tran et al. (2006) have been used to generate absorption cross sections of methane. Figure 3 presents resulting forward simulations of IASI spectra, with and without taking line mixing into account. As can be seen in the residual (expressed in brightness temperature) the differences can reach
1 K around the methaneQbranch, which is larger by more than one order of magnitude
15
than the expected instrumental noise of IASI in this spectral region. The impact on the retrieved profile was, however, found to be insignificant. We have therefore chosen not to include line mixing in the model, but we have excluded the mostly affectedQbranch
from the retrieval window to improve on the residuals. Wavenumbers above 1310 cm−1 are not taken into account in order to minimize possible effects due to the water vapor
20
continuum. The resulting spectral window used for methane concentration retrieval in theν4band thus extends from 1240 to 1290 cm−
1
.
2.4 Retrieval settings
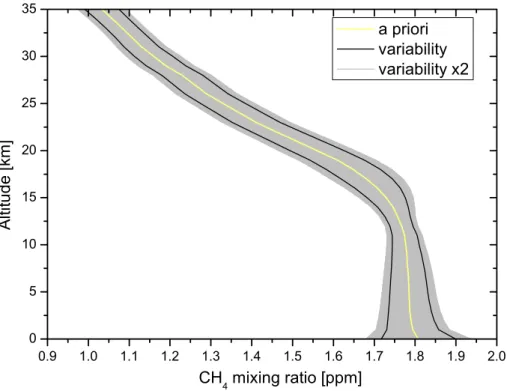
The a priori profile and variability chosen for the retrieval of methane are derived from LMDZ global model distributions (Hauglustaine et al., 2004). Four days corresponding
25
to the different seasons of the year 2004 (January, April, July and October) were used
ACPD
9, 7615–7643, 2009CH4 characterization from IASI
A. Razavi et al.
Title Page
Abstract Introduction
Conclusions References
Tables Figures
◭ ◮
◭ ◮
Back Close
Full Screen / Esc
Printer-friendly Version
Interactive Discussion
covariance matrix. Owing to the fact that the LMDZ model is mainly dedicated to the troposphere, the a priori has been connected above 20 km to the one used in previous studies (Turquety et al., 2004). As the model usually tends to smooth the spatial variability, we have also chosen to multiply by 2 theSacovariance matrix built from LMDZ (see Fig. 4). The same prior information is used for each location and time
5
period. The diagonal elements of the measurement covariance matrixSρ are given by
σρ=2.00×10−
6
W/(cm2sr m−1), which is in good agreement with the IASI instrumental noise in theν4spectral region of interest.
3 Results
3.1 Vertical sensitivity of the measurement
10
IASI provides information on some trace gases (including CH4) with limited vertical
res-olution (Clerbaux et al., 2009). The averaging kernels corresponding to three typical cases of methane retrievals in the ν4 spectral region (tropical, midlatitude and polar
observations) are represented in Fig. 5. The retrieval was set-up for partial columns of 3 km thickness, extending from the ground up to 21 km. These partial columns were
15
chosen to fully characterize the measurement even though the different levels will be
correlated. It follows from the shape of the averaging kernels that the IASI measure-ments have a maximum sensitivity to methane in the middle troposphere, between approximately 4 and 10 km. The resulting DFS for the 3 scenes shown in Fig. 5 is, re-spectively of 1.16, 1.04 and 0.92 (unlike, for example, for CO where the DFS frequently
20
reaches values above 1.5, see Turquety et al., 2009). Even in the most favorable situa-tion (hot tropical scene) the decorrelasitua-tion of two tropospheric columns is not possible. It follows that we consider only the total columns for the derivation of global distribution. A typical error budget for methane retrievals in theν4band is provided in Fig. 6. The
total retrieval error varies between 1 and 2.5 % in the troposphere below 12 km, closely
25
ACPD
9, 7615–7643, 2009CH4 characterization from IASI
A. Razavi et al.
Title Page
Abstract Introduction
Conclusions References
Tables Figures
◭ ◮
◭ ◮
Back Close
Full Screen / Esc
Printer-friendly Version
Interactive Discussion
a factor 2 from the Earth surface to about 12 km height. In the upper troposphere, the sensitivity slightly decreases leading to a gain of 1.5 with respect to the variability. The total error is mostly driven by the smoothing error. Other significant sources of error are introduced from the instrumental noise (referred here as the measurement error) and to a lesser extent from the uncertainties in the fitted humidity profile. The total
5
error of the methane total column (from 0 to 21 km) is evaluated to be of the order of 1% which is very promising in light of the methane global variability evaluated at about 5% (Dentener et al., 2001). The value of the column error is intimately related to the a priori variability and correlations between the levels of the profile. Considering that much larger variability can occur in the boundary layer nearby source regions, where
10
IASI is less sensitive, this value is obviously a lower bound to the error, and is only valid for cases which are included in the ensemble of profiles used to built the a priori matrix. Other cases, and in particular those showing enhancement in the boundary layer will not be reproducible with this accuracy. The errors in these situations will have to be evaluated at a later stage by a detailed validation exercise.
15
3.2 Global distribution
In this section, we show the preliminary global distribution of methane total columns as-sessed from the IASI sounder. Because inversion is computationally very demanding, especially given the large number of IASI spectra, we have chosen to limit the retrieval to near-nadir spectra (satellite zenithal angles≤3◦) during 7 successive days, from 4–
20
10 October 2008. The a priori profiles used for temperature and humidity are those dis-seminated operationally by EUMETCast along with cloud information (pressure, tem-perature and coverage). Only cloud-free observations as characterized with the level 2 data (cloud coverage≤15%) have been processed. In addition, some filters were ap-plied after the methane retrievals: total columns corresponding to a RMS of the diff
er-25
ACPD
9, 7615–7643, 2009CH4 characterization from IASI
A. Razavi et al.
Title Page
Abstract Introduction
Conclusions References
Tables Figures
◭ ◮
◭ ◮
Back Close
Full Screen / Esc
Printer-friendly Version
Interactive Discussion
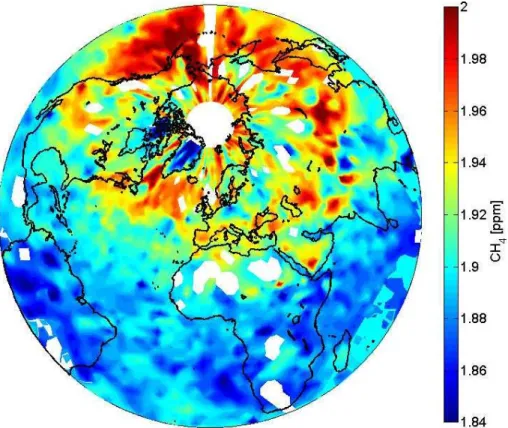
In order to provide a distribution which does not depend on the ground altitude, the global distribution is expressed in normalized vmr, with the CH4 total columns divided by the air total columns. This unit is more suitable for a long lived species like CH4
and allows to observe variations due to changes in the sources or horizontal trans-port. It has been used, for instance, for analyzing the CH4product derived from
SCIA-5
MACHY (Frankenberg et al., 2006). In that study, the CH4 column was divided by the
CO2column.
The global distribution (see Fig. 7) is illustrated with a projection chosen to high-light the northern hemisphere. It shows a distinct North-South gradient. The methane normalized mixing ratios range from 1.742 in tropical regions up to 2.101 ppm at high
10
northern latitudes. The cut-offfrom low to high concentrations is located around 30◦N
with a further steady increase towards the polar region. The elevated methane con-centrations at mid and high latitudes is consistent with the locations of large methane emission sources (such as rice agriculture, livestock and wetlands). From Fig. 7 it can be seen that retrieval problems persist over sandy regions (such as North Africa and
15
the Arabian peninsula). Strong biases are also observed above Antarctica, where all the measurements are rejected by posterior filters. These problems may be linked to spectrally dependent emissivity features not yet accounted for in the radiative transfer model.
Total column measurements from ground-based instruments are unfortunately too
20
sparse to perform a quantitative validation exercise at this point. Furthermore, compar-ing the global distributions of total columns with other satellites is a difficult task, mainly
because of the vertical sensitivities inherent to each observing modes. For example, the SCIAMACHY methane product is an averaged vmr, which is more representative to the lower troposphere than the IASI one (Frankenberg et al., 2008b). This results
25
in different concentration range (1.63 to 1.81 ppm for SCIAMACHY) and only enables
ACPD
9, 7615–7643, 2009CH4 characterization from IASI
A. Razavi et al.
Title Page
Abstract Introduction
Conclusions References
Tables Figures
◭ ◮
◭ ◮
Back Close
Full Screen / Esc
Printer-friendly Version
Interactive Discussion
the world (such as Southeast Asia and central Africa) which are not detected by IASI, probably due to its lack of sensitivity close to the surface. Regarding the AIRS distribu-tion (Xiong et al., 2008), the observadistribu-tions are expressed in mixing ratios for two vertical layers (150–250 hPa and 450–550 hPa) averaged for the month of August 2004. Given the IASI vertical sensitivity, the comparison with the layer between 450 and 550 hPa
5
is more relevant. The range of IASI methane total columns is higher than the AIRS mixing ratios corresponding to partial columns (extending from 1.65 to 1.9 ppm) but the North-South gradient is similar.
3.3 Additional information from theν3band
One of the advantages of the extended spectral range of IASI is the presence of some
10
P lines of the methane ν3 band. Owing to the influence of solar radiation reflected
on the Earth’s surface from 2000 cm−1 onwards (see Fig. 2), this spectral region is expected to provide additional information on CH4 in the boundary layer. The
signal-to-noise ratio in this part of the IASI spectrum is, however, much smaller than in the
ν4 region and depends significantly on the intensity of the solar reflection (i.e. on the
15
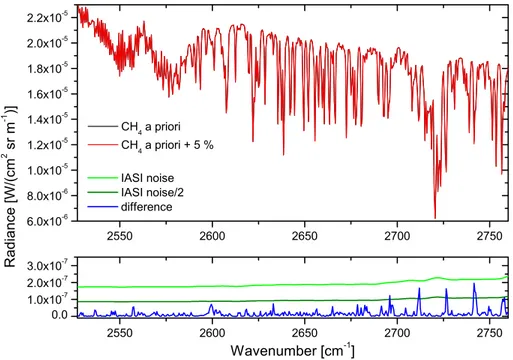
reflectance parameter,ηin Eq. 3). Methane retrievals from this part of the IASI spectra are performed considering a wide range (from 2527 to 2760 cm−1, shown in gray in Fig. 1) which allows the simultaneous retrieval of the reflectance. The contribution of nitrous oxide and HDO are also taken into account in the retrieval process. Figure 8 shows that a value of reflected solar radiationη=5×10⁻⁶ is not sufficient to increase
20
the signal-to-noise such as to observe a variation of 5% in the total column of methane. In order to improve on the signal-to-noise and make adequate use of theν3absorption
band, 4 contiguous IASI measurements (50×50 km) have been averaged.
As an example, the average is performed here on 4 spectra measured on 8 October 2008 above West Africa (around 22.36◦ latitude and −9.17◦ longitude). It is
charac-25
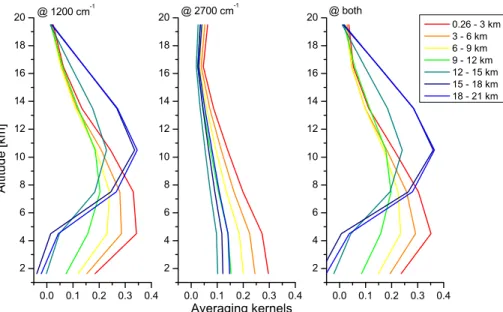
terized by a fitted reflectance of 4.40×10⁻⁶. Figure 9 illustrates the vertical sensitivity achievable using theν3band in comparison to using the ν4band. The combination of
ACPD
9, 7615–7643, 2009CH4 characterization from IASI
A. Razavi et al.
Title Page
Abstract Introduction
Conclusions References
Tables Figures
◭ ◮
◭ ◮
Back Close
Full Screen / Esc
Printer-friendly Version
Interactive Discussion
provides, as shown earlier, higher sensitivity in the mid to upper troposphere and low sensitivity below 2 km. In contrast, theν3band contains the maximum information from
the ground to 4 km, complementing the information from theν4 band. The
simultane-ous fit of the two spectral regions leads accordingly to an improvement of sensitivity throughout the troposphere as compared to the bands used individually. In particular, it
5
allows a better decorrelation of two partial columns (from the ground to 8 km and from 8 to 15 km). In term of vertical independent piece of information, the DFS values range from 0.83 using the ν3 band alone, 1.17 using the ν4 one and up to 1.23 using both
bands simultaneously. The simultaneous retrieval allows thus for a gain of 0.06 DFS, which corresponds principally to the increase of sensitivity near the ground.
10
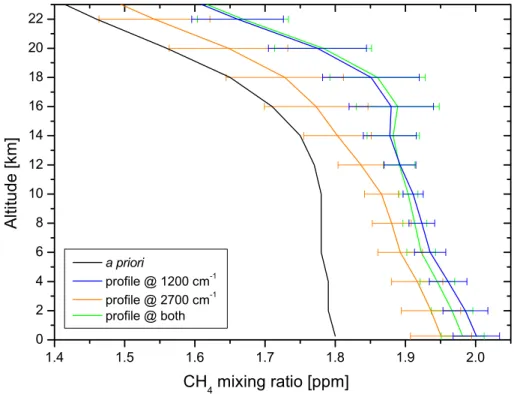
The CH4 profiles retrieved using those different choices of spectral windows are
shown in Fig. 10 for the selected scene together with the associated errors. The blue and orange curves correspond to the retrieval of methane from theν4 and ν3 bands,
respectively. The retrieved profile from the spectral range around 2700 cm−1 remains close to the a priori in the upper troposphere, likely because of the very weak sensitivity
15
in these layers. In addition, we observe that the profile retrieved using both bands is similar to the profile derived from theν4band alone, except near the surface, where it
tends to the retrieved profile using theν3band alone, confirming the complementarity
of the two windows in terms of vertical sensitivity.
4 Conclusions and perspectives
20
Thanks to the wide spectral range and low instrumental noise of the IASI/MetOp ther-mal infrared sounder, methane may be retrieved in two different spectral regions which
lead to different vertical sensitivities. We have firstly derived global distributions of
methane total columns using theν4absorption band. The retrieval spectral range,
ex-tending from 1240 to 1290 cm−1, has been chosen in order to avoid the spectroscopic
25
line mixing issues that can affect the methane retrievals which was shown to impact
ACPD
9, 7615–7643, 2009CH4 characterization from IASI
A. Razavi et al.
Title Page
Abstract Introduction
Conclusions References
Tables Figures
◭ ◮
◭ ◮
Back Close
Full Screen / Esc
Printer-friendly Version
Interactive Discussion
a clear North-South gradient with a sharp increase (about 8.7%) from 30◦N to higher latitudes. We have shown that these distributions retrieved from theν4band are mostly
representative of methane concentrations in the middle troposphere, from 4 to 10 km. The retrieval error (which accounts for the smoothing error, measurement error and the error from the humidity profile) has been evaluated to about 1% on the methane
5
total column. As discussed in Sect. 3.1, a more quantitative evaluation of the accu-racy associated with the CH4 IASI derived product will only be possible when more ground-based measurements are available.
In this work, we have also demonstrated the possibility for IASI to add information on methane in the boundary layer using information from theν3 band when the reflected
10
solar radiation is high enough. Further studies will be conducted on a larger scale to work out the full extent of what this spectral region has to offer.
Further improvements in the IASI processing chain will be implemented in a near future. In particular, a faster retrieval method (FORLI which stands forFast Operational Retrievals on Layers for IASI) based on lookup tables is currently under construction.
15
This software will be able to provide nearly operational distribution of methane total columns. This method has been successfully applied to nitric acid (Wespes et al., 2009) and carbon monoxide (George et al., 2009).
The retrieval of methane global distributions daily will obviously be a major advance which will allow to take advantage of the IASI potential in terms of spatio-temporal
20
coverage and will also allow systematic validations with other available spaceborne (AIRS, SCIAMACHY) and ground-based measured data.
Acknowledgements. IASI has been developed and built under the responsibility of the Cen-tre National d’Etudes Spatiales (CNES, France). It is flown onboard the MetOp satellites as part of the EUMETSAT Polar System. The IASI L1 data are received through the EUMETCast
25
ACPD
9, 7615–7643, 2009CH4 characterization from IASI
A. Razavi et al.
Title Page
Abstract Introduction
Conclusions References
Tables Figures
◭ ◮
◭ ◮
Back Close
Full Screen / Esc
Printer-friendly Version
Interactive Discussion
References
Boynard, A., Clerbaux, C., Coheur, P.-F., Hurtmans, D., Turquety, S., George, M., Hadji-Lazaro, J., Keim, C., and Mayer-Arnek, J.: Measurements of total and tropospheric ozone from the IASI instrument: comparison with satellite and ozone sonde observations, Atmos. Chem. Phys. Discuss., in review, 2009. 7618
5
Clarisse, L., Coheur, P.-F., Prata, A. J., Hurtmans, D., Razavi, A., Hadji-Lazaro, J., Clerbaux, C., and Phulpin, T.: Tracking and quantifying volcanic SO2with IASI, the September 2007 erup-tion at Jebel-at-Tair, Atmos. Chem. Phys., 8, 7723–7734, 2008,
http://www.atmos-chem-phys.net/8/7723/2008/. 7618, 7619
Clarisse, L., Clerbaux, C., Dentener, F., Hurtmans, D., and Coheur, P.-F.: Infrared space
obser-10
vations unveil first global distribution of ammonia, Nature Geosci., submitted, 2009. 7618 Clerbaux, C., Hadji-Lazaro, J., Turquety, S., M ´egie, G., and Coheur, P.-F.: Trace gas
measure-ments from infrared satellite for chemistry and climate applications, Atmos. Chem. Phys., 3, 1495–1508, 2003,
http://www.atmos-chem-phys.net/3/1495/2003/. 7617
15
Clerbaux, C., Hadji-Lazaro, J., Turquety, S., George, M., Coheur, P.-F., Hurtmans, D., We-spes, C., Herbin, H., Blunmstein, D., Tournier, B., and Phulpin, T.: The IASI/MetOp mission: first observations and highlight of its potential contribution to the GMES Earth observation component, Space Res. Today, 168, 19–24, 2007. 7617
Clerbaux, C., Boynard, A., Clarisse, L., George, M., Hadji-Lazaro, J., Hurtmans, D., Herbin, H.,
20
Pommier, M., Razavi, A., Turquety, S., Wespes, C., and Coheur, P.-F.: Monitoring of atmo-spheric composition using the thermal infrared IASI/METOP sounder, Atmos. Chem. Phys. Discuss., accepted, 2009. 7624
Coheur, P.-F., Barret, B., Turquety, S., Hurtmans, D., Hadji-Lazaro, J., and Clerbaux, C.: Re-trieval and characterization of ozone vertical profiles from a thermal infrared nadir sounder,
25
J. Geophys. Res., 5, 4599–4639, 2005. 7618, 7619
Coheur, P.-F., Clarisse, L., Turquety, S., Hurtmans, D., and Clerbaux, C.: IASI measurements of reactive trace species in biomass burning plumes, Atmos. Chem. Phys., in review, 2009. De Mazi `ere, M., Vigouroux, C., Bernath, P. F., Baron, P., Blumenstock, T., Boone, C.,
Brog-niez, C., Catoire, V., Coffey, M., Duchatelet, P., Griffith, D., Hannigan, J., Kasai, Y., Kramer, I.,
30
ACPD
9, 7615–7643, 2009CH4 characterization from IASI
A. Razavi et al.
Title Page
Abstract Introduction
Conclusions References
Tables Figures
◭ ◮
◭ ◮
Back Close
Full Screen / Esc
Printer-friendly Version
Interactive Discussion methane profiles from the upper troposphere to the lower mesosphere, Atmos. Chem. Phys.,
8, 2421–2435, 2008,
http://www.atmos-chem-phys.net/8/2421/2008/. 7617
Dentener, F., Derwent, R., Dlugokencky, E., Holland, E., Isaksen, I., Katima, J., Kirchhoff, V., Matson, P., Midgley, P., and M., W.: Climate Change 2001: The Scientific Basis. Contribution
5
of Working Group I to the Third Assessment Report of the Intergovernmental Panel on Cli-mate Change, chap. Atmospheric Chemistry and Greenhouse Gases, 239–287, Cambridge University Press, Cambridge, and New York, 2001. 7625
Dlugokencky, E. J., Houweling, S., Bruhwiler, L., Masarie, K. A., Lang, P. M., Miller, J. B., and Tans, P. P.: Atmospheric methane levels off: Temporary pause or a new steady-state?
10
Geophys. Res. Lett., 30, 1992, doi:10.1029/2003GL018126, 2003. 7617
Dueck, T. A., de Visser, R., Poorter, H., Persijn, S., Gorissen, A., de Visser, W., Schapen-donk, A., Verhagen, J., Snel, J., Harren, F. J. M., Ngai, A. K. Y., Verstappen, F., Bouwmeester, H., Voesenek, L. A. C. J., and van der Werf, A.: No evidence for substan-tial aerobic methane emission by terrestrial plants: a 13C-labelling approach, New Phytol.,
15
175, 29–35, doi:10.1111/j.1469-8137.2007.02103.x, 2007. 7617
Forster, P., Ramaswamy, V., Artaxo, P., Berntsen, T., Betts, R., Fahey, D. W., Haywood, J., Lean, J., Lowe, D. C., Myhre, G., Nganga, J., Prinn, R., Raga, G., Schulz, M., and Van Dor-land, R.: Climate Change 2007: The Physical Science Basis. Contribution of working group 1 to the fourth assessment report of the Intergovernmental Panel on Climate Change, chap.
20
Changes in Atmospheric Constituents and in Radiative Forcing, 129–234, Cambridge Uni-versity Press, Cambridge and New York, 2007. 7616
Frankenberg, C., Meirink, J. F., Bergamaschi, P., Goede, A. P. H., Heimann, M., K ¨orner, S., Platt, U., van Weele, M., and Wagner, T.: Satellite chartography of atmospheric methane from SCIAMACHY on board ENVISAT: Analysis of the years 2003 and 2004, J. Geophys.
25
Res., 111, D07303, doi:10.1029/2005JD006235, 2006. 7617, 7626
Frankenberg, C., Warneke, T., Butz, A., Aben, I., Hase, F., Spietz, P., and Brown, L. R.: Pres-sure broadening in the 2v3 band of methane and its implication on atmospheric retrievals, Atmos. Chem. Phys., 8, 5061–5075, 2008a,
http://www.atmos-chem-phys.net/8/5061/2008/. 7617
30
ACPD
9, 7615–7643, 2009CH4 characterization from IASI
A. Razavi et al.
Title Page
Abstract Introduction
Conclusions References
Tables Figures
◭ ◮
◭ ◮
Back Close
Full Screen / Esc
Printer-friendly Version
Interactive Discussion doi:10.1029/2008GL034300, 2008b. 7617, 7626
George, M., Clerbaux, C., Coheur, P.-F., Hadji-Lazaro, J., Hurtmans, D., Pommier, M., Tur-quety, S., Edwards, D., Worden, H., Luo, M., Rinsland, C. P., and Barnet, C.: Carbon monox-ide distributions from the IASI/METOP mission : evaluation with other spaceborne remote sensors, Atmos. Chem. Phys. Discuss., accepted, 2009. 7618, 7629
5
Hauglustaine, D. A., Hourdin, F., Jourdain, L., Filiberti, M.-A., Walters, S., Lamarque, J.-F., and Holland, E. A.: Interactive chemistry in the Laboratoire de M ´et ´eorologie Dynamique general circulation model: Description and background tropospheric chemistry evaluation, J. Geophys. Res., 109, D04314, doi:10.1029/2003JD003957, 2004. 7623
Herbin, H., Hurtmans, D., Clerbaux, C., Clarisse, L., and Coheur, P.-F.: H216O and HDO
mea-10
surements with IASI/MetOp, Atmos. Chem. Phys. Discuss., in review, 2009. 7618
Keppler, F., Hamilton, J. T. G., Braß, M., and R ¨ockmann, T.: Methane emissions from terrestrial plants under aerobic conditions, Nature, 439, 187–191, 2006. 7617
Keppler, F., Hamilton, J. T. G., McRoberts, W., Vigano, I., Braß, M., and R ¨ockmann, T.: Methoxyl groups of plant pectin as a precursor of atmospheric methane, New Phytol., 4, 808–814,
15
2008. 7617
Kulawik, S. S., Bowman, K. W., Luo, M., Rodgers, C. D., and Jourdain, L.: Impact of nonlin-earity on changing the a priori of trace gas profile estimates from the Tropospheric Emission Spectrometer (TES), Atmos. Chem. Phys., 8, 3081–3092, 2008,
http://www.atmos-chem-phys.net/8/3081/2008/. 7617
20
Mondelain, D., Payan, S., Deng, W., Camy-Peyret, C., Hurtmans, D., and Mantz, A. W.: Mea-surement of the temperature dependence of line mixing and pressure broadening param-eters between 296 and 90 K in the 3 band of 12CH4 and their influence on atmospheric methane retrievals, J. Molec. Spectrosc., 130–137, 2007. 7623
Park, M., Randel, W. J., Kinnison, D. E., Garcia, R. R., and Choi, W.: Seasonal variation of
25
methane, water vapor, and nitrogen oxides near the tropopause: Satellite observations and model simulations, J. Geophys. Res., 109, D03302, doi:10.1029/2003JD003706, 2004. 7617 Phulpin, T., Blumstein, D., Prel, F., Tournier, B., Prunet, P., and Schl ¨ussel, P.: Applications of IASI on MetOp-A: first results and illustration of potential use for meteorology, climate monitoring and atmospheric chemistry, Proc. SPIE, p. 6684, 2007. 7617
30
ACPD
9, 7615–7643, 2009CH4 characterization from IASI
A. Razavi et al.
Title Page
Abstract Introduction
Conclusions References
Tables Figures
◭ ◮
◭ ◮
Back Close
Full Screen / Esc
Printer-friendly Version
Interactive Discussion Chem. Phys., 6, 5605–5630, 2006,
http://www.atmos-chem-phys.net/6/5605/2006/. 7617
Rigby, M., Prinn, R., Fraser, P., Simmonds, P., Langenfelds, R., Huang, J., Cunnold, D., Steele, P., Krummel, P., Weiss, R., O’Doherty, S., Salameh, P., Wang, H., Harth, C., M ¨uhle, J., and Porter, L.: Renewed growth of atmospheric methane, Geophys. Res. Lett., 35, L22805,
5
doi:10.1029/2008GL036037, 2008. 7616
Rodgers, C. D.: Inverse methods for atmospheric sounding: theory and practise, University of Oxford, World Sci., River Edge, NJ, USA, 2000. 7619, 7621
Rothman, L. S., Jacquemart, D., Barbe, A., Benner, D. C., Birk, M., Brown, L. R., Carleer, M. R., Chackerian, C., Chance, K., Coudert, L. H., et al.: The HITRAN 2004 molecular
spectro-10
scopic database, J. Quant. Spectrosc. Rad. Trans., 96, 139–204, 2005. 7622
Tran, H., Flaud, P.-M., Gabard, T., Hase, F., von Clarmann, T., Camy-Peyret, C., Payan, S., and Hartmann, J.-M.: Model, software, and database for line-mixing effects in the 3 and 4 bands of CH4and tests using laboratory and planetary measurements. I. N2(and air) broadenings and the earth atmosphere, J. Quant. Spectrosc. Radiat. Trans., 101, 284–305, 2006. 7623
15
Turquety, S., Hadji-Lazaro, J., Clerbaux, C., Hauglustaine, D., Clough, S. A., Cass ´e, V., and Schl ¨ussel, P.: Operational trace gas retrieval algorithm for the infrared atmospheric sound-ing interferometer, J. Geophys. Res., 109(D21), D21301, doi:10.1029/2004JD004821, 2004. 7624
Turquety, S., Hurtmans, D., Hadji-Lazaro, J., Coheur, P.-F., Clerbaux, C., Josset, D., and
20
Tsamalis, C.: Tracking the emission and transport of pollution from wildfires using the IASI CO retrievals: analysis of of the summer 2007 Greek fires, Atmos. Chem. Phys. Discuss., accepted, 2009. 7618, 7624
Vigano, I., van Weelden, H., Holzinger, R., Keppler, F., McLeod, A., and R ¨ockmann, T.: Effect of UV radiation and temperature on the emission of methane from plant biomass and structural
25
components, Biogeosciences, 5, 937–947, 2008, http://www.biogeosciences.net/5/937/2008/. 7617
Wespes, C., Hurtmans, D., Clerbaux, C., Santee, M. L., Martin, R. V., and Coheur, P.-F.: Global distributions of nitric acid from IASI/MetOP measurements, Atmos. Chem. Phys. Discuss., in press, 2009. 7618, 7629
30
ACPD
9, 7615–7643, 2009CH4 characterization from IASI
A. Razavi et al.
Title Page
Abstract Introduction
Conclusions References
Tables Figures
◭ ◮
◭ ◮
Back Close
Full Screen / Esc
Printer-friendly Version
Interactive Discussion
Fig. 1. IASI normalised radiance spectrum in the two spectral regions containing methane
absorption (top), along with the main interfering species (bottom), plotted in transmittance. The grey area indicates the spectral regions used to retrieve methane. Left panel: The methane
ν4band extending from 1210 to 1390 cm− 1
. Right panel: Methane absorption lines (P branch) within theν3band centered at 3020 cm−
1
ACPD
9, 7615–7643, 2009CH4 characterization from IASI
A. Razavi et al.
Title Page
Abstract Introduction
Conclusions References
Tables Figures
◭ ◮
◭ ◮
Back Close
Full Screen / Esc
Printer-friendly Version
Interactive Discussion
Fig. 2. Comparison of two IASI spectra in brightness temperature. One spectrum is recorded
ACPD
9, 7615–7643, 2009CH4 characterization from IASI
A. Razavi et al.
Title Page
Abstract Introduction
Conclusions References
Tables Figures
◭ ◮
◭ ◮
Back Close
Full Screen / Esc
Printer-friendly Version
Interactive Discussion
Fig. 3.Simulation of a IASI spectrum with (red curve) and without (black curve) line mixing of
ACPD
9, 7615–7643, 2009CH4 characterization from IASI
A. Razavi et al.
Title Page
Abstract Introduction
Conclusions References
Tables Figures
◭ ◮
◭ ◮
Back Close
Full Screen / Esc
Printer-friendly Version
Interactive Discussion
Fig. 4. Illustration of the a priori information derived from the LMDZ model. The grey area
ACPD
9, 7615–7643, 2009CH4 characterization from IASI
A. Razavi et al.
Title Page
Abstract Introduction
Conclusions References
Tables Figures
◭ ◮
◭ ◮
Back Close
Full Screen / Esc
Printer-friendly Version
Interactive Discussion
Fig. 5.Averaging kernels presented in mixing ratios unit for representative cases of(a)tropical,
ACPD
9, 7615–7643, 2009CH4 characterization from IASI
A. Razavi et al.
Title Page
Abstract Introduction
Conclusions References
Tables Figures
◭ ◮
◭ ◮
Back Close
Full Screen / Esc
Printer-friendly Version
Interactive Discussion
Fig. 6.Error profiles for methane retrievals in theν4band. The contributions from the
ACPD
9, 7615–7643, 2009CH4 characterization from IASI
A. Razavi et al.
Title Page
Abstract Introduction
Conclusions References
Tables Figures
◭ ◮
◭ ◮
Back Close
Full Screen / Esc
Printer-friendly Version
Interactive Discussion
Fig. 7.Methane global distribution express in averaged vmr (ppm) and interpolated on a 2◦×2◦
ACPD
9, 7615–7643, 2009CH4 characterization from IASI
A. Razavi et al.
Title Page
Abstract Introduction
Conclusions References
Tables Figures
◭ ◮
◭ ◮
Back Close
Full Screen / Esc
Printer-friendly Version
Interactive Discussion
Fig. 8. Simulations of two spectra with a difference of 5% in the methane total column. In
ACPD
9, 7615–7643, 2009CH4 characterization from IASI
A. Razavi et al.
Title Page
Abstract Introduction
Conclusions References
Tables Figures
◭ ◮
◭ ◮
Back Close
Full Screen / Esc
Printer-friendly Version
Interactive Discussion
Fig. 9. Averaging kernels (in units of mixing ratios) corresponding, respectively to the retrieval
ACPD
9, 7615–7643, 2009CH4 characterization from IASI
A. Razavi et al.
Title Page
Abstract Introduction
Conclusions References
Tables Figures
◭ ◮
◭ ◮
Back Close
Full Screen / Esc
Printer-friendly Version
Interactive Discussion
Fig. 10. Methane profiles retrieved from different spectral regions. Using the same a priori
profile (black curve), the blue profile is derived from theν4band, the orange one from the ν3